S O F T W A R E
Open Access
SyRI: finding genomic rearrangements and
local sequence differences from
whole-genome assemblies
Manish Goel
1, Hequan Sun
1, Wen-Biao Jiao
1and Korbinian Schneeberger
1,2*Abstract
Genomic differences range from single nucleotide differences to complex structural variations. Current methods typically annotate sequence differences ranging from SNPs to large indels accurately but do not unravel the full complexity of structural rearrangements, including inversions, translocations, and duplications, where highly similar sequence changes in location, orientation, or copy number. Here, we present SyRI, a pairwise whole-genome comparison tool for chromosome-level assemblies. SyRI starts by finding rearranged regions and then searches for differences in the sequences, which are distinguished for residing in syntenic or rearranged regions. This distinction is important as rearranged regions are inherited differently compared to syntenic regions.
Keywords:Genome comparison, Structural rearrangements, Structural variations, Variant calling, Genome alignments, Genetics, Genome assembly
Background
Genomic differences form the basis for phenotypic vari-ation and allow us to decipher evolutionary past and gene function. Differences in genomes can range from single nu-cleotide differences to highly complex genomic rearrange-ments, and they are commonly described as local sequence differences in comparison to a reference sequence. But even though the annotation of all sequence differences against a reference sequence would be sufficient to reconstruct the actual sequence of a genome, sequence differences alone cannot describe the complex genomic rearrangements. For example, a translocation is a genomic rearrangement where a specific sequence has moved from one region in the gen-ome to another region. Although such a translocation could be described as a deletion at one region and an insertion at the other region, this annotation would miss the informa-tion that the deleted/inserted sequence is the same and that the deleted sequence is actually not deleted but rather relo-cated to a different region. Like translocations, inversions and duplications also introduce differences in the genome structure by changing location, orientation, and/or copy number of specific sequences. But even though this
information is usually not considered when analyzing whole-genome sequencing data, differences in genome structure are relevant as they can be the basis for diseases phenotypes [1], reproductive strategies [2–4], and survival strategies [5].
Many of the state-of-the-art methods used to predict genomic differences utilize short or long read alignments against reference sequences [6]. Even though such align-ments allow to find local sequence differences (like SNPs, indels, and structural variations) with high accur-acy, accurate prediction of structural differences remains challenging. In contrast, whole-genome assemblies en-able the identification of complex rearrangements as the assembled contigs are typically much longer and of higher quality as compared to raw sequence reads [7]. However, despite recent technological improvements to simplify the generation of whole-genome de novo assem-blies [8], there are so far only a few tools which use whole-genome assemblies as the basis for the identifica-tion of genomic differences [9]. Available tools include AsmVar, which compares individual contigs of an assem-bly against a reference sequence and analyzes alignment breakpoints to identify inversions and translocations [10]; Assemblytics, which utilizes uniquely aligned regions within contig alignments to a reference sequence to
© The Author(s). 2019Open AccessThis article is distributed under the terms of the Creative Commons Attribution 4.0 International License (http://creativecommons.org/licenses/by/4.0/), which permits unrestricted use, distribution, and reproduction in any medium, provided you give appropriate credit to the original author(s) and the source, provide a link to the Creative Commons license, and indicate if changes were made. The Creative Commons Public Domain Dedication waiver (http://creativecommons.org/publicdomain/zero/1.0/) applies to the data made available in this article, unless otherwise stated. * Correspondence:schneeberger@mpipz.mpg.de
1Max Planck Institute for Plant Breeding Research, 50829 Cologne, Germany 2
identify various types of genomic differences including large indels or differences in local repeats [11]; and Smartie-sv, which compares individual alignments be-tween assembly and reference sequences [12].
Here, we introduce SyRI (Synteny and Rearrangement Identifier), a method to identify structural as well as se-quence differences between two whole-genome assem-blies. SyRI expects whole-genome alignments (WGA) as input and starts by searching for differences in the struc-tures of the genomes. Afterwards, SyRI identifies local sequence differences within both the rearranged and the non-rearranged (syntenic) regions. SyRI annotates the coordinates of rearranged regions (i.e., breakpoints on both sides of a rearrangement in both genomes) provid-ing a complete regional annotation of rearrangements. This is a significant improvement compared to current methods which typically do not predict both breakpoints for all rearrangements in both of the genomes [13–15].
Moreover, commonly used tools have limited func-tionality in identifying transpositions (i.e., the relocation of a sequence within a chromosome) and distal duplica-tions. SyRI provides an efficient method for accurate identification of all common rearrangements including transpositions and duplications. For simplicity, unless specified otherwise, we refer to transpositions and trans-locations together as “translocations” and “duplications” refer to both distal and tandem duplications.
Finally, we validate SyRI’s performance with simula-tions and in comparison with existing tools developed for the identification of genomic differences. We also apply SyRI to divergent genomes of five model species, including twoArabidopsis thaliana strains, for which we experimentally validate over 100 predicted translocations.
Results
The hierarchy in genomic differences
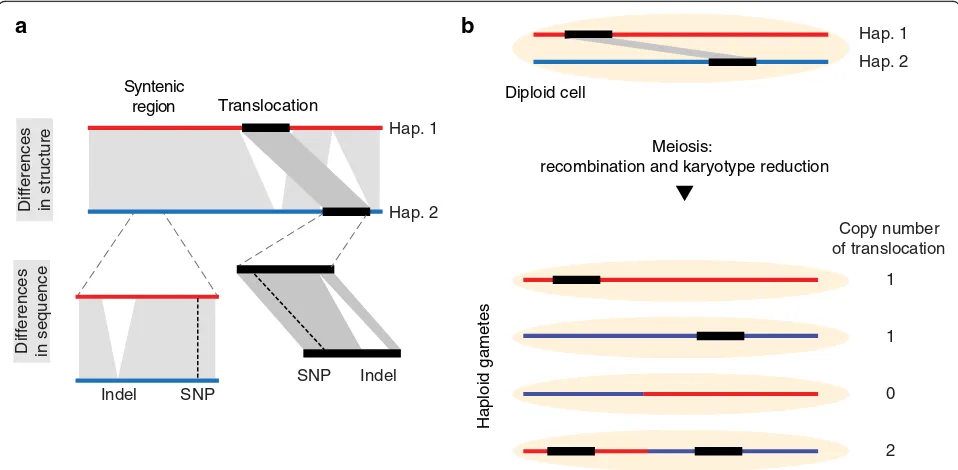
Genomes can differ in structure as well as in sequence.
Differences in structure occur if highly similar regions have different copy numbers, locations, or orientations between different genomes. Here, we will refer to these regions as rearranged regions, whereas all conserved re-gions are referred to as syntenic. In contrast, differences in sequence are variations in the nucleotide sequence resulting in SNPs, indels, and so on.
It is important to note that differences in sequence can occur in both, syntenic as well as rearranged regions (Fig. 1a). This introduces a hierarchy into the variations in genomes where, for example, a SNP can be present within a translocated region. Even though resequencing analyses usually do not distinguish between sequence differences in syntenic versus rearranged regions, this distinction is important as some rearranged regions (and the local sequence differences in them) do not follow Mendelian segregation patterns in the offspring. Instead,
due to the different locations in a genome, the inherit-ance of rearrangements can lead to changes in copy number or even loss of the rearranged regions (Fig.1b).
How SyRI works
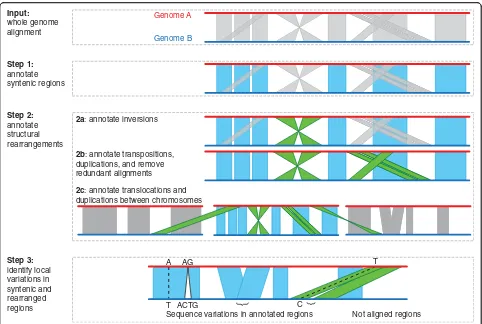
SyRI is a whole-genome comparison tool that annotates differences in structure and sequence between two whole-genome assemblies (Fig.2). It starts by identifying all syntenic regions between the two genomes. Since all non-syntenic regions are rearranged by definition, iden-tifying syntenic regions identifies rearranged regions at the same time (Fig. 2: Step 1). In a second step, SyRI groups the rearranged regions into inversions, transloca-tions, and duplications (Fig. 2: Step 2). As the last step, SyRI identifies sequence differences within both rear-ranged and syntenic regions (Fig.2: Step 3).
To perform these three steps, SyRI generates differ-ent genome graphs from the local alignments from a pairwise whole-genome alignment (WGA). Here, we used the MUMmer3 toolbox to perform WGA [16,
17], but other alignment tools like minimap2 [18] can be used as well (Additional file 1: Note 1). In the fol-lowing, we describe the individual steps of SyRI in more detail.
Step 1: Syntenic region identification
SyRI identifies syntenic regions by selecting the longest, non-contradicting subset of aligned regions which are all syntenic to each other. For this, it selects all forward alignments between a pair of homologous chromosomes and generates a genome graph in the form of a directed acyclic graph (DAG) (Additional file 1: Note 2, Figure S1). SyRI then uses dynamic programming to identify the highest scoring path from the nodes that represent one end of a chromosome to the nodes that represent the other end (using similar algorithms as implemented in MUMmer [19, 20]). This process is repeated for each pair of homologous chromosomes.
Step 2a: Inversion identification
annotations (Additional file 1: Figure S3b), SyRI com-pares the annotations of all candidate inversions simul-taneously and selects the best set of non-overlapping non-conflicting inversions while maximizing the overall alignment score of the two genomes.
Step 2b: Translocation and duplication (TD) identification After synteny and inversion identification, all remaining alignments are either footprints of TDs or are redundant (repetitive) alignments (Additional file 1: Note 4, Figure S4-S7). SyRI analyzes these alignments to find TDs while removing redundant alignments. For this, SyRI first groups the alignments such that each group represents all alignments of a putatively rearranged region (candi-date TD) (Additional file 1: Figure S5, S6). Each candi-date TD is given a score based on its alignment length and gap length between consecutive alignments. Low scoring candidates and those that are overlapping with syntenic or inverted regions are filtered out.
As a result of repeats, rearranged regions can have dif-ferent candidate TDs aligning to difdif-ferent copies of the same repeat region. Therefore, overlapping candidate TDs often result in conflicting annotations. SyRI resolves these overlapping candidate TDs by selecting the non-conflicting subset of candidate TDs with the highest align-ment score (Additional file1: Note 4, Figure S5, S7).
Grouping of alignments to generate annotation
blocks After identifying syntenic and rearranged
alignments, SyRI combines all neighboring alignments of the same type to form annotation blocks. For ex-ample, a syntenic block would contain all consecutive syntenic alignments. Likewise, inversion or TD blocks include all alignments which together form the extent of an inversion or a TD.
Step 3: Identification of sequence differences
SyRI annotates small variations (like SNPs and small indels) which are found in the local alignments gener-ated by the whole-genome alignment algorithm as well as larger structural variations (like indels or CNVs), which are not part of the local alignments. To find these structural variations, SyRI analyzes the gaps and overlaps between all consecutive alignments in annotation blocks and identifies indels, highly divergent regions (HDRs), and CNVs/tandem repeats (Additional file 1: Figure S8) similar to the SV identification of Assemblytics [11]. Finally, SyRI also reports all un-aligned regions which are not part of any annotation block.
Performance evaluation using simulated genomes
We simulated 600 rearranged genomes by randomly inserting inversions, transpositions, translocations, tan-dem duplications, distal duplications, and indels into the reference genome of A. thaliana (the “Methods” sec-tion). We used these genomes to compare SyRI’s per-formance with six other tools. These included tools based on whole-genome assemblies like AsmVar,
1
0 1
2 Hap. 1 Hap. 2
Copy number of translocation Meiosis:
recombination and karyotype reduction
Haploid gametes
Diploid cell
b
a
Hap. 1
Hap. 2 Translocation
Syntenic region
SNP Indel
Dif
ferences
in structure
Dif
ferences
in sequence
SNP Indel
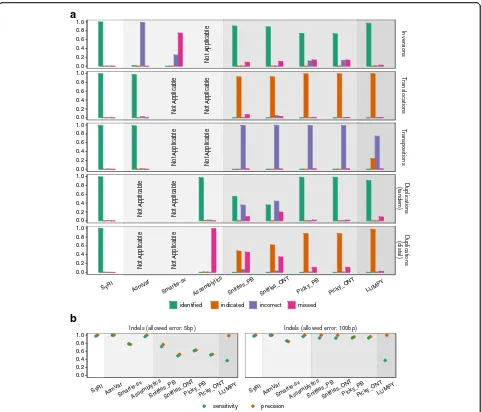
[image:3.595.58.537.88.323.2]smartie-sv, and assemblytics as well as tools which re-quired long reads (sniffles and picky) or short reads (LUMPY) as input [10–15]. For the tools that required sequencing reads data as input, we simulated reads from the simulated genome and aligned them to the reference sequence (the “Methods” section). For all assembly-based methods, we used the simulated genomes directly. Since each of the tools annotated rearrangements in a slightly different manner, we introduced different cat-egories of success to unify their performance similar to an earlier study [13]: a structural rearrangement was considered to be “identified” when all breakpoints were identified together (as one annotation) and had correct annotation,“indicated”when at least one breakpoint was identified with correct annotation, “incorrect” when at least one breakpoint was identified but the annotation was wrong, and “missed” when none of the breakpoints was identified (Additional file 1: Figure S9). For indels,
we compared the location and size of the predicted and simulated variations. As the assembly-based methods were not designed to identify all different types of rear-rangements, we assessed their performance only for re-arrangements which they were designed for.
In our analysis, SyRI identified most of the rearrange-ments accurately (Fig. 3a). AsmVar performed well for identification of transpositions and translocations, but both AsmVar and Smartie-sv were not able to identify inversions correctly. Assemblytics was able to find most of the tandem duplications correctly, but missed distal duplications. All read-based methods showed similar performance. These methods could identify many of the simulated inversions and tandem duplications; however, for rearrangements involving relocation of genomic re-gions in the two genomes (transpositions, translocations, and distal duplications), these tools were not able to identify rearrangements correctly. For translocations and
A T
C Genome B
Genome A Input:
whole genome alignment
Step 1:
annotate syntenic regions
Step 2:
annotate structural rearrangements
Step 3:
identify local variations in syntenic and rearranged regions
2a: annotate inversions
2b: annotate transpositions, duplications, and remove redundant alignments
2c: annotate translocations and duplications between chromosomes
Sequence variations in annotated regions Not aligned regions T
AG
ACTG
[image:4.595.57.539.86.410.2]distal duplications, these tools indicated the presence of these variations; however, they either could not identify all breakpoints or could not identify them as one re-arrangement. For transpositions, these methods could find breakpoints; however, the breakpoints were typically not annotated as transpositions. False-positive rates were low in general (Additional file 1: Figure S10) except when identifying transpositions and distal duplications. All tools identified indels with high sensitivity and precision; how-ever, assembly-based methods (SyRI, AsmVar, and Assemblytics) were generally more accurate (Fig.3b).
This analysis showed that SyRI can predict rearrange-ments with high accuracy. It can identify all possible
rearrangements and provide complete information about the corresponding breakpoints in both genomes. This advantage of SyRI results from the different identifica-tion strategy of SyRI, which is based on full-length as-semblies that are not required by other tools.
Performance evaluation using real genomes
To test SyRI’s performance with real data, we applied it to identify the variations in the human genome NA19240 for which gold standard variation data were recently published (Additional file 1: Figure S11, the
“Methods”section) [21]. These gold standard variation data include differences which were predicted based on
whole-Not
Appl
ic
abl
e
N
o
t A
p
plicable
N
o
t A
p
plicable
N
o
t A
p
plicable
N
o
t A
p
plicable
N
o
t A
p
plicable
N
o
t A
p
plicable
N
o
t A
p
plicable
N
o
t A
p
plicable
Inversions
T
ranslocations
T
ranspositions
Duplications
(tandem)
Duplications
(distal)
SyRI AsmV ar
Smartie-sv Assemblytics Sniffles_PB Sniffles_ONT Picky_PB Picky_ONT LUMPY
0.0 0.2 0.4 0.6 0.8 1.0
0.0 0.2 0.4 0.6 0.8 1.0
0.0 0.2 0.4 0.6 0.8 1.0
0.0 0.2 0.4 0.6 0.8 1.0
0.0 0.2 0.4 0.6 0.8 1.0
identified indicated incorrect missed
a
Indels (allowed error: 5bp) Indels (allowed error: 100bp)
SyRI AsmVarSmartie-sv
AssemblyticsSniffles_PBSniffles_ONTPicky_PBPicky_ONTLUMPY SyRI AsmV ar
Smartie-svAssemblyticsSniffles_PBSniffles_ONTPicky_PBPicky_ONTLUMPY
0.0 0.2 0.4 0.6 0.8 1.0
sensitivity precision
b
[image:5.595.58.539.86.498.2]genome shotgun read alignments against the reference se-quence and, therefore, include variations from both haplo-types of this genome. In addition, a whole-genome assembly, which includes only one of the two haplotypes, is available as well [22]. Using this whole-genome assembly in comparison to the reference sequence, SyRI identified 55.2% (9685 out of 17,545) of the gold standard insertions, 54.5% (9494 out of 17,391) of the deletions, and 49.7% (81 out of 163) of the inversions (Additional file1: Figure S12,
the “Methods” section), which is consistent with the
presence of only one of the haplotypes in the assembly. In comparison to the other tools tested here, SyRI identified a higher proportion of different types of genomic variations of the gold standard variation data (Additional file 1: Figure S12).
For a second comparison, we generated a chromosome-level assembly of the (homozygous)A. thalianaLergenome using long PacBio reads. The assembly CN50 and CL50 values (chromosome number normalized N50 and L50 values) were 12.6 Mb and 1 respectively (Additional file 2: Table S1, the “Methods” section, Additional file1: Figure S13) [23]. We again applied the other tools to identify differences between the Col-0 and Ler genomes (Additional file 1: Figure S14, the “Methods” sec-tion). For read-based methods, we observed falsely annotated deletions and tandem duplications (Add-itional file2: Table S2), which were in fact transpositions and distal duplications, but were mis-annotated as large local variations (Additional file1: Figure S15).
Effect of genome contiguity
SyRI requires whole-genome alignments from chromosome-level assemblies as input. If one or both of the assemblies is/ are incomplete, pseudo-chromosomes can be generated using homology between the assemblies themselves or using homology to a chromosome-level reference sequence using tools like RaGOO (Additional file 1: Note 5, [24]). To analyze the effect of the contiguity of the original assembly on SyRI’s performance, we performed a simulation ana-lysis where we first generated multiple incomplete as-semblies from the chromosome-level assembly of A. thaliana Ler by randomly breaking the chromosome-level scaffolds in unconnected pieces (the “Methods” section). These scattered assemblies were then reas-sembled with RaGOO using their homology to the A. thalianaCol-0 reference genome.
We then identified rearranged regions in each of these re-assemblies by comparing them to the reference sequence using SyRI. This was then compared to the results SyRI generated when comparing the original chromosome-level assembly of Leragainst the reference sequence.
More than 90% of the assemblies with N50 of more than 470 kb (before the homology-based reassembly) had a sensitivity of more than 0.9 (Fig. 4). Similarly,
more than 90% of the assemblies with N50 more than 674 kb had a precision of more than 0.9. The shortest assemblies we generated had N50 values in the range of 470–500 kb, and the predictions based on these assem-blies still had average sensitivity and precision values of 0.92 and 0.90 respectively.
We then evaluated SyRI’s efficiency in identifying rear-ranged regions when both genomes are at scaffold level. For this, we generated scattered assemblies from both the Col-0 reference sequence and the Ler assembly. Since current pseudo-chromosome generation tools only concatenate scaffolds of one assembly using homology with another assembly, we developed a heuristic script to generate homology-based pseudo-chromosomes using two incomplete assemblies (Additional file 1: Note 5). As before, we identified rearranged regions from these pseudo-genomes and compared them to the rearranged regions identified between the full-length assemblies. For assemblies with N50 values of more than 868 kb and 721 kb, sensitivity and precision values were more than 0.7 in more than 70% of the cases (Additional file 1: Figure S16). For assemblies with lower contiguity (N50: 470–500 kb), the average sensitivity and precision were 0.56 and 0.65, respectively.
Together, this shows that the prediction of genomic rearrangements is nearly complete even if one of the ge-nomes is not on chromosome-level, but has assembly contiguity of N50 > 500 kb. If both assemblies are not on chromosome-level, the quality of the predictions is re-duced; however, it is still possible to get useful insights on a subset of the rearrangements.
Runtime estimation when comparing human, yeast, fruit fly, and maize genomes
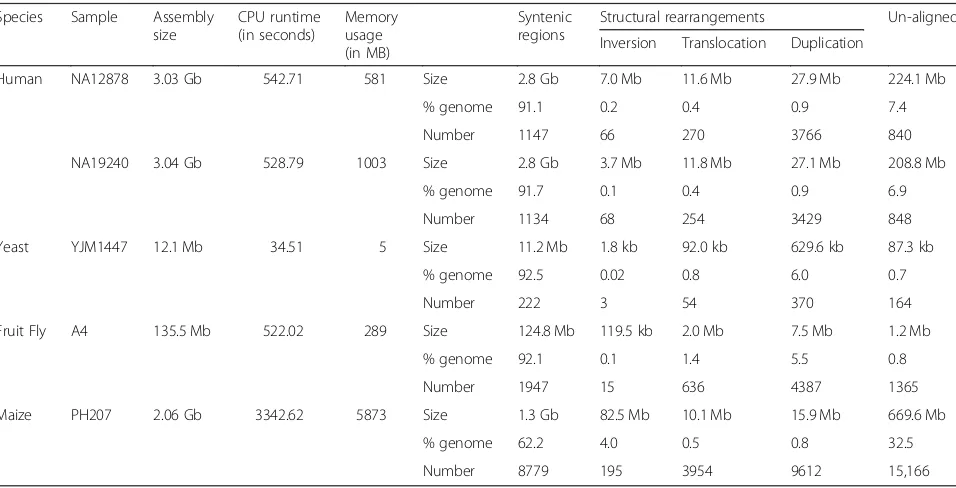
To analyze SyRI’s runtime performance, we searched for intra-species genomic differences in four different model organisms: human, yeast, fruit fly, and maize (Additional file 2: Table S1). For its application to hu-man genomes, we compared whole-genome assem-blies of NA12878 and NA19240 against the reference genome GRCh38.p12 [22, 25]. For yeast, we compared the de novo assembly of strain YJM1447 against the reference genome from strain S288C [26, 27]. For fruit fly (Drosophila melanogaster), the de novo assembly of strain A4 was compared to the reference genome [28,29]. For maize, we compared the de novo assembly of PH207 against the B73 reference genome [30,31]. To limit compu-tational requirements, we masked the highly repetitive maize genome while all other genomes were analyzed with-out masking [32].
34.5 s, whereas for the two human genomes SyRI took ~ 10 min, while memory usage was less than 1 GB for each of the comparisons (Table1) (without considering SNPs and small indels parsing). The exception was the com-parison of the repetitive maize genomes, which took ~ 1 h of CPU time and ~ 6GB of RAM. Since SyRI considers all alignment combinations, the runtime and memory usage can be high in repetitive genomes (Additional file1: Note 6 and Figure S22). However, the number of align-ments can be drastically reduced by decreasing the WGA sensitivity (i.e., omitting small, 10–100 s bp align-ments), which in turn decreases runtime and memory consumption of SyRI.
Experimental validation
To validate some of the predicted translocations in the genome ofA. thaliana Ler, we used a genetic approach which was based on the observation that recombinant
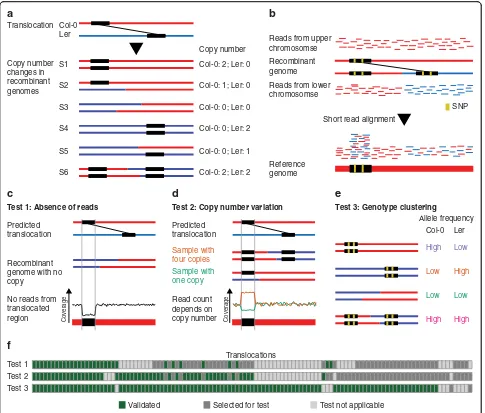
offspring genomes feature different copy numbers of translocated DNA (Fig. 1b; 5a), while non-translocated regions always occur with the same copy number. The actual copy number of translocated DNA in a recombin-ant genome relies on the genotypes at the two insertion sites of the translocation. For example, translocated DNA is duplicated if the two insertion sites of a trans-location are combined into one recombinant haplotype.
We used available whole-genome sequencing data of a set of 50 F2 recombinant plants, which were generated by crossing Col-0 and Ler, followed by self-pollination of the resulting F1hybrids [33]. We aligned the short reads (~ 5x genome coverage/sample) to the Col-0 reference sequence and used the genotypes at ~ 500 k SNP markers to reconstruct the parental haplotypes using TIGER (Fig.5b) [34,35].
Based on this haplotype information, we estimated the expected copy number for 117 translocations, which
Sensitivity Precision
1 Mb 3 Mb 10 Mb 1 Mb 3 Mb 10 Mb
0.5 0.6 0.7 0.8 0.9 1.0
N50
[image:7.595.58.540.88.214.2]Fig. 4Rearrangement identification from incomplete assemblies. SyRI’s performance for the identification of rearranged regions from incomplete assemblies. Points represent simulated incomplete assemblies, and the black lines represent the polynomial fit
Table 1Structural differences identified by SyRI and corresponding computational resources
Species Sample Assembly size
CPU runtime (in seconds)
Memory usage (in MB)
Syntenic regions
Structural rearrangements Un-aligned
Inversion Translocation Duplication
Human NA12878 3.03 Gb 542.71 581 Size 2.8 Gb 7.0 Mb 11.6 Mb 27.9 Mb 224.1 Mb
% genome 91.1 0.2 0.4 0.9 7.4
Number 1147 66 270 3766 840
NA19240 3.04 Gb 528.79 1003 Size 2.8 Gb 3.7 Mb 11.8 Mb 27.1 Mb 208.8 Mb
% genome 91.7 0.1 0.4 0.9 6.9
Number 1134 68 254 3429 848
Yeast YJM1447 12.1 Mb 34.51 5 Size 11.2 Mb 1.8 kb 92.0 kb 629.6 kb 87.3 kb
% genome 92.5 0.02 0.8 6.0 0.7
Number 222 3 54 370 164
Fruit Fly A4 135.5 Mb 522.02 289 Size 124.8 Mb 119.5 kb 2.0 Mb 7.5 Mb 1.2 Mb
% genome 92.1 0.1 1.4 5.5 0.8
Number 1947 15 636 4387 1365
Maize PH207 2.06 Gb 3342.62 5873 Size 1.3 Gb 82.5 Mb 10.1 Mb 15.9 Mb 669.6 Mb
% genome 62.2 4.0 0.5 0.8 32.5
[image:7.595.59.537.488.732.2]were larger than 1 kb, in each of the samples. The ex-pected copy number was then compared to the outcome of three different tests. The first two tests were based on the assumption that all reads from a translocated region align to the same loci in the reference genome inde-pendent of the actual location of the rearranged region in the sequenced sample (Fig.5b) [36]. This allows esti-mating copy number of a translocation using read cover-age in the respective region of the reference. For the first test, we analyzed the absence of reads in translocated re-gions in recombinant genomes, which were predicted to feature no copy of the translocated region (Fig. 5c)
(using 0.2x read coverage as a cut-off to distinguish be-tween absence or presence of a translocation). For the second test, we assessed the goodness-of-fit between ex-pected copy number and observed copy number for a translocation across all recombinants (as estimated from the normalized read counts in the translocation regions; Fig.5d; the“Methods”section). The third test was based on the sequence differences between the different alleles of a translocation. For this, we tested differences in the read counts supporting either the Col-0 (or Ler) alleles of a translocation. Depending on the copy number of the different alleles of a translocation, the allele count Translocation
S1
S2
S3
S4
S5
S6
Col-0: 2; Ler: 0 Col-0
Ler
Col-0: 1; Ler: 0
Col-0: 0; Ler: 0
Col-0: 0; Ler: 2
Col-0: 0; Ler: 1
Col-0: 2; Ler: 2 Copy number
changes in recombinant genomes
Short read alignment
Reference genome Recombinant genome
Reads from upper chromosomse
Reads from lower chromosomse Copy number
SNP
Predicted translocation
Predicted translocation
Recombinant genome with no copy
No reads from translocated
region Coverage Coverage
Sample with four copies
Sample with one copy
Test 3 Test 2 Test 1
Validated Selected for test Test not applicable Translocations
b
f
a
c
d
Test 1: Absence of reads Test 2: Copy number variation
Allele frequency Col-0 Ler
High High
High Low
High Low
Low Low
e
Test 3: Genotype clustering
Read count depends on copy number
[image:8.595.57.542.87.500.2]should also vary. In consequence, samples with the same genotypes at the two loci of a translocation should have similar allele counts, whereas samples with different ge-notypes should also show different allele counts (Fig.5e; the“Methods”section).
Out of 117 translocations, 108 (92.3%) could be con-firmed by at least one test (Fig. 5f). We manually checked the read alignments of the nine translocations that could not be confirmed and found support for the existence of each of the translocations, which however had not been strong enough to be identified by any of the three test criteria. In summary, this supports that a large majority of the translocations predicted by SyRI are real.
Discussion
We introduced SyRI, a tool that identifies genomic dif-ferences between two whole-genome assemblies. The genomic differences include structural differences as well as differences in sequences. However, instead of identify-ing differences directly, SyRI starts by identifyidentify-ing all syn-tenic regions between the genomes, as all other (non-syntenic) regions are rearranged by definition.
Once the structural rearrangements are found, SyRI identifies local sequence differences in both syntenic and rearranged regions. The identification of local sequence differences in rearranged regions introduces a hierarchy of genomic variations (e.g., SNPs in translocated gions). This distinction is important as rearranged re-gions are differently inherited as compared to syntenic regions. If this is not accounted for, genotypes in rear-ranged SNPs can confound the interpretation of gen-omic patterns during selection screens, genome-wide association, or recombination analysis [37,38]. SyRI now offers a straight-forward solution to filter SNPs in rear-ranged regions assuming whole-genome assemblies are available.
Compared to sequencing reads, whole-genome assem-blies are much more powerful in predicting genomic re-arrangements. SyRI utilizes the information in whole-genome assemblies to identify all breakpoints in both reference and query genomes, providing a more compre-hensive and accurate annotations compared to read alignment-based methods. Finally, though SyRI is based on a genome graph that is built up from the local align-ments of a WGA, this algorithm can be easily adapted for rearrangement identification in other types of gen-ome graphs as well [39,40].
Conclusions
We have developed SyRI which, to our knowledge, is the first tool to identify all structural and sequence differ-ences between two chromosome-level genome assem-blies. Its novel approach is highly efficient and provides
a classification of sequence differences for being in syn-tenic or rearranged regions. Using SyRI, we identified genomic rearrangements and sequence differences in humans,A. thaliana, fruit fly, yeast, and maize genomes. Additionally, we validated the existence of more than 100 predicted translocations. SyRI is available as an open source tool and is being actively developed and improved.
Methods
Long read sequencing of the genome ofA. thalianaLer
A. thalianaLerplants were grown in the greenhouse at the Max Planck Institute for Plant Breeding Research. DNA was extracted using the NucleoSpin® Plant II Maxi Kit from Macherey-Nagel. We used the PacBio template prep kit > 20 kb for Sequel systems (SMRTbell Template Prep Kit 1.0-SPv3) with damage repair (SMRTbell Dam-age Repair Kit -SPv3) and BluePippin size selection for fragments > 9/10 kb. Sequencing of two SMRT cells was done with the Sequel Sequencing Plate 1.2 and the Se-quel Binding Kit 1.0. Movie Time 360 min.
Assembly generation
We filtered the PacBio reads (removed size < 50 bp or QV < 80 reads) using SMRTLink5 and generated de novo assembly using Falcon, Canu, and MECAT [41–
43]. We polished the assemblies using Arrow from SMRTLink5, used SAMTools to identify small assembly errors, and then removed them with Illumina short reads mapping using BWA [44, 45]. We selected the Falbased assembly as it showed the highest assembly con-tiguity. Using whole-genome alignment between Falcon and Canu or MECAT assemblies, we further joined few contigs. Contigs aligning to multiple chromosomes were split if the conflicting region was not supported by Illu-mina short reads. The contigs from organellar DNA se-quences were removed, and all others were anchored into pseudo-chromosome based on homology with the reference sequence. Adjacent contigs were connected with a stretch of 500“N”characters. To note, the assem-bly of the Ler accession was also described in a recent study (preprint [46]).
Whole-genome alignments
thedelta-filtertool, and the filtered delta files were converted to the tab-delimited files using the show-coords command. Before whole-genome alignments, both maize genomes were masked using RepeatMasker v4.0.6 [47].
Simulating rearranged genomes
We simulated structural rearrangements in the A. thali-anareference genome using theRpackage RSVSimand SURVIVOR [48, 49]. We simulated 40, 436, 100, 100, and 1241 events for inversions, transpositions, transloca-tions, tandem duplicatransloca-tions, and distal duplications re-spectively, and for each rearrangement, 100 genomes were simulated. For inversions, transpositions, and distal duplications, the number of rearrangements and their corresponding sizes were sampled from real differences found between the Col-0 and Ler genomes. For tandem duplications, the size of the duplicated region ranged from 100 to 1000 bp, whereas translocations ranged from 1000 to 5000 bp long. For simulating indels, we used SURVIVOR to simulate 100 genomes containing 1000 indels in the range of 1–500 bps.
From these rearranged genomes, we simulated PacBio and Nanopore reads using SURVIVOR. We used the A. thaliana long read data generated by Michael et al. (NCBI project accession: PRJEB21270) to generate read profiles required by SURVIVOR and simulated reads to get a 30x coverage [50]. Short reads were simulated using wgsim (parameters used: -e 0.001 -d 550 -N 12000000 -1 150 -2 150) to get 30x coverage [51]. All reads were aligned to the A. thaliana reference genome using minimap2, and the alignments were converted from SAM to BAM format and sorted using samtools [18,44].
Running tools on simulated genomes
SyRI: Genome assemblies were aligned using nucmer (Additional file 2: Table S3), and SyRI was run with de-fault parameters. Assemblytics: We used the same align-ments generated by nucmer as used for SyRI. The default value for unique sequence length was used, and variants size was set from 1 to 100,000 bp. AsmVar: The tool was run based on the demo script provided with the tool. For genome alignment, lastdb was run using the default parameters, whereas lastal and last-split were run using the parameters provided in the demo [52]. Simi-larly, variants were detected using the ASV_VariantDe-tector tool of AsmVar with the default parameters. Smartie-sv: The pipeline was run using the default set-tings. However, the number of jobs to be run in parallel and job wait time was adjusted to make it suitable for the computer resources available. Sniffles: Sniffles was run separately for PacBio and Nanopore simulated reads using the default parameters. Alignments were generated through minimap2 and converted to BAM and sorted using samtools. Picky: Picky was run using the same
methodology and parameters as described by the authors for both PacBio and Nanopore reads. LUMPY: Reads were aligned by minimap2, and the alignments were pre-processed using samblaster [53] and samtools as per the instructions provided by the authors. While running LUMPY, paired-end read distribution parameters were changed to match the simulated reads (mean 550, read_ length 150, min_non_overlap 150).
Breakpoints predicted by tools were considered to match the simulated rearrangement if they were within ± 150 bps range. For simulated translocations and transposi-tions, reads-based method did not predict any transloca-tion; however, they predicted breakends which matched the predicted translocations, therefore, we considered these breakends as representative for translocations. For duplications (distal and tandem), all annotation types re-sembling duplications were considered. For indels, we compared the location and size of the predicted indels with the simulated indels, allowing for error in both loca-tion and size. Two different error limits were checked: 5 and 100 bp.
Performance evaluation with real genome data
For both the A. thaliana (Ler) and the human (NA19240) genome, we used the same methods as above to simulate sequencing reads from whole-genome as-semblies, to perform alignments with the reference ge-nomes, and to identify genomic differences. For human genomes, we used the error profiles provided by SUR-VIVOR [49]. Count and sizes of the variations were ex-tracted from the output files using in-house scripts. For the AsmVar comparison of Col-0 vs Ler, we used the .svd output file instead of the .vcf output file as the former had better annotations. An indel was considered as identified if there was a simulated indel of the same type (insertion or deletion) within 100 bp of the location of the predicted indel and the size difference between two indels was not more than 100 bps.
Comparison with the gold standard variation dataset
Pseudo-chromosome generation and output comparison
We generated 200 fragmented assemblies of the Ler gen-ome by introducing 10–400 random breakpoints. Pseudo-genomes were generated for each of the fragmented assem-blies using RaGOO with default parameters. Additionally, we generated 100 fragmented assemblies each of Col-0 and Ler again by introducing 10–400 random breakpoints. These fragmented assemblies were assembled by a heuristic script (Additional file 1: Note 5) to generate pseudo-molecules. For 16 assemblies, pseudo-molecule generation failed and these samples were skipped from further analysis. A genomic rearrangement identified from the pseudo-genomes was considered to be correct if the same re-arrangement type was present within 100 bp up or downstream.
Data extraction and transformation of the 50 recombinant genomes
For validation, we used whole-genome sequencing data of 50 F2 recombinant plants that we generated recently [33]. We extracted allele count information from con-sensus call files generated by SHORE [54]. For each pre-dicted translocation, we estimated its copy number as the ratio between average read coverage for the translo-cated region and the average read coverage across the entire genome of the respective sample. Translocations in the centromeric regions and for which more than 25% of the translocated sequence had at least 10% reads with Ns were filtered out. For allele count analysis, we se-lected high-confidence (25 bp conserved in both direc-tions) SNPs in translocated regions as markers.
Validation of translocations: absence of reads (test 1)
We selected F2 samples which, according to predicted genotypes, should have lost the translocated DNA and thus should not give rise to any reads from the translo-cated region. Only translocations for which at least two samples that had lost the translocated regions existed were tested. And only those translocations for which all tested samples had no reads were considered as validated.
Validation of translocations: expected vs. observed copy number (test 2)
For each translocation, we selected samples which had different genotypes at the two associated loci for the translocation. This removes some of the samples with two copies and helps to remove a bias towards genomes with a copy number of two, which can affect this test. We further selected translocations for which we found samples with at least three different copy-number values predicted. A linear model was fit using the lmfunction inR.pvalues for the model-fit were adjusted for multiple testing using the BHmethod [55], and translocations for
which adjusted p values were less than 10−6 and slope more than 0.75 were considered as valid.
Validation of translocations: genotype clustering (test 3)
Allele count values at the SNP markers were normalized and outliers (markers having very high allele counts) were removed. Translocations were tested only when they had at least two different classes of samples (geno-types) with each class having at least three samples and at least three SNP markers in the translocated regions. Translocations for which alternate allele counts did not change across the samples (variance < 1) were also fil-tered out.
Cluster fit calculation
First, the distance between two samples was defined as the Euclidean distance between their reference allele counts and alternate allele counts. Then, the closeness_ score was calculated as the sum of ratios of the average distance between the samples belonging to a genotype to the average distance to samples of other genotypes.
Simulating distributions
Background distributions for the closeness_score were simulated by generating random clusters. For each sam-ple, allele counts (reference and alternate) were sampled using a Poisson distribution. For true translocations, the
closeness_score would be low as samples from the same genotype would be much closer to each other, whereas samples from different genotypes would be far. For each translocation, we calculated the lower-tail pvalue of re-trieving the correspondingcloseness_score.pvalues were adjusted for multiple testing using BH method, and translocations withpvalue < 0.05 were considered valid.
Supplementary information
Supplementary informationaccompanies this paper athttps://doi.org/10. 1186/s13059-019-1911-0.
Additional file 1.Additional notes and figures - Additional notes describing the method and additional results
Additional file 2.Additional tables - Information about methodology and data used, and additional results
Additional file 3.Review history
Acknowledgements
The authors would like to thank Ulrike Hümann for the help with plant work and Detlef Weigel and Gunnar Klau for helpful comments on the manuscript. Further, the authors acknowledge the researchers at the Genome Institute at Washington University School of Medicine who shared the assemblies for the NA12878 and NA19240 genomes prior to publication. Finally, the authors would like to thank the Anonymous Reviewer 2 for relevant suggestions to the simulation study.
Review history
Peer review information
Andrew Cosgrove was the primary editor of this article and managed its editorial process and peer review in collaboration with the rest of the editorial team.
Authors’contributions
The project was conceived by KS and WBJ. MG and KS developed the algorithms. MG implemented SyRI and performed all analyses. HS processed recombinant genome sequencing data and identified crossing-over sites. WBJ generated the Lerassembly. The manuscript was written by MG and KS with inputs from HS and WBJ. All authors read and approved the final manuscript.
Funding
This work was supported by the German Federal Ministry of Education and Research in the frame of RECONSTRUCT (FKZ 031B0200A-E).
Availability of data and materials
The assembly of the Lergenome has been submitted to the European Nucleotide Archive (http://www.ebi.ac.uk) and is publicly available under the accession number GCA_900660825 [56]. The reads are available as part of a separate study under the project ID PRJEB31147 (preprint [46]). All other assemblies are publicly available at NCBI (https://www.ncbi.nlm.nih.gov/), and their accession numbers are GCA_000001735.3 [57], GCA_000001405.27 [25], GCA_002077035.3 [22], GCA_001524155.4 [22], GCA_000146045.2 [27], GCA_000977955.2 [26], GCA_000001215.4 [29], GCA_002300595.1 [28], GCA_000005005.6 [31], and GCA_002237485.1 [30]. Further details about the assemblies are in Additional file2: Table S1. BAM files for the 50 F2
recombinant genomes are available at European Nucleotide Archive under the project ID PRJEB29265 [33]. SyRI is freely available under the MIT license and is available online [58]. The version of SyRI used in this work is available atdoi.org/10.5281/zenodo.3555197[59]. SyRI is developed using Python3.5 on Linux and can run on other operating systems as well.
Ethics approval and consent to participate
Not applicable
Competing interests
The authors declare that they have no competing interests.
Received: 11 April 2019 Accepted: 2 December 2019
References
1. Weischenfeldt J, Symmons O, Spitz F, Korbel JO. Phenotypic impact of genomic structural variation: insights from and for human disease. Nat Rev Genet. 2013;14(2):125–38.
2. Tuttle EM, Bergland AO, Korody ML, Brewer MS, Newhouse DJ, Minx P, et al. Divergence and functional degradation of a sex chromosome-like supergene. Curr Biol. 2016;26(3):344–50.
3. Küpper C, Stocks M, Risse JE, dos Remedios N, Farrell LL, McRae SB, et al. A supergene determines highly divergent male reproductive morphs in the ruff. Nat Genet. 2016;48(1):79–83.
4. Lamichhaney S, Fan G, Widemo F, Gunnarsson U, Thalmann DS, Hoeppner MP, et al. Structural genomic changes underlie alternative reproductive strategies in the ruff (Philomachus pugnax). Nat Genet. 2016;48(1):84–8. 5. Lowry DB, Willis JH. A widespread chromosomal inversion polymorphism
contributes to a major life-history transition, local adaptation, and reproductive isolation. PLoS Biol. 2010;8(9):e1000500.
6. Guan P, Sung W-K. Structural variation detection using next-generation sequencing data. Methods. 2016;102:36–49.
7. Simpson JT, Pop M. The theory and practice of genome sequence assembly. Annu Rev Genomics Hum Genet. 2015;16(1):153–72. 8. Jiao W-B. The impact of third generation genomic technologies on plant
genome assembly. Curr Opin Plant Biol. 2017;36:64–70.
9. Sedlazeck FJ, Lee H, Darby CA, Schatz MC. Piercing the dark matter: bioinformatics of long-range sequencing and mapping. Nat Rev Genet. 2018;19(6):329–46.
10. Liu S, Huang S, Rao J, Ye W, Krogh A, Wang J. Discovery, genotyping and characterization of structural variation and novel sequence at single
nucleotide resolution from de novo genome assemblies on a population scale. Gigascience. 2015;4(1):64.
11. Nattestad M, Schatz MC. Assemblytics: a web analytics tool for the detection of variants from an assembly. Bioinformatics. 2016;32(19):3021–3. 12. Kronenberg ZN, Fiddes IT, Gordon D, Murali S, Cantsilieris S, Meyerson OS,
et al. High-resolution comparative analysis of great ape genomes. Science. 2018;360(6393):eaar6343.
13. Sedlazeck FJ, Rescheneder P, Smolka M, Fang H, Nattestad M, von Haeseler A, et al. Accurate detection of complex structural variations using single-molecule sequencing. Nat Methods. 2018;15(6):461–8.
14. Gong L, Wong C-H, Cheng W-C, Tjong H, Menghi F, Ngan CY, et al. Picky comprehensively detects high-resolution structural variants in nanopore long reads. Nat Methods. 2018;15(6):455–60.
15. Layer RM, Chiang C, Quinlan AR, Hall IM. LUMPY: a probabilistic framework for structural variant discovery. Genome Biol. 2014;15(6):R84.
16. Marçais G, Delcher AL, Phillippy AM, Coston R, Salzberg SL, Zimin A. MUMmer4: a fast and versatile genome alignment system. PLoS Comput Biol. 2018;14(1):e1005944.
17. Kurtz S, Phillippy A, Delcher AL, Smoot M, Shumway M, Antonescu C, et al. Versatile and open software for comparing large genomes. Genome Biol. 2004;5(2):R12.
18. Li H. Minimap2: pairwise alignment for nucleotide sequences. Bioinformatics. 2018;34(18):3094–100.
19. Delcher AL, Phillippy A, Carlton J, Salzberg SL. Fast algorithms for large-scale genome alignment and comparison. Nucleic Acids Res. 2002;30(11):2478–83. 20. Delcher AL, Kasif S, Fleischmann RD, Peterson J, White O, Salzberg SL.
Alignment of whole genomes. Nucleic Acids Res. 1999;27(11):2369–76. 21. Chaisson MJP, Sanders AD, Zhao X, Malhotra A, Porubsky D, Rausch T, et al.
Multi-platform discovery of haplotype-resolved structural variation in human genomes. Nat Commun. 2019;10(1):1784.
22. Audano PA, Sulovari A, Graves-Lindsay TA, Cantsilieris S, Sorensen M, Welch AE, et al. Characterizing the major structural variant alleles of the human genome. Cell. 2019;176(3):663–675.e19.
23. Jiao W-B, Accinelli GG, Hartwig B, Kiefer C, Baker D, Severing E, et al. Improving and correcting the contiguity of long-read genome assemblies of three plant species using optical mapping and chromosome conformation capture data. Genome Res. 2017;27(5):778–86.
24. Alonge M, Soyk S, Ramakrishnan S, Wang X, Goodwin S, Sedlazeck FJ, et al. RaGOO: fast and accurate reference-guided scaffolding of draft genomes. Genome Biol. 2019;20(1):224.
25. International Human Genome Sequencing Consortium. Finishing the euchromatic sequence of the human genome. Nature. 2004; 431(7011):931–45.
26. Strope PK, Skelly DA, Kozmin SG, Mahadevan G, Stone EA, Magwene PM, et al. The 100-genomes strains, an S. cerevisiae resource that illuminates its natural phenotypic and genotypic variation and emergence as an opportunistic pathogen. Genome Res. 2015;25(5):762–74.
27. Goffeau A, Barrell BG, Bussey H, Davis RW, Dujon B, Feldmann H, et al. Life with 6000 genes. Science. 1996;274(5287):546–67.
28. Chakraborty M, VanKuren NW, Zhao R, Zhang X, Kalsow S, Emerson JJ. Hidden genetic variation shapes the structure of functional elements in Drosophila. Nat Genet. 2018;50(1):20–5.
29. Hoskins RA, Carlson JW, Wan KH, Park S, Mendez I, Galle SE, et al. The Release 6 reference sequence of theDrosophila melanogastergenome. Genome Res. 2015;25(3):445–58.
30. Hirsch CN, Hirsch CD, Brohammer AB, Bowman MJ, Soifer I, Barad O, et al. Draft assembly of elite inbred line PH207 provides insights into genomic and transcriptome diversity in maize. Plant Cell. 2016;28(11):2700–14. 31. Jiao Y, Peluso P, Shi J, Liang T, Stitzer MC, Wang B, et al. Improved maize
reference genome with single-molecule technologies. Nature. 2017; 546(7659):524.
32. Schnable PS, Ware D, Fulton RS, Stein JC, Wei F, Pasternak S, et al. The B73 maize genome: complexity, diversity, and dynamics. Science. 2009; 326(5956):1112–5.
33. Sun H, Rowan BA, Flood PJ, Brandt R, Fuss J, Hancock AM, et al. Linked-read sequencing of gametes allows efficient genome-wide analysis of meiotic recombination. Nat Commun. 2019;10(1):4310.
35. Rowan BA, Patel V, Weigel D, Schneeberger K. Rapid and inexpensive whole-genome genotyping-by-sequencing for crossover localization and fine-scale genetic mapping. G3 Genes Genomes Genet. 2015;5(3):385–98. 36. Imprialou M, Kahles A, Steffen JG, Osborne EJ, Gan X, Lempe J, et al.
Genomic rearrangements in Arabidopsis considered as quantitative traits. Genetics. 2017;205(4):1425–41.
37. Wijnker E, Velikkakam James G, Ding J, Becker F, Klasen JR, Rawat V, et al. The genomic landscape of meiotic crossovers and gene conversions in Arabidopsis thaliana. Elife. 2013;2:e01426.
38. Qi J, Chen Y, Copenhaver GP, Ma H. Detection of genomic variations and DNA polymorphisms and impact on analysis of meiotic recombination and genetic mapping. Proc Natl Acad Sci U S A. 2014;111(27):10007–12. 39. Paten B, Novak AM, Eizenga JM, Garrison E. Genome graphs and the
evolution of genome inference. Genome Res. 2017;27(5):665–76. 40. The Computational Pan-genomics Consortium. Computational
pan-genomics: status, promises and challenges. Brief Bioinform. 2018; 19(1):118–35.
41. Chin C-S, Peluso P, Sedlazeck FJ, Nattestad M, Concepcion GT, Clum A, et al. Phased diploid genome assembly with single-molecule real-time sequencing. Nat Methods. 2016;13(12):1050–4.
42. Koren S, Walenz BP, Berlin K, Miller JR, Bergman NH, Phillippy AM. Canu: scalable and accurate long-read assembly via adaptive k-mer weighting and repeat separation. Genome Res. 2017;27(5):722–36.
43. Xiao C-L, Chen Y, Xie S-Q, Chen K-N, Wang Y, Han Y, et al. MECAT: fast mapping, error correction, and de novo assembly for single-molecule sequencing reads. Nat Methods. 2017;14(11):1072–4.
44. Li H, Handsaker B, Wysoker A, Fennell T, Ruan J, Homer N, et al. The sequence alignment/map format and SAMtools. Bioinformatics. 2009;25(16):2078–9.
45. Li H, Durbin R. Fast and accurate short read alignment with Burrows-Wheeler transform. Bioinformatics. 2009;25(14):1754–60.
46. Jiao W-B, Schneeberger K. Chromosome-level assemblies of multiple Arabidopsis genomes reveal hotspots of rearrangements with altered evolutionary dynamics. bioRxiv. 2019.
47. Smit AFA, Hubley R, Green P. RepeatMasker Open-4.0.http://www. repeatmasker.org. Accessed 07 May 2019.
48. Bartenhagen C, Dugas M. RSVSim: an R/Bioconductor package for the simulation of structural variations. Bioinformatics. 2013;29(13):1679–81. 49. Jeffares DC, Jolly C, Hoti M, Speed D, Shaw L, Rallis C, et al. Transient
structural variations have strong effects on quantitative traits and reproductive isolation in fission yeast. Nat Commun. 2017;8(1):14061. 50. Michael TP, Jupe F, Bemm F, Motley ST, Sandoval JP, Lanz C, et al. High
contiguity Arabidopsis thaliana genome assembly with a single nanopore flow cell. Nat Commun. 2018;9(1):541.
51. Li H. Wgsim: reads simulator.https://github.com/lh3/wgsim. Accessed 05 Mar 2019. 52. Kiełbasa SM, Wan R, Sato K, Horton P, Frith MC. Adaptive seeds tame
genomic sequence comparison. Genome Res. 2011;21(3):487–93.
53. Faust GG, Hall IM. SAMBLASTER: fast duplicate marking and structural variant read extraction. Bioinformatics. 2014;30(17):2503–5.
54. Ossowski S, Schneeberger K, Clark RM, Lanz C, Warthmann N, Weigel D. Sequencing of natural strains of Arabidopsis thaliana with short reads. Genome Res. 2008;18(12):2024–33.
55. Benjamini Y, Hochberg Y. Controlling the false discovery rate: a practical and powerful approach to multiple testing. J R Stat Soc Ser B. 1995;57(1): 289–300.
56. Jiao W, Goel M, Sun H, Schneeberger K. Chromosome-level assembly of A. thaliana accession Ler using PacBio SMRT sequencing. Eur Nucleotide Arch.
https://www.ebi.ac.uk/ena/data/view/GCA_900660825. Accessed 27 Feb 2019. 57. The Arabidopsis Genome Initiative. Analysis of the genome sequence of the
flowering plant Arabidopsis thaliana. Nature. 2000;408(6814):796–815. 58. Goel M. Synteny and rearrangement identifier. GitHub.https://
schneebergerlab.github.io/syri/. Accessed 07 Aug 2019.
59. Goel M. Synteny and rearrangement identifier. Zenodo.https://zenodo.org/ record/3555197. Accessed 27 Nov 2019.
Publisher’s Note