item and our policy information available from the repository home page for further information.
Author(s):Snailum, Nic P.
Title: Thermal Footprint Detection
Year of publication:2006
Citation:Snailum, N.P. (2006) ‘Thermal Footprint Detection’ Proceedings of Advances in Computing and Technology, (AC&T) The School of Computing and Technology 1st Annual Conference, University of East London, pp.158-161.
Link to published version:
THERMAL FOOTPRINT DETECTION
Nic P. Snailum
Control Research GroupAbstract: A method is presented which extracts a low contrast thermal human footprint from its surroundings. It uses a novel operator to combine separate blobs in the image without introducing unnecessary clutter. The morphological operation of dilation has been demonstrated on a binary image using the new operator, though the method should be extensible to other operations and to grey scale images.
1. Introduction
In an attempt to make persons and property more secure the use of video cameras is increasing, but the success or otherwise of such devices depends heavily on the recognition of a threat if it occurs in the image. Human observers are prone to drowsiness and error, and a larger role is being played by artificial intelligence (AI) in threat recognition. Sensors too are improving, and the combination of new sensors and AI provides opportunities for higher levels of security.
Multiple pyroelectric detectors were used for tracking people (Hobbs, 2001), but these sensors generally have low (spatial and thermal) resolution. Thermal cameras using focal plane array sensors have higher resolutions but are expensive and are little used. The potentially large scale usage within the automotive industry may soon reduce their cost significantly, and adds impetus to research and usage in non-military applications.
Increased (thermal) resolution of thermal cameras is opening new applications such that the footprints of the would-be intruder may remain for a sufficient time after traversing a secure area to enable detection by a suitably programmed AI system. The use of this thermal data does not appear to
have been addressed in the literature, though footprints are a well known source of forensic evidence (de Chazal, 2005). The need then is for suitable methods to detect the thermal trail.
Image analysis using oriented filters to detect features at particular orientations is well established. Freeman used quadrature pairs to allow both phase and orientation to be adaptively controlled and thus detected features with those parameters (Freeman, 1991). The discretisation problem in orientation and scale of many of these types of filters was addressed by Perona who stored the response of families of linear filters on a continuum of orientations and scales (Perona, 1995).
Morphological image operators are useful in extracting image features such as shape, convex-hull and skeleton.
2. Human thermal footprint images
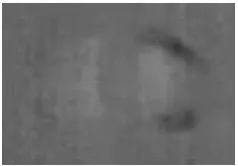
[image:3.595.353.475.105.190.2]Typical thermal footprints are presented in Figure 1. A shoe both reduces and spreads the flow of thermal energy such that the shoe print rarely reveals the foot shape. The outsole of a shoe is sometimes made of different materials, such that one provides a source and the other a sink for thermal energy. Much information is contained in the rate of change of intensity rather than in the intensity itself. An example is presented in Figure 1(c), and it is this image which is of particular interest here, in which the outer part of the shoe (leather) is a sink for energy while the inner area (rubber) is a source.
3. Low contrast image model
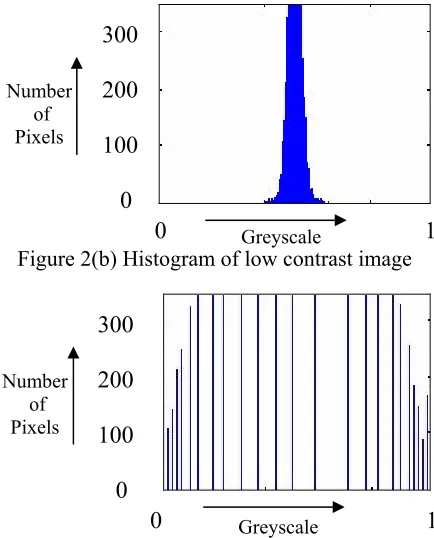
The particular type of image under investigation is typically of low contrast, due mainly to the transient nature of the transfer of thermal energy from shoe to floor during normal human gait. It has been found that the energy transfer is bi-directional, depending on the number and type of outsole materials. For this reason the image model used contains an area both of higher temperature and lower temperature than the background. With the background modelled as mid-grey, and higher temperatures towards white, an image model is obtained as presented in Figure 2(a). Gaussian noise of zero mean and standard deviation 0.0005 (assuming full-scale is 1.0) has been added to give a similar image to that obtained by a thermal camera. The histogram of this image is presented in Figure 2(b), in which the extremes of the distribution tails represent the information in the image. A well known and straightforward method of increasing the contrast of such images is histogram equalisation. After application to the image in Figure 2(a), the resultant image is presented in Figure 2(c), together with its
Figure 1(a) Footprint without shoe
Figure 1(b) Footprint with single material outsole
Figure 1(c) Footprint with dual material outsole
histogram in Figure 2(d). It is apparent that the information in the image is now at the extremes of the greyscale and as such is more easily extracted from the image (by thresholding) than in the original image.
4. Steerable morphological operator
The morphological operation of dilation is defined in (1).
Where: A is the image,
B is the structuring element, and is the empty set
≠ ∩ =
⊕B z B A
[image:3.595.362.468.228.309.2] [image:3.595.356.475.355.438.2]Figure 2(a) Low contrast image model
Figure 2(c) Histogram equalised image
The technique is frequently used to bridge gaps in noisy images (Gonzalez, 2002). This is successful for omnidirectional operators, or using a unidirectional structuring element if the direction is known. When the direction is unknown, there is a risk of failing to bridge the gap or to add clutter to the image. In those situations it would be useful to be able to steer the direction of the dilation according to local image constraints.
For the class of image considered in section 2, the footprint intensity between areas of highest and lowest temperature is almost indistinguishable from the background. When the image is thresholded, the footprint therefore apparently contains large holes, as seen in Figure 3(e). This is due to averaging of hot and cold on the outsole and results in an apparent lack of thermal information. However, there is a large change of thermal intensity, and a measure of intensity slope thus contains some of the information not present in the intensity image.
Figure 2(b) Histogram of low contrast image
Figure 2(d) Histogram of equalised image
It is seen that the edge direction contains information regarding the most probable direction of the nearest neighbouring portion of the footprint, indicated in Figure 3(c). The proposed method of dilation chooses a structuring element from the available unidirectional varieties dependent on the local edge direction, and thus bridges some of the gaps in the thresholded image.
5. Applying the operator
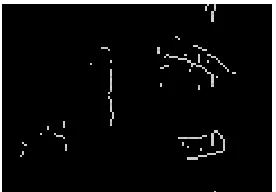
Starting with the image in Figure 1(c), the equalised image is presented in Figure 3(a). Edge information is detected using a Sobel operator, and its output presented in Figure 3(b). The direction of the edge at each edge pixel is presented diagrammatically in Figure 3(c) and encoded in Figure 3(d). The equalised image is thresholded in Figure 3(e), and the resultant image after dilation using the steerable structuring element is presented in Figure 3(f).
0 1
300
200
100
0
0 1
300
200
100
0 Number
of Pixels
Greyscale
Greyscale Number
[image:4.595.308.525.106.375.2] [image:4.595.128.234.107.216.2] [image:4.595.127.235.247.361.2]Figure 3(a) Histogram equalised image
Figure 3(c) Indication of edge direction
Figure 3(e) Thresholded image
6. Conclusions
A method of extracting footprints from low-contrast thermal images has been presented. A novel technique uses edge direction to steer a structuring element to enhance the image. This has been demonstrated by dilating a binary image, though the technique should be extendible to other morphological operations and to greyscale images.
7. References
de Chazal P., Flynn J., Reilly B., “Automated processing of Shoeprint Images Based on the Fourier Transform for Use in Forensic Science”, IEEE TPAMI, Vol 27, No. 3, March 2005, pp.341-350.
Figure 3(b) Output of Sobel edge operator
Figure 3(d) Edge direction encoded
Figure 3(f) Blobs combined using steerable operator
Freeman W., Adelson E., “The Design and Use of Steerable Filters”, IEEE TPAMI, Vol 13, No. 9, Sept. 1991, pp. 891-905.
Gonzalez R., Woods R., Digital Image Processing, Prentice Hall, New Jersey, 2002, pp. 519-529.
Hobbs P.C.D., “A $10 Thermal Infrared Imager”, Proc. SPIE Vol. 4563, Sensors and Controls for Intelligent Manufacturing II, 2001, pp. 42-51.
[image:5.595.347.485.106.202.2] [image:5.595.113.249.106.202.2] [image:5.595.112.250.228.321.2] [image:5.595.345.487.228.321.2] [image:5.595.110.249.347.444.2]