Munich Personal RePEc Archive
Evaluating Aid Impact
White, Howard
Institute of Development Studies, University of Sussex
November 2007
Copyright © UNU-WIDER 2007
* University of Sussex, Institute of Development Studies, Brighton, email: [email protected]
This study is a revised version of the paper presented at the 16-17 June 2006 WIDER development conference on ‘Aid: Principles, Policies, and Performance’, directed by George Mavrotas.
UNU-WIDER gratefully acknowledges the financial contribution to the conference by the Finnish Ministry for Foreign Affairs.
UNU-WIDER also acknowledges the financial contributions to the 2006-07 research programme by the governments of Denmark (Royal Ministry of Foreign Affairs), Norway (Royal Ministry of Foreign Affairs), Sweden (Swedish International Development Cooperation Agency—Sida), and the United
Research Paper No. 2007/75
Evaluating Aid Impact
Howard White*
November 2007
Abstract
The ultimate measure of aid effectiveness is how aid affects the lives of poor people in developing countries. The huge literature on aid’s macroeconomic impact has remarkably little to say on this topic, and less still in terms of practical advice to government officials and aid administrators on how to improve development effectiveness. But there is an expanding toolbox of approaches to impact evaluation at the field level which can answer both questions of whether aid works, and, properly applied, why it works (or not, as the case may be). This paper lays out these approaches, describing some of their uses by official development agencies. I advocate a theory-based approach to impact evaluation design, as this is most likely to yield policy insights. Academics need to engage in these real world issues and debates if their work is to help alleviate the plight of the world’s poor.
Keywords: aid effectiveness, impact evaluation, quasi-experimental design, results agenda
The World Institute for Development Economics Research (WIDER) was established by the United Nations University (UNU) as its first research and training centre and started work in Helsinki, Finland in 1985. The Institute undertakes applied research and policy analysis on structural changes affecting the developing and transitional economies, provides a forum for the advocacy of policies leading to robust, equitable and environmentally sustainable growth, and promotes capacity strengthening and training in the field of economic and social policy making. Work is carried out by staff researchers and visiting scholars in Helsinki and through networks of collaborating scholars and institutions around the world.
www.wider.unu.edu [email protected]
UNU World Institute for Development Economics Research (UNU-WIDER) Katajanokanlaituri 6 B, 00160 Helsinki, Finland
Typescript prepared by Liisa Roponen at UNU-WIDER
Acknowledgements
Thanks are due to Shampa Sinha and Ann Flanagan for assistance in reviewing the studies cited in this paper and comments on an earlier draft, and to Nina Blöndal for assistance in preparation of the paper. Sections of this paper are based on joint work undertaken for an IEG-DAC initiative to promote impact evaluation. The findings, interpretations, and conclusions expressed in this article do not necessarily reflect the views of the Executive Directors of the World Bank or the governments they represent.
Acronyms
AusAID Australian Agency for International Development BINP Bangladesh Integrated Nutrition Project
CGD Center for Global Development CGE computable general equilibrium
DFID Department for International Development DPEP district primary education programme FINNIDA Finnish International Development Agency IDB Inter-American Development Bank
IEG Independent Evaluation Group of the World Bank (formerly Operations Evaluation Department, OED)
IFAD International Fund for Agricultural Development M&E programme monitoring and evaluation PSM propensity score matching
T&V training and visit
1 Introduction
Aid pessimism, or ‘aid fatigue’, has been a persistent feature of debates about aid. As early as 1966 Ohlin wrote of United States’ aid that ‘the foreign assistance programme has never ceased to arouse unease and controversy’ (Ohlin 1970: 24). Just a few years later the Pearson Commission was convened to report on international development ‘in the context of increasing concern about the future of international cooperation for economic development’ (Pearson 1969: vii). The opening section of the Commission’s report is entitled ‘Crisis in Aid’, declaring that, ‘international support for development is now flagging’ (ibid.: 4). A decade later the Brandt Report (1980: 225-6) expressed similar sentiments: ‘in many countries the political climate is at present unfavourable to an increase in aid, with a range of serious domestic problems looming large … public opinion in industrial countries has often been critical of aid’.
Much analysis of aid impact has been at the macro level, and much of it has lent support to the aid pessimists by finding little or no link between aid and growth. However, these conclusions are founded upon cross-country regressions which have numerous weaknesses when applied to the aid-growth relationship (see e.g, White 1992, 2007). These shortcomings mean that such approaches cannot be used to decide whether aid works or not, and certainly not to inform more intricate aspects of aid policy and management. What is required is more detailed analysis of aid’s impact on the ground.
Such analysis is the day-to-day work of donor agency evaluation departments. However, the work of these departments is often held by critics to be insufficiently rigorous, particularly in its approach to answering the central question of aid’s impact on poverty. Indeed, it has long been argued that the poverty-reducing effects of aid are not well documented: Mosley (1987) calls the lack of attention to poverty impact ‘a disgrace’ and the title of the 2006 Evaluation Gap Working Group Report—‘When will we ever learn?’—points to the gap in our knowledge on account of a lack of impact studies (CGD 2006).
But this gap is being filled by a rapidly growing number of studies which do provide solid evidence of how aid is working. There are a number of reasons for this recent growth. On the supply side, there is increased capacity for conducting the surveys necessary for good impact analysis, and methodological advances that help tackle the challenges involved in determining attribution are becoming widely diffused. On the demand side, the results-agenda, including the focus on the Millennium Development Goals, has increased calls for evidence that aid actually affects outcomes such as infant mortality, gender disparity in schooling, and income poverty.
2 Impact evaluation: concepts and principles
2.1 What is impact evaluation?
Impact evaluation has taken on several different meanings. Prominent amongst these are:
i) an evaluation carried out some time after the intervention has finished,
ii) a study encompassing a whole country or sector,
iii) focusing on final welfare outcomes,
iv) employing counterfactual analysis,
v) studies with a specific focus, such as ‘environmental impact analysis’, and
vi) beneficiary assessment, named as beneficiary or participatory impact assessment.
All six are important evaluation activities. However, current interest in impact evaluation has been concerned with the fourth meaning; that is, establishing a valid counterfactual—that is, what would have happened had the intervention not taken place.
The techniques for analyzing the counterfactual are most often bought to bear on focus on final welfare outcomes. But this need not be so. This paper argues that good impact evaluation is built upon the ‘programme theory’—the logical framework underlying the intervention—and so considers both factual and counterfactual indicators across the log frame. But the difficulty of creating a valid counterfactual increases as one moves from inputs to outcomes.
It is sometimes argued that the focus on outcomes needs a long-term perspective since outcomes take time to be realized. This may be so for some interventions, but is not necessarily the case. For example, nutritional programmes for pregnant women to increase birth weight must have their impact on the first cohort of women in less than nine months, and the subsequent impact on infant mortality within the following year. On the other hand, most projects take some time (at least a couple of years) to become fully operational, so first estimates of impact are unlikely to be possible until at least 4-5 years after the project start date. This timing creates a problem for aid managers who must make a decision to extend or scale up a project at least one year before it finishes, at which time results from an end of project impact evaluation will not be available. The solution is to design an evaluation system, including baseline, mid-term and endline surveys, that allows preliminary impact estimates at mid-term (which should be timed somewhat over half way through project life to allow for slow start up).
2.2 Approaches to impact evaluation
Before versus after
counterfactual is usually given by a comparison group of non-beneficiaries, who should be the same in all respects as the treatment group except that they are not subject to the intervention.1
The use of comparison groups is discussed below but before moving on, it should be noted that sometimes before versus after is valid for impact analysis since attribution is very obvious, so that there is no need for a comparison group.2 An example of this is an
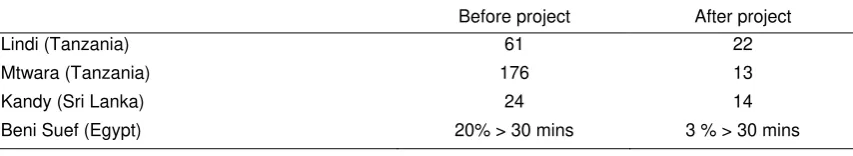
evaluation of a Finnish water supply project (FINNIDA 2001). A major benefit from these projects is time savings from the reduction in time required to fetch water, which mainly accrue to women and children. Data compiled from four projects illustrate how time spent fetching water fell once water pumps were installed (Table 1). There is no other feasible causal factor behind this reduction so the before versus after comparison tells us the actual impact. This point is not always appreciated. Another evaluation used a comparison group to show that rehabilitated schools were in better condition than those which had not been rehabilitated. This is a rather unsurprising finding, and a before versus after comparison would have been more useful.
The case of school rehabilitation is an illustration that the counterfactual is easier to establish at the output level and even more so at lower levels of the intervention logframe. For example, an Australian project in Thailand promoted an ambulatory care model for HIV/AIDS (AusAID 2005). The impact evaluation used a single survey to show that the model had been adopted (it was not in use before, which was the rationale for the project). Again, no comparison group was needed.
[image:6.595.99.526.499.577.2]But school rehabilitation and health care models are outputs; we still need to establish how they affect outcomes. To do so many evaluations rely on ‘plausible association’; the project produced output X which we know affects outcome Y. Of course when the project has failed to deliver the intended outputs, then it is easier to build a case for lack
Table 1
Average time needed to fetch water before and after improved water supply (minutes)
Before project After project
Lindi (Tanzania) 61 22
Mtwara (Tanzania) 176 13
Kandy (Sri Lanka) 24 14
Beni Suef (Egypt) 20% > 30 mins 3 % > 30 mins
Source: FINNIDA (2001)
1 The term ‘control group’ is often used. This paper, in accordance with recent practices, reserves the term control group for experimental settings.
of impact. An IEG study illustrates this point (World Bank 2000). World Bank support to extension services in Kenya promoted the training and visit (T&V) system, which promoted more intensive interaction between farmers and extension workers, with extension workers basing their advice on new research also funded by the project. But the study found there was no linkage between research findings and extension messages, so that extension workers were promoting ‘innovations’ which most farmers had already adopted, and furthermore, extension workers were not spending increased amount of time with farmers. As the project did not work in the way in which was intended, it is very plausible to argue that there was no impact on productivity.3
However, the usefulness of simple before and after comparisons and estimations of impact based mainly on plausible association is limited. A comparison group may well be needed to measure other outcomes. In the case of the water supply projects, there may also be health and nutrition benefits, or the time savings may allow children to study more, thus improving learning outcomes, or even allowing girls to attend school who would not otherwise have done so. An examination of these outcomes would require a more sophisticated approach to the counterfactual than before versus after. Plausible association must sometimes be relied upon, but at present the need is to build upon a stronger evidence base for such associations.
Using a comparison group for single and double difference project impact estimates
The difference in outcomes between the treatment group (the beneficiaries) and the comparison group is the most common approach to impact analysis. This is the single difference.4 Where baseline data are available, then the double difference (the
difference in the change in the outcome) may be used instead, and in some cases this approach overcomes the problem of selection bias (see below).
An alternative approach is to use a regression in which project participation is an explanatory dummy variable. This approach can be equivalent to (i.e., gives identical results to) single or double difference, depending on the specification of the regression. However, other variables may also be included giving a better result, allowing for the analysis of differential effects within subsamples of the treatment group, and removing selection bias under certain conditions.
Although comparison group impact estimates are very common, they are a ‘black box’ approach. A black box approach puts a figure on the effect of the intervention on the outcome. But most interventions have several components. For example, a school project may put up new classrooms, provide textbooks, train teachers, and support the formation of community management committees. Simply using a project dummy (or, equivalently, comparing outcomes in treatment and control communities) will not unpack which bits are working and which are not.
In the case of the regression approach, the project dummy may well produce a biased estimate. This is because project effects are very likely occurring through the
3 The study did indeed find no productivity effect and, although the means of establishing the comparison group might be questioned, the finding, based on a strong analysis of the underlying programme theory, cannot,
determinants of the outcome which have also been included on the right-hand side of the regression—how else will the intervention have an effect other than by affecting these determinants? But if these determinants are included in the regression, then the actual impact of the project is under-estimated by the coefficient on the project dummy. But if they are not included then the project dummy may be an over-estimate. Hence it is often better to not use a project dummy but to model the determinants and how the intervention has affected these determinants. This is the ‘modelling of determinants’ approach described below.
2.3 The problem of selection bias
It is usually the case that project beneficiaries have been selected in some way, including self-selection. This selection process means that beneficiaries are not a random sample of the population, so that the comparison group should also not be a random sample of the population as a whole, but rather drawn from a population with the same characteristics as those chosen for the intervention. If project selection is based on observable characteristics then this problem can be handled in a straightforward manner. But it is often argued that unobservables play a role, and if these unobservables are correlated with project outcomes then obtaining unbiased estimates of project impact becomes more problematic.
Two examples illustrate this point:
i) Small businesses that have benefited from a micro-credit scheme are shown to have experienced higher profits than comparable enterprises (similar locations and market access) which did not apply to the scheme. But beneficiaries from the scheme are selected through the screening of applications. Entrepreneurs who make the effort to go through the application process, and whose business plans are sound enough to warrant financing, may anyhow have done better than those who could not be bothered to apply in the first place or whose plans were deemed too weak to be financed.
ii) Many community-driven projects, such as social funds, rely on communities to take the lead in applying for support to undertake community projects, such as rehabilitating the school or building a health clinic. The benefits of such community-driven projects are claimed to include higher social capital. Beneficiary communities are self-selecting, and it would not be at all surprising if those which have higher levels of social capital to start with are more likely to apply. A comparison of social capital at the end of the intervention between treatment and comparison communities, and attributing the difference to the intervention, would clearly be mistaken and produce an over-estimate of project impact.
The evaluation design must decide how to handle selection bias, which is one of the main issues in selecting from the evaluation designs discussed in the next section.
2.4 The contamination problem
similarity of treatment and comparison groups, a common approach is to draw these groups from the same geographical area as the project. Indeed neighbouring communities, or at least sub-districts, are often used. But the closer the comparison group to the project area, the more likely it is to be indirectly affected in some way by the intervention. An agricultural intervention can increase labour demand beyond the confines of the immediate community. There is thus a trade-off between the desire to be geographically close to ensure similarity of characteristics and the need to be distant enough to avoid spillover effects. Of course, where spillover effects are clearly identifiable they should be included as a project benefit or cost.
Distance will not, however, reduce the possibility of external contamination by other interventions. The desired counterfactual is usually a comparison between the intervention and no intervention. But the selected comparison group may be subject to similar interventions implemented by different agencies, or even somewhat dissimilar interventions but which affect the same outcomes. Such a comparison group thus gives a counterfactual of a different type of intervention. Different comparison groups may be subject to different interventions. If data are being collected only ex post, the presence of similar interventions can be used to rule out an area as being a suitable comparator, though this selection process may leave rather few eligible communities. Such data are readily available in the community, but rarely elsewhere, so visiting the field (meaning the actual village rather than district offices) can greatly contribute toward selecting an appropriate comparison group. But in the more desirable situation of collecting baseline data prior to the intervention, there is little the evaluation team can do to prevent other agencies introducing projects into the evaluation comparison area between the time of the baseline and endline surveys.
The first step to tackle the problem of external contamination is to ensure that the survey design collects data on interventions in the comparison group, a detail which is frequently overlooked, thus providing an unknown bias in impact estimates. The second step is to utilize a theory-based approach, rather than a simple with versus without comparison, the former being better able to incorporate different types and levels of intervention.
Underlying this discussion is a separate point as to what is intended to be the counterfactual. Is the comparison meant to be between the intervention versus no intervention, or the intervention implemented with agency support versus either no support or support by another agency? The decision must be decided on a case by case basis. But inadequate attention to this point often means the latter becomes the default on account of contamination, though it may in fact be of little interest.
3 Impact evaluation design
3.1 Experimental approaches
growing range of development interventions. Examples include a study of corruption in a community driven rural development project (Olken 2005), conditional cash transfers such as Mexico’s PROGRESA (e.g., Coady 2003), a job training programme in the Dominican Republic (IDB 2006a), contracting out of health service provision in Cambodia (Schwartz and Bhushan 2006), and innovations in educational delivery in India (Banerjee et al. 2006) and Kenya (Glewwe, Kremer and Moulin 2001; Glewwe et al. 2004).
There are misconceptions about the randomized approach, so that it is held to be wholly inappropriate in a development setting. This is not so, and, as just mentioned, has been successfully applied in several cases. Indeed, several of the claimed problems of a randomized approach are common to all impact evaluations. First, randomization is no more expensive than any other survey-based impact evaluation. Second, experimental design requires that beneficiaries are chosen at random from the eligible population, e.g., slum residents; there is no requirement at all that the population as a whole be considered for treatment. In the case of the school improvement project mentioned in the previous project, a measure of targeting can still be achieved by selecting poor districts as the project districts. Third, allocating benefits to only a subset of potential beneficiaries is a result of the project budget constraint, not the decision to randomize. Hence there is nothing morally reprehensible about the decision to keep an untreated group—the same is true with any comparison group. Equally, the desire to keep an uncontaminated comparison is just as true as for any impact study with a baseline.
However, there are limits to the applicability of randomization in development evaluation. The first is that the evaluation design may perforce be ex post, so that the opportunity to randomize has long since passed. Second, the term ‘treatment group’ reflects the medical antecedents of the randomized approach. The medical analogy is apt since discrete, homogenous interventions—like taking a pill—are most amenable to a randomized approach; conditional cash transfers are an obvious example, and an area of a growing body of evidence for randomized impact evaluations. Where the nature of the intervention varies, then either multiple comparisons are required or an alternative needed which recognizes this heterogeneity. Many development interventions are complex in design, so that a randomized evaluation design may, at best, be appropriate for a subset of the intervention. It is also not possible to randomly place large-scale infrastructure, such as a port or major bridge. Third, the experiment implies that the evaluator maintains control. This may not be possible. Those selected for the intervention may not want to take part, so selectivity bias comes back in. Or those not selected may lobby for inclusion, or for a comparable intervention, and so become contaminated. Or randomization may prove to be just a political non-starter. Other programmes intend to be comprehensive in scope, such as attaining universal primary education. And projects working with a small number of entities, such as institutional development activities, cannot use a randomized approach.
3.1 Natural experiments
Natural experiments occur when participants are allocated in a way which is not at all correlated with expected outcomes. In that case a sample of non-beneficiaries will be a valid control group. One example of a natural experiment is class size in Israel (Angrist and Lavy 1999). There is a debate on the impact of class size on student learning. But class size may be endogenous with respect to other factors influencing outcomes, such as school management. However, in Israel class size is exogenous since by law no class can exceed 40. Hence once there is a 41st pupil the class is split into two class of 20 and 21 each. Another example comes from land titling in Argentina (Galiani and Schargrodsky 2006). Squatters outside Buenos Aires were awarded title to the land on which they were squatting with compensation paid to the original owners. Some owners disputed the settlement in court, so these squatters did not obtain the land title. Which squatters got title or not had nothing to do with the characteristics of the squatters. Hence non-title holders and title holders can be compared to examine the impact of having title on access to credit (there was none) and investing in the home (there was some). Unfortunately opportunities for natural experiments are quite rare in practice and so cannot be relied on for as a basis of most impact evaluations.
3.2 Pipeline approach
In the pipeline approach, communities, households or firms selected for project participation, but not yet treated, are chosen for the comparison. Since they have also been selected for treatment, there should in principle be no selectivity bias, though there may be. For example, if the project is treating the ‘most eligible’ first, these units will indeed be systematically different from those treated later. If this is the case, then the approach ensures a bias rather than avoids it. For example, phase one may start with the poorest families or alternatively with the more centrally located or better-off areas, and in both of these cases the characteristics of communities in later phases are likely to be different.5 This approach also assumes that there has been no change in selection
criteria. This is why project design and selection criteria must be carefully reviewed when applying this approach because there will often be systematic differences between the phases. Clearly, the approach can be used only for activities which continue beyond the end of the project being evaluated. The data on the pipeline group can also serve as a baseline in future studies and therefore help to establish an efficient impact evaluation system.
Two examples of the pipeline approach come from the evaluation of microfinance programmes in Nigeria, Malawi, Haiti and Kenya conducted by UNCDF (2003) and in Pakistan by the Department for International Development (DFID) (Arjumand and Associates 2004). The UNCDF evaluation used new clients as the comparison group and mature and ex-clients as the treatment group. In the Pakistan case, there was no proper pipeline since loan disbursements were made almost immediately after approval. Consequently the comparison group was composed of people who had been with the
programme for less than six months.6 Both studies confirm the poverty-reducing effects
of microfinance, though such schemes rarely benefit the poorest. A final example of a planned pipeline approach is Inter-American Development Bank’s evaluation of vocational training in Panama (IDB 2006b), in which future selected participants were used as the control group. However, because of financial constraints this second group never received the training, so that the design eventually used might be called a natural experiment. The training was shown to improve the employment prospects of trainees.
3.3 Quasi-experimental approaches
Propensity score matching
Selection may be based on a set of characteristics rather than just one. Hence the comparison group needs to be matched on all these characteristics. This may seem a rather difficult task. But it can be managed through a technique called propensity score matching (PSM), which matches using a single variable (‘the propensity score’) calculated as a vector of the determinants. Once the control is identified, project impact can be estimated using single or double difference estimates.
Propensity score matching can be attractive for two reasons. First, comparison group data may have been collected but are thought not to be representative because of selection bias. Second, there may be data only on the treatment group but not the control. A different, possibly nationwide, dataset can then be used to construct a comparison group using PSM.
The steps involved in carrying out propensity score matching are as follows:
i) Obtain a control dataset;
ii) Run a participation model (probit/logit regression);
iii) Calculate participation probabilities;
iv) Drop observations outside the region of common support (i.e., observations in the treatment group whose probability of participation exceeds that of any from the potential comparison group, or those from the latter group with participation probabilities below those of any members of the treatment group);
v) Match observations based on participation probabilities;
vi) Calculate project effect for each pair (or set) of matched observations; and
vii) Calculate the average of these differences (project effect).
IDB used PSM in four studies of support to science and technology, specifically grants to academics. The problem of selection bias is very clear in this case since the awards were given on a competitive basis, so that the performance (measured by publications) of those selected should have been better than those who were not selected even in the
absence of the programme. Hence a propensity score was calculated based on variables likely to affect success such as the quality of the applicant’s own educational institution and their prior publication record. A positive impact was found. IDB also used PSM to obtain a comparison group in a study of vocational training in Chile, since the screening process would have resulted in selection bias.
The district primary education programme (DPEP) in India was a large programme supported by various donors to improve enrolments, especially for girls, and learning outcomes. The programme monitoring and evaluation (M&E) system only collected data in project districts so there was no basis for impact evaluation which requires a comparison group. To get around this problem, Jalan and Glinskaya (2005) use PSM to match districts (always matching a district with one in the same state), modelling programme participation on female literacy (overall and among scheduled castes and tribes), proportion of scheduled castes and tribes, population density, housing quality and village infrastructure. The results show an improvement in enrolments and progression beyond primary school, especially for minority groups. However, the study is a black box approach. DPEP provides school building and rehabilitation, teacher training, support to village education committees and curriculum development, but the evaluation does not address which of these components was effective and which were not.
IEG’s study of the Bangladesh Integrated Nutrition Project (BINP) used PSM, but, using a theory-based evaluation framework, combined PSM with the analysis of other levels of the logframe (World Bank 2005). The project commissioned evaluation surveys from six project sub-districts and two control areas. The sample size for the controls was rather small, and since they were contiguous with the project districts, there was a likelihood that spillover effects (a major focus of the project was nutritional counselling— word can spread) would reduce measured impact in the project versus control comparison. The study thus used a national nutrition survey to create a control group using PSM. A comparison of the findings shows that this approach yields more internally consistent results—finding the impact to be very low for the money spent. The theory-based approach casts light on a number of weak links in the causal chain which explain this poor result, including mis-targeting, poor implementation of growth monitoring by nutritional counsellors, and a gap between mothers’ knowledge and what they practice.
Regression discontinuity
Regression discontinuity uses the propensity score in another way. The outcome variable is regressed upon the score including a programme dummy (possibly both intercept and slope). The fitted values are calculated using the mean score for the treated group, setting the project dummy variable equal to zero, and then again with the dummy equals one. The difference between these two fitted values is the programme impact. This method was used in IDB’s study of support for scientific research in Chile (this study also used propensity score matching and was listed above). As argued above, reliance on dummy variables is a black box approach, although the box can be opened if the study is set in the context of a theory-based approach.
3.4 Modelling the theory
model the determinants of the outcomes using regression models. The determinants of these determinants are also modelled, working down the results chain until the link is made to programme inputs.
For example, in Ghana the World Bank provided 8,000 classroom blocks and 35 million textbooks over a 15-year period (World Bank 2003). The study showed how improved access to schools, and improved quality of schooling, increased enrolments. About one-third of the 12 per cent increase from 1989-2001 could be attributed to Bank-financed school improvements across the country. The provision of textbooks contributed to the marked improvement of learning outcomes. The study showed how better learning outcomes increase agricultural income and mother’s education improves child nutrition.
The problems in the BINP have already been mentioned. But, in general, health and family planning programmes in Bangladesh have been remarkably successful. IEG’s study of support to maternal and child health (World Bank 2005) showed that the family planning programme in particular has been a case of a successful aid-financed government planning exercise. Donors paid for the construction of health and family planning facilities across the country, training of staff and, initially, the salaries of these staff, allowing the country to move rapidly from scant to almost universal access. In consequence, the total fertility rate has fallen from over seven to less than three. The success of the immunization programme in saving lives is elaborated on later.
The World Bank has financed the construction of irrigation facilities around the world, and these have a proven impact on poverty reduction. However, closer investigation shows that these schemes are effectively a transfer, and not that well targeted a transfer (World Bank 2007). Overall, the rate of return of these investments is low or even negative, and will remain that way unless means can be found to address inefficiencies in construction, including tackling endemic corruption.
3.5 When there’s no baseline
More often than not evaluators are called upon to evaluate a programme ex post, and there turns out to be no baseline. Or, if there is a baseline, it was too small (small sample, especially of comparison group, if there is one at all) or too late (toward end of the project, which is a common problem; start-up takes a lot of energy and evaluation systems are given low priority). The following alternatives may be followed if there is no baseline:
i) If treatment and comparison groups are drawn from the same population and some means is found to address selection bias (which will have to be quasi-experimental, since randomization is ruled out unless the treatment had been randomized, but if the programme designers had thought of that, they will have thought of a baseline also), then a single difference estimate is in principle valid.
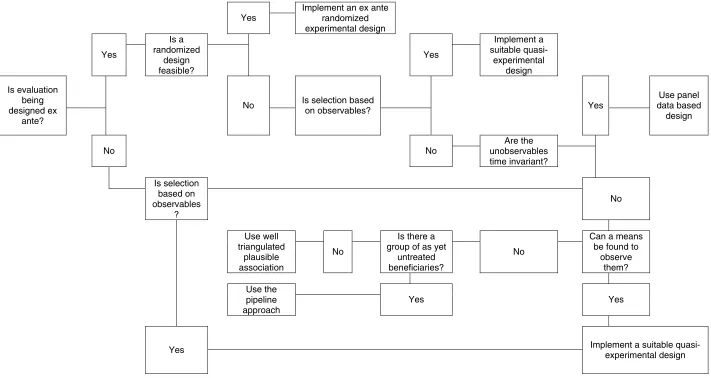
Figure 1
Decision tree for selecting evaluation design to deal with selection bias
Yes
Implement an ex ante randomized experimental design
Yes
Is a randomized
design feasible?
Yes
Implement a suitable
quasi-experimental design
Is evaluation being designed ex
ante?
No Is selection based on observables? Yes
Use panel data based
design
No No
Are the unobservables time invariant?
Is selection based on observables
?
No
Use well triangulated
plausible association
No
Is there a group of as yet
untreated beneficiaries?
No
Can a means be found to
observe them?
Use the pipeline approach
Yes Yes
Yes Implement a suitable
quasi-experimental design
non-beneficiaries which might be used for evaluation purposes, though it would be very rare to be able to follow-up with a second survey and so obtain the panel required for double differencing. Earlier surveys were used in Danida’s analysis of the Noakhali Rural Development Project (Danida 2001) to construct the argument that, although the project was important for beneficiaries, it was not of sufficient scale to improve socioeconomic development more generally; and in IEG’s analysis of extension services in Kenya discussed above (World Bank 2000).
iii) Field survey, using recall on the variables of interest, as was done in IFAD’s (International Fund for Agricultural Development) studies of three West African rural development programmes (IFAD 2005, 2006a, 2006b). Many commentators are critical of relying on recall. But all survey questions are recall, so it is a question of degree. The evaluator needs to use his or her judgment as to what it is reasonable to expect a respondent to remember. It is reasonable to expect people to recall major life changes, introduction of new farming methods or crops, acquisition of large assets and so on. But not the exact amounts and prices of transactions. When people do recall, there may be telescoping (thinking things were more recent than they were), so it is useful to refer to some widely known event as a time benchmark for recall questions.
iv) If all the above fail, then the study should build a strong analysis of the causal chain (programme theory). Often a relatively descriptive analysis can identify breaks in the chain and so very plausibly argue that there was low impact. In the case of IEG’s study of agricultural extension in Kenya, it was shown that outputs had not been delivered so little impact could be expected. The evidence of low impact is very plausible even if the comparison group might be faulted on grounds of technical rigor.
v) The argument can be further strengthened by triangulation (indeed, this point applies whatever method is adopted): drawing on a variety of data sources and approaches to confirm that a similar result obtained from each. Such an approach is adopted in many of the studies reviewed, most notably the Danish studies of support to rural development in Bangladesh and Mozambique (Danida 2001, 2002), which use a variety of tools including data analysis, qualitative interviews and focus groups with a range of stakeholders, institutional mapping, direct observation, and desk study of secondary sources. IEG’s study of immunization in Bangladesh (World Bank 2005) used three different datasets and methods to quantify the number of children saved by immunization, two of which gave remarkably similar results, and the third a somewhat higher estimate, so the figure from the first two could be used to give a lower bound of over one million lives saved in the 15 years following the expansion of immunization coverage in the second half of the 1980s.
4.6 Summing up on evaluation design
A rigorous evaluation design must take account of possible selection bias. The following steps are a decision tree to assist deciding how to overcome this issue (laid out in flow chart form in Figure 1):
population is a valid comparison group, and will remain so provided contamination can be avoided. This approach does not mean that targeting is not possible. The random allocation may be to a subgroup of the total population, e.g., from the poorest districts.
ii) If not, are all selection determinants observed? If they are, then there are a number of regression-based approaches which can remove the selection bias.
iii) If the selection determinants are unobserved and if they are thought to be time invariant, using panel data will remove their influence, so a baseline is essential (or some means of substituting for a baseline).
iv) If the study is ex post so a panel is not possible and selection is determined by unobservables, some means of observing the supposed unobservables should be sought. If that is not the case, then a pipeline approach can be used if there are as yet untreated beneficiaries.
v) If none of the above is possible, then the problem of selection bias cannot be addressed. Any impact evaluation will have to rely heavily on the programme theory and triangulation to build an argument by plausible association.
An equally important part of the evaluation design is adopting a theory-based approach which will open the black box. Although a technique such as randomization may be relied upon to produce a solid impact estimate, data must also be collected at other levels of the logframe to allow analysis of how the programme is working.
4 Conclusion
Measuring aid impact at a macro level, especially through cross-country regression approaches, is a very blunt instrument which can give misleading results. Project and programme level studies give both more reliable results, and more policy relevant information for aid managers. Unfortunately most academics studying aid effectiveness have not got involved in research at this detailed level, though they are critical of the independence and rigour of the work of aid agency evaluation departments. But there are now methods of impact analysis requiring the degree of technical expertise which academics can bring, and providing the opportunity to collect rich datasets fruitful for further research. The widespread adoption of these methods shows that claims that aid impact is not properly evaluated by aid agencies are over-stated. The findings also provide ample evidence that aid can work to improve the lives of the poor, though it is not always the case. It would be beneficial for both academics and aid agencies if the former were to get their hands dirty in more detailed scrutiny of aid programmes.
References
Angrist, J. D., and V. Lavy (1999). ‘Using Maimonides’ Rule to Estimate the Effect of Class Size on Scholastic Achievement’. Quarterly Journal of Economics, 114 (2): 533-75.
Arjumand and Associates (2004). ‘Impact Assessment of Kashf’s Microfinance and Karvaan Enterprise Development Programme’. Report prepared for DIFD Pakistan. Islamabad: Arjumand and Associates.
Australian Agency for International Development (AusAID) (2005). ‘Impact Evaluation of the Thailand-Australia HIV/AIDS Ambulatory Care Project’. Evaluation and Review Series No. 37. Canberra: AusAID.
Banerjee, A., S. Cole, E. Duflo, and L. Linden (2006). ‘Remedying Education: Evidence from Two Randomized Experiments in India’. CEPR Discussion Paper 5446. London: Centre for Economic Policy and Research.
Brandt, W. (1980). North-South: A Program for Survival. London: Pan Books.
CGD (Center for Global Development) (2006). ‘When Will We Ever Learn? Improving Lives through Impact Evaluation’. Washington, DC: CGD, Evaluation Gap Working Group.
Coady, D. (2003). ‘Alleviating Structural Poverty in Developing Countries: The Approach of PROGRESA in Mexico’. Washington, DC: International Food Policy Research Institute.
Danida (2001). Evaluation: In the Wake of a Flagship. Ex-post Impact Study of the Noakhali Rural Development Project in Bangladesh. Copenhagen: Ministry of Foreign Affairs of Denmark.
Danida (2002). The Agricultural Development Project in Tete, Mozambique: An Impact Study. Copenhagen: Ministry of Foreign Affairs of Denmark.
FINNIDA (1996). Zambia Road Assistance Project: Phase II. Helsinki: Ministry for Foreign Affairs of Finland, Department for International Development Cooperation.
FINNIDA (2001). ‘Finland’s Support to Water Supply and Sanitation’, Helsinki: Helsinki: Ministry for Foreign Affairs of Finland, Department for International Development Cooperation.
Galiani, S., and E. Schargrodsky (2006). ‘Property Rights for the Poor: Effects of Land Titling’. Available at www.tinyurl.com/ndw69.
Glewwe, P., M. Kremer, and S. Moulin (2001) ‘Textbooks and Test Scores: Evidence from a Randomized Evaluation in Kenya’. Washington, DC: Development Research Group, World Bank.
Glewwe, P., M. Kremer, S. Moulin, and E. Zitzewitz (2004). ‘Retrospective vs. Prospective Analyses of School Inputs: The Case of Flip Charts in Kenya’. Journal of Development Economics, 74 (1): 251–68.
the Labor Training and Modernization Project’. Ex-Post Project Evaluation Report OVE/EPPER-03/06, Washington, DC: IDB.
Inter-American Development Bank (IDB) (2006b). ‘Impact Evaluation of the Job Training Component (PROCAJOVEN) of the Assistance Program for the Building of a Training and Employment System in Panama’. Ex-Post Project Evaluation Report OVE/EPPER-02/06. Washington, DC: IDB.
International Fund for Agricultural Development (IFAD) (2005). ‘Republic of the Gambia: Rural Finance and Community Initiatives Project’. Interim Evaluation Report No. 1623-GM. Rome: IFAD.
International Fund for Agricultural Development (IFAD) (2006a). ‘Republic of Ghana: Upper West Agricultural Development Project’. Interim Evaluation Report No. 1758-GH. Rome: IFAD.
International Fund for Agricultural Development (IFAD) (2006b). ‘Republic of Ghana: Upper East Region Land Conservation and Smallholder Rehabilitation Project (LACOSREP) - Phase II’. Report No. 1757-GH. Rome: IFAD.
Jalan, J., and E. Glinskaya (2005). ‘Improving Primary School Education in India: An Impact Assessment of DPEP I’. Washington, DC: World Bank. Mimeo.
Ohlin, G. (1970). ‘The Evolution of Aid Doctrine’. In J. Bhagwati and R. Eckaus (eds),
Foreign Aid, excerpts of Goran Ohlin (1966) The Evolution of Aid . Harmondsworth: Penquin.
Olken, B. (2005). ‘Monitoring Corruption: Evidence from a Field Experiment in Indonesia’. NBER Working Paper 11753. Cambridge, MA: National Bureau of Economic Research.
Pearson, L. (1969). Partners in Development: Report of the Commission on International Development. New York: Praeger Publishers.
Rawlings, L., L. Darling Sherburne-Benz, and J. Van Domelen (2004). Evaluating Social Funds: A Cross-Country Analysis of Community Investments (Regional and Sectoral Studies). Washington, DC: International Bank for Reconstruction and Development, and World Bank.
Schwartz, J. B., and I. Bhushan (2006). ‘Cambodia: Using Contracting to Reduce Inequity in Primary Health Care Delivery’. In D. Gwatkin, A. Wagstaff and A. Yazbeck (eds), Reaching the Poor with Health, Nutrition, and Population Services: What Works, What Doesn't, and Why.Washington, DC: World Bank.
UNCDF (2003). Microfinance Programme Impact Assessment. New York: UNCDF.
White, H. (1992). ‘The Macroeconomic Impact of Development Aid: A Critical Survey’. Journal of Development Studies, 28 (2): 163-240.
White, H. (2007) ‘Evaluating Aid Impact: Approaches and Findings’. In S. Lahiri (ed.),
The Theory and Practice of Foreign Aid, vol. 1. New York: Elsevier.
World Bank (2003). ‘Books, Buildings and Learning Outcomes: An Impact Evaluation of World Bank Support to Basic Education in Ghana’. Washington, DC: Operations Evaluation Department, World Bank.
World Bank (2005). ‘Maintaining Momentum to 2015? An Impact Evaluation of Interventions to Improve Maternal and Child Health and Nutrition Outcomes in Bangladesh’. Washington, DC: Operations Evaluation Department, World Bank.