An Algorithm for Automated View Reduction in
Weighted Clustering of Multiview Data
N. Aparna
PG Scholar
Department of Computer Science Sri Ramakrishna College of Engineering,
Coimbatore
M. Kalaiarasu
Associate Professor
Department of Information Technology Sri Ramakrishna College of Engineering,
Coimbatore
ABSTRACT
Clustering multiview data is one of the major research topics in the area of data mining. Multiview data can be defined as instances that can be viewed differently from different viewpoints. Usually while clustering data the differences among views are ignored. In this paper, a new algorithm for clustering multiview data is proposed. Here, both view and variable weights are computed simultaneously. The view weight is used to determine the closeness or density of view. Those views which have a weight less than a predefined value are considered insignificant and are eliminated. Variable weight is used to identify the significance of each variable. In order to determine the cluster of objects both these weights are used in the distance function. In the proposed method, enhancement to the usual iterative k-means is done so that it automatically computes both view and variable weights.
Keywords
Clustering, k-means, multiview data, variable weighting, view reduction
1. INTRODUCTION
Clustering is a fundamental technique of unsupervised learning in machine learning and statistics. It is generally used to find groups of similar items in a set of unlabeled data. Multiview data are instances that can be represented in more than one ways from different feature spaces. Here the data is observed from multiple outlooks and in multiple types of dimensions. For example, in a student data set, variables can be divided into personal information view showing the information about the student’s personal information, the academic view describing the student’s academic performance and the extra-curricular view which gives the extra-curricular activities and achievements made by the student.
Traditional methods take multiple views as a set of flat variables and do not take into account the differences among various views [1], [2], [3]. In the case of multiview clustering, it takes the information from multiple views and also considers the variations among different views which produces a more precise and efficient partitioning of data. Variable weighting clustering calculates a weight for each variable [4], [5], [6]. This weight is used to determine the variables that are important and those that are unimportant. In
traditional variable weighting clustering, there are various methods that calculate and consider the weights for individual variable but do not consider the discrepancies in views in the case of multiview data. Thus, those methods do not provide an efficient or accurate clustering. In multiview data, differences in the views and also the importance of each variable in the view must be considered.
In this paper, a new automated view reduction (AVR) algorithm for multiview data has been proposed. It is an enhancement to the usual k-means algorithm. In order to differentiate the effects of different views and different variables in clustering, the view weights and individual variables are applied to the distance function. Here while computing the view weights, the complete set of variables are considered and while calculating the weights of variables in a view, only a part of the data that includes the variables in the view is considered. Thus, the view weights show the significance of views in the complete data and the variable weights in a view shows the significance of variables in a view alone
Fig.1 illustrates the multiview concept. Once the view weights are calculated, the views with weights below than the user given threshold is eliminated. Here a formula from an optimization model was derived which is used for calculating both view weights and variable weights. This is an extension to the basic k-means clustering process.
Fig 1: Multiview concept
This new clustering algorithm remains efficient in clustering large high dimensional multiview data because this method does not require any complex computations. Its computational complexity is same as that of basic k-means.
Section 3 gives the problem statement. Section 4 provides the detailed description of the proposed algorithm. Section 5 presents the experiments and results of performance of the proposed method. Conclusions are given in section 6.
2. RELATED WORK
There are two methods for unsupervised learning of multiview data. In centralized algorithms, more than one representation is taken together at the same time in order to extract the data patterns. Another method is the distributed one. It first learns the hidden patterns in each representation separately and then from those multiple patterns the optimal ones are learned [7]. De Sa [8] proposed a two view spectral clustering algorithm where there are independent subsets of dimensions, each of which could be used for clustering. It creates a bipartite graph and clusters the data in each view so as to minimize the disagreement between the clustering in each view
In [9], Huang et al proposed a new method called W-K-means that can calculate weights for variables automatically. The calculated variable weight is based on the importance of the variables in clustering. These weights can be used for selecting the variables in data mining applications where large data are involved. The optimal weights are found when the algorithm converges. The computed variable weights are inversely proportional to the sum of the within cluster variances of the variable. Hence noisy variables get assigned with least weights and thus their impact on the clustering results is reduced. This method considers only individual variables.
Jing and Huang [10] have proposed a new k-means type algorithm for clustering high dimensional objects in subspaces. The concept of weight entropy is used to assign weights to each dimension in the subset and different dimensions are considered to make different contributions to the identification of objects to the cluster. The within cluster scattering is brought to be the least and negative weight entropy is maximized at the same time so that more dimensions donate to the identification of a cluster. This can avoid the problem of identifying clusters by a few dimensions with sparse data.
SYNCLUS [11] is the first clustering algorithm that used the concept of both view weights and variable weights. It is done in two steps. In the first step all the variables are assigned some weights randomly which is then partitioned into k clusters using k means. The second step computes a new set of optimal weights by optimizing a weighted mean-square. These two steps are repeated until the process converges to an optimal set of variable weights. This method computes the variable weights automatically. But the view weights are given by the users.
3. PROBLEM DEFINITION
The problem of finding clusters in variable groups and individual variables can be stated as follows. Let
be a set of n objects represented by the set P of s variables. Assume P is divided into Q views where
for r
t and . Letbe a set of Q view weights, where indicates the weight that is assigned to the view and .Let R={Rj} be a set of s variable weights,
where Rj indicates the weight that is assigned to the
variable and , . Assume
that X contains k clusters from G. Along with that we have to find the important views from the view weight matrix
[V ]
t QV
and identify the important variables from the variable weight matrix R=[Rj]s .In the new method, the two types of weights are used for different aims. In W-k-means [9], the variable weights are used to recognize the subset of variables in which clustering structures occur, and eliminate the effect of insignificant (or noisy) variables. In the new method, we assume that the cluster structures occur in variable groups G and use variable weights Rt to identify the subset of variables in each variable group Gt. Meanwhile, the variable group weights V are used to identify the importance of cluster structures among these variable cluster structures. If the variable group contains insignificant cluster structures, a small variable group weight should be assigned to eliminate the effect of such variable groups. On the contrary, if the variable group contains significant cluster structures, a big variable group weight should be assigned so as to enhance the effect of such variable group. The group with weights less than a threshold value is eliminated and then the weight values are recalculated. These variable groups are termed as views.
View weights can be easily distinguished than the variable weights as the number of views is much smaller than the number of variables. View weights are determined in the view level alone while the variable weights within a view will be determined.
4. AVR CLUSTERING ALGORITHM
4.1. Proposed system
The proposed AVR algorithm is illustrated in Fig 2.It involves the following steps.
1. Enter the threshold view weight value
2. Initialize i to 0, k centroid view weights and variable weights
3. Calculate the distance of each object to each centroid
4. Calculate the new values of view weight and variable weights based on the above calculated distances
5. For the first iteration , eliminate the view with weights below threshold view weight else go to next step.
6. Assign the object to that cluster from which it has minimum distance
7. Recalculate the centroid values
Fig 2: Flowchart for AVR algorithm
4.2. The optimization model
The clustering process to partition the X into k clusters that considers both view weights and variable weights is represented as a minimization of the following objective function.
(1)
subject to
Where U is an n x k partition matrix whose elements are
binary where indicates that object i is allocated to
cluster o. is a set of k vectors on behalf of the centers of the k clusters. are Q weights for Q views. … } are s weights for s variables.
are two given parameters is a distance or
dissimilarity measure on the variable between the object and the center of the cluster.If the variable is numerical then . If the variable is
categorical then if and 1 if .
The first term in the objective function is the sum of the within cluster dispersions. The next two terms are negative weight entropies. The two positive parameters and are used to control the strength of motivation for clustering on more views and variables.
The objective function can be minimized by iteratively solving the following four minimization problems.
1. Problem P1: Fix C=C^,R=R^ and V=V^ and solve the reduced problem P(U,C^,R^,V^).
2. Problem P2: Fix U=U^, R=R^ and V=V^ and solve the reduced problem P(U^,C,R^,V^).
3. Problem P3: Fix C=C^, U=U^ and V=V^ and solve the reduced problem P(U^,C^,R,V^).
Start
Enter cluster number, threshold view weight
Initialize i=0, k centroids, view and variable weights
Calculate the distance of each object to each centroid
Eliminate views with weights below threshold view weight and increment i Recalculate the view weights and variable
weights
Recalculate the centroids Assign the object to the cluster from which
it has minimum distance
If i==0
Check if centroid moves
4. Problem P4: Fix C=C^, R=R^ and U=U^ and solve the reduced problem P(U^,C^,R^,V).
To solve problem 1 consider
(2)
If for where
and for
Problem 2 is solved by
(3) for .
If the variable is categorical then where is the
mode of the variable values of the variable in cluster c. The solution to problem 3 is given by considering the following. Let C=C^, U=U^ and V=V^ be fixed. P(U^,C^,R,V^) is minimized iff
(4) Where
The solution to problem 4 is as follows .Let C=C^, U=U^ and R=R^ be fixed. Then, P(U^,C^,R^,V) is minimized iff
(5)
where
AVR Algorithm
The algorithm that minimizes the objective function (1) is given as follows:
Input: Cluster numbers k, threshold view weight Tv and the
input parameters μ and γ
Output: Finest values of U, C, V and R.
Choose the cluster centers Co and randomly initialize Vo and Ro
Let t=0;
Calculate U, C, R, V
Prioritize the views in the order of view weights calculated Eliminate those views whose weights fall below Tv
Repeat
Update Ut+1 by (2); Update Ct+1 by (3);
Update Rt+1 by (4); Update Vt+1 by (5); t=t+1;
until the objective function attains its confined least value.
The input parameters γ and μ are used to control the distribution of the two types of weights V and R. We can show that the objective function (1) can be minimized with respect to v and r iff γ ≥ 0.
If γ > 0 , according to (10), v is inversely proportional to D. The smaller Dt, the larger vt, the more important the corresponding view. If γ=0 ,this will produce clustering result with only one important view. It may not be desirable for high-dimensional data sets.
If μ > 0, according to (8), r is inversely proportional to F. The smaller F, the larger r, and the more important the corresponding variable is. If μ=0 clustering results with only one important variable in a view.
5. EXPERIMENTS ON THE
PERFORMANCE OF AVR ALGORITHM
5.1. Experimental setup
5.1.1. Characteristics of Real-Life Data Set
The Water Treatment Plant data set came from the daily measures of sensors in an urban waste water treatment plant [12]. This data set contains 527 instances and 38 features. The 38 features can be partitioned into four views.
The first 22 attributed that describes the input conditions of the plant is considered to be the first view. Attributes from 23 to 29 portrays the output demands. Third view is illustrated by the attributes 30 to 34 because it depicts the performance input values. Final view is described by the last four features.
Below are the graphical representations of the clustering results. Fig 3 shows the variation in variable weights for varying μ values and fixed γ values. Fig 4 shows the variation in view weights for varying μ values and fixed γ values.
Table 1: Variable weights vs γ value for fixed μ value
[image:5.595.56.270.147.266.2]From Table 1, it is observed that as μ increased, the variance of V decreased rapidly. This result can be explained from (eqn 4) as μ increases, V becomes flatter. The graphical representation of the Table 1 has been shown below.
Fig 3: Variable weights vs γ value for fixed μ value
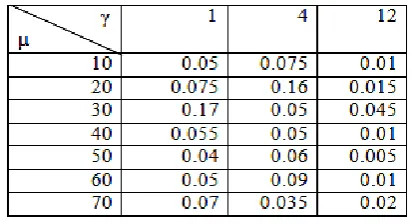
Table 2: View weights vs μ value for fixed γ value
[image:5.595.64.272.340.504.2]Table 2 shows that as γ increased, the variance of view weights decreased rapidly. This result can be explained from (eqn 5) as γ increases, W becomes flatter. The graphical representation has been shown below.
Fig 4: View weights vs μ value for fixed γ value
From above analysis, it can be summarized that the following method can be used to control two types of weight distributions in AVR by setting different values of γ and μ. The experiments have been conducted for three different values of μ and γ for varying values of γ and μ respectively.
Large μ makes more variables contribute to the clustering while small μ makes only important variables contribute to the clustering.
Large γ makes more views contribute to the clustering while small γ makes only important views contribute to the clustering.
Table 3: Comparison of accuracy rates of dataset considering all views
From Table 3 it is observed that the clustering accuracy of AVR is better than WK-Means and EW-K-Means. It is observed that as the number of objects increases the accuracy of the proposed algorithm remains efficient than the other two. The graphical representation of the Table 3 is plotted below
To sum up, it is possible to control two types of weight distributions in AVR by setting different values of γ and μ and AVR is superior to the other two clustering algorithms in clustering multiview data.
Table 4: Clustering accuracies of dataset after view reduction
The accuracies of the four clustering algorithms with the computed cluster centers and weights are shown in Table 4. In comparison of the clustering accuracies in Table 4 with the clustering accuracies in Table 3, k-means, EW-K-means and W-K-means were improved after removing the least weighted 0.0
0.1 0.2 0.3 0.4 0.5 0.6 0.7 0.8 0.9
0 5 10 15 20 25 30 35
V
ar
iab
le
we
ig
h
ts
γ
μ=1
μ=4
μ=12
0.00 0.02 0.04 0.06 0.08 0.10 0.12 0.14 0.16 0.18
0 10 20 30 40 50 60 70 80
V
ie
w
we
ig
h
ts
μ
γ=1
γ=4
γ=12
Algorithms Clustering accuracy %
k-means W-k-Means EW-k-Means
AVR
0.921 0.947 0.964 0.968
Algorithms Clustering accuracy %
k-means W-k-Means EW-k-Means
AVR
[image:5.595.64.272.582.694.2] [image:5.595.325.549.639.701.2]view. Among these algorithms, EW-K-means resulted in a significant increase. The other three clustering algorithms kept similar clustering accuracies as the clustering accuracies on the full data set. This indicates that cluster structures were made more obvious after removing the insignificant view.
6. CONCLUSION
In this paper, an efficient algorithm for clustering multiview data has been proposed. It can compute weights for views and individual variables simultaneously in the clustering process. With the two types of weights, dense views and significant variables can be identified and effect of low-quality views and noise variables can be reduced. The insignificant views are eliminated based on the input threshold weight. Therefore, this algorithm can obtain better clustering results than individual variable weighting clustering algorithms from multiview data. The performance of the AVR algorithm is compared with two other clustering algorithms and the results have shown that the proposed algorithm significantly outperformed the other clustering algorithms. It also compared the effect of control parameters on the view weights and variable weights.
8. REFERENCES
[1] S. Bickel and T. Scheffer,2004, “Multi-view Clustering,” Proc. IEEE Fourth Int’l Conf. Data Mining, pp. 19-26.
[2] D. Zhou and C. Burges 2007 “Spectral Clustering and Transductive Learning with Multiple Views,” Proc. 24th Int’l Conf. Machine Learning, pp. 1159-1166. [3] G. Tzortzis and C. Likas, 2010 “Multiple View Clustering Using a Weighted Combination of Exemplar-Based Mixture Models,” IEEE Trans. Neural Networks, vol. 21, no. 12, pp. 1925-1936.
[4] R. Gnanadesikan, J. Kettenring, and S. Tsao, 1995 “Weighting and Selection of Variables for Cluster Analysis,” J. Classification,vol. 12, pp. 113-136. [5] G. De Soete, 1986 “Optimal Variable Weighting for Ultrametric and Additive Tree Clustering,” Quality and Quantity, vol. 20, pp. 169-180.
[6] E. Fowlkes, R. Gnanadesikan, and J. Kettenring,1988 “Variable Selection in Clustering,” J. Classification, vol. 5, pp. 205-228.
[7] B. Long, P. Yu, and Z. Zhang, 2008“A General Model for Multiple View Unsupervised Learning,” Proc. Eighth
SIAM Int’l Conf. Data Mining (SDM ’08.
[8] V.R. de Sa, “Spectral Clustering with Two Views,” 2005 Proc. IEEE 22nd Int’l Workshop Learning with Multiple
Views (ICML),pp. 20-27.
[9] Z. Huang, M. Ng, H. Rong, and Z. Li,
2005“Automated Variable Weighting in k-Means Type Clustering,” IEEE Trans. Pattern Analysis and Machine Intelligence, vol. 27, no. 5, pp. 657-668.
[10] L. Jing, M. Ng, and Z. Huang, 2007 “An Entropy Weighting k-Means Algorithm for Subspace Clustering of
High-Dimensional Sparse Data,” IEEE Trans. Knowledge and Data Eng., vol. 19, no. 8, pp. 1026-1041. [11] W. DeSarbo, J. Carroll, L. Clark, and P. Green, 1984 “Synthesized Clustering: A Method for Amalgamating
Clustering Bases with Differential Weighting Variables,” Psychometrika, vol. 49, no. 1,pp. 57-78.