A Comparative Study on the Performance of HZR+
Trees on Query Processing
Suba S
Vasavi College of Engineering, Ibrahimbagh,Hyderabad-30
ABSTRACT
Data is being produced in new forms and unimaginable quantities. Researches and other scientific and commercial applications are engrossing the scientific community for their size and need of faster accessibility. The conventional access methods previously available in multidimensional databases are no longer suitable for the new form of data produced. In traditional databases, multicolumn index is created using B-tree [5]. This indexing cannot slide over columns, so the primary index column must be in the WHERE clause filters of the query. The R-tree [3], an extension of the B-tree, is a hierarchical, height balanced multidimensional indexing structure that guarantees space utilization above a certain threshold. But the data produced in most of the cases are not spatial in nature. Therefore, the data should be restructured in order to map the non-spatial data to geometric space. Thus, the multidimensional accessibility of spatial access methods, experimented on non spatial data for the first time and the analysis of which has produced interesting results forms the major contributions of this paper. The sequence of procedures followed to arrive at the analytical study is as follows:
1. The packing of non spatial data converts the data into a form that paves the way for multidimensional access, similar to using spatial access methods for spatial data. 2. The proposal of reduction of overlap of data using Hilbert curves for ordering the data before insertion into the proposed indexing structure
3. The proposal of a new index structure, Hilbert ZR+ Tree [HZR+ Tree].
4. A collection of experiments and analysis which validates and proves the efficiency of the proposed data model.
Keywords
Hilbert ZR+ Tree, packing-data, NSR-Tree
1.
INTRODUCTION
Hilbert ZR+ tree is a clustered model of ZR+ Tree[1] which is based on the Hilbert space filling curve. It is a height balanced tree like R-tree, with a fill-factor F. Pre-processing of the required column values among a set of tuples in the relation is done and a range is computed based on the minimum and maximum values of each dimension among those tuples. This forms the rectangle entry and is termed as Minimum Bounding Rectangle (MBR) similar to R-tree, thus the multicolumn values are converted into key values of the required multi-dimensions and are then inserted into the node. The fill factor F signifies the number of key values possible at each node of the tree. Every other node, either leaf or intermediate node, has between F/2 and F
entries. The leaf node points to the actual pre-processed data in the database. Each entry in a leaf node signifies the set of rows converted into an interval in each dimension. The intermediate node holds references that point to its children (leaf nodes or the next level of intermediate nodes), the MBRs corresponding to its children, and its own MBR. Unlike B-trees, the keys in HZR+-trees are multidimensional attributes that are either difficult or not feasible to define in a linear fashion.
2.
MULTIDIMENSIONAL INDEXING
STRUCTURES-A LITERATURE
SURVEY
2.1
R- Trees
R-trees [3] are a direct extension of B+-trees in k-dimensions. The data structure is a height-balanced tree which consists of intermediate and leaf nodes. R-Trees are Rectangular Trees in which the every node in the tree is a rectangle. The root will be larger rectangle which will enclose all lower level rectangles. Data objects are stored in leaf nodes and intermediate nodes are built by grouping rectangles at the lower level. Each intermediate node is associated with some rectangle which completely encloses all rectangles that correspond to lower level nodes.
Limitations of R-tree
In R-trees, sub-regions can overlap. So leads to more expensive searching.
Single query traverse multiple branches.
It tends to degrade performance
2.2
R+ -Trees
The R+-tree [7], first proposed in 1987 by Sellis et al, uses a clipping approach to avoid overlap between regions at the same level. As a result of this policy, a point query in the R+-tree corresponds to a single path tree traversal from the root to a single leaf. The R+-tree exhibits better search performance, making it suitable for applications where search is the predominant operation. In simple words, R+-trees do not allow overlapping of MBRs at the same tree level. In turn, to achieve this, inserted objects have to be divided in two or more MBRs, which mean that a specific object’s entries may be duplicated and redundantly stored in several nodes. R+-trees are considered to be one of the most efficient indexes for supporting point and range queries.
Limitations of R+-tree
43 R+-trees generally perform better for search
operations, although this benefit comes at the cost of higher complexity for insertions and deletions.
Certain conditions where it is Unable to insert, Unable to split
2.3
ZR+ -Trees
ZR+ Tree [1] was proposed in 2009 which considered clipping procedure to avoid overlaps even at the leaf nodes and thereby multiple path searches. It is also a height-balanced tree (like R-Tree) which consists of intermediate and leaf nodes. Limitation of ZR+ Tree [1] is that when the data is skewed the number of overlaps of the tree nodes will be more resulting in many number of clippings which increases the insertion cost. Moreover when a non spatial domain like marketing domain is concerned too many numbers of clippings will not have any semantically acceptable information. This caused the introduction of the proposed indexing structure the Hilbert ZR+ tree, the detailed algorithms and implementation of which is given in later chapters.
The main challenge is in using spatial access methods to operate with non spatial data. The major issues in this context include providing a spatial representation to non-spatial datasets and a data model for handling multidimensional non spatial data.
3.
HILBERT ZR+ TREE INDEX
MODEL
3.1
Packing of Data
Let D be the database, R be the relation and X be the set of attributes of R. Let Y be the subset of X which are the dimensions of interest. Let p be one of the attributes in Y which will be the key dimension. To get d-dimension interval for the spatial representation of these dimensions, the preprocessing is done. The tuples in R are sorted based on p. Then the dimensions other than p are taken for forming the MBRs to be inserted into a node. Let T be the range to be considered for forming the MBR. The tuples which have been sorted on the basis of p are taken in a group of T. The maximum and minimum of each dimension other than p are found and suitable data structure is framed to insert the MBR in the node of HZR+ Tree.
In the sample database, the dimensions are product, day and sales, and naturally every sales value is described by the associated product and day. For forming a range, the day dimension is organized into weeks. For each tuple (p, d, s) where d is the day of the year, p the product id, and s the sales, an association can be made to a set of numeric values Unit Price, Quantity Sold and Expense. The multidimensional index to be created is based on these three attributes. When indexes are to be created on multiple attributes, HZR+ Trees use spatial access methods for data storage and retrieval of data in non-spatial domain.
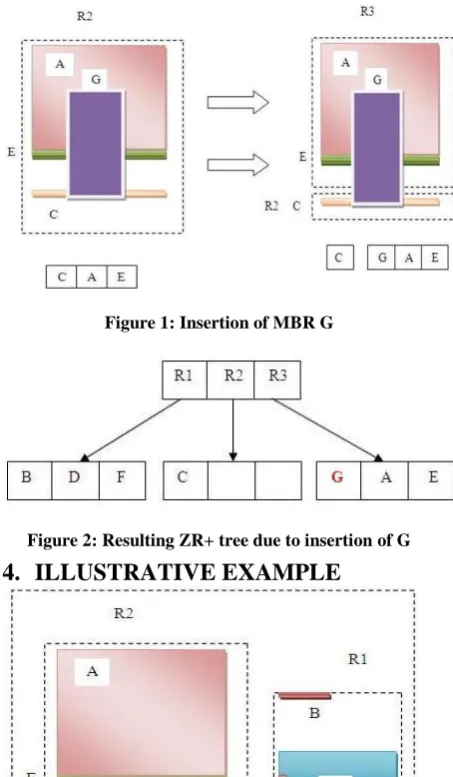
[image:2.595.323.550.70.459.2]During preprocessing step, sale values for 4 consecutive days were considered for each product. The low and high sale values and dates were considered for forming rectangles to be inserted into the HZR+ Tree. Uniformly distributed real and synthetic data sets with one hundred thousand rows were used for experimentation.
[image:2.595.325.533.328.534.2]Figure 1: Insertion of MBR G
Figure 2: Resulting ZR+ tree due to insertion of G
4.
ILLUSTRATIVE EXAMPLE
Figure 3: Rectangles initially
[image:2.595.328.512.567.671.2]This data finally leads to the following HZR+-tree structure with nodes named by the rectangles they point to.
Figure 4: HZR+-Tree initially
The following figure shows the sample structure as well as a hatched rectangle being the MBR of an object in the database that is to be inserted into the given index.
Figure 5: To insert rectangle G
Calling the INSERT algorithm now will first of all lead to a call to ISOVERLAPPING which calls GETLEAFNODES. This algorithm traverses the tree from the root to its leaf and finally identifies R1 and R2 as the rectangle which overlaps with the object to be inserted. The algorithms path through the tree is shown by the following figure.
Figure 6: HZR+-Tree to insert G
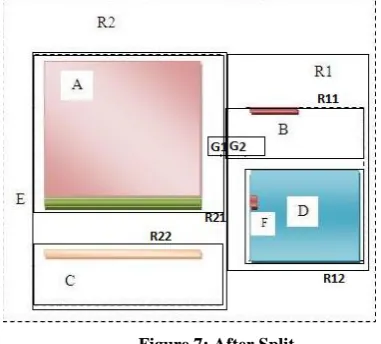
[image:3.595.324.549.71.148.2]Having now identified the place where to insert the new object into the tree, the main part of the Insert algorithm will clip the object vertically into G1 AND G2 to be inserted into the tree. On finding that there is not enough space left to insert the new object SPLITNODE is called onR2 to split into two nodes R21 and R22 with the resulting node’s MBRs being minimal. The first split will be R2 and the MBR of the second split will be named R3.
[image:3.595.326.548.289.414.2]Figure 7: After Split
Figure 8: Tree after inserting G1
[image:3.595.76.257.313.415.2]Now, as nodes have been split and the new object G1 has been inserted into the tree, a call to ADJUSTTREE is made to ensure that all nodes preceding the node that has been changed are accordingly changed themselves. The resulting tree after the first split and insertion of the node G1 is illustrated in the figure 8. Next G2 has to be inserted in R1 calling for SPLITNODE and ADJUSTTREE again. The process of splitting can be illustrated as in figure 7. No further split is required and finally the resulting tree containing the new object looks as shown below.
Figure 9: HZR+-Tree after split
Let T be the root of a given HZR+-tree. Let S be the search rectangle, the algorithm is intended to identify all index records whose rectangle overlap S. The index entry is denoted by E’s rectangle E.I and its TID or CP by E.p.
The input is a search rectangle (Query box). The search starts from the root node of the tree. Every internal node contains a set of rectangles and pointers to the corresponding child node and every leaf node contains the rectangles of the original data cluster (the pointer to some spatial object can be there). For every rectangle in a node, it has to be decided if it overlaps the search rectangle or not. If yes, the corresponding child node has to be searched also. Searching is done like this in a recursive manner until all overlapping nodes have been traversed. When a leaf node is reached, the contained bounding boxes (rectangles) are tested against the search rectangle and their objects (if there are any) are put into the result set if they lie within the search rectangle.
[image:3.595.71.262.521.693.2]45 Figure 10: Search window
[image:4.595.71.294.364.529.2]The algorithm of course starts its work at the root node. As the object’s MBR overlaps R2, search will continue in the sub trees of only R2. Traversing the sub tree of R2, the search will reach node R21.Further moving down the leaf nodes will be reached. Rectangles A and G are found to overlap the search object and since they are leaf nodes the search will end there. Finally search will return nodes G and A overlapping the search rectangle and therefore these objects make up the result of the search. At last, the following graph is meant to visualize the path of this search through the tree structure.
Figure 11: Search path
5.
RESULT AND ANALYSIS
5.1
Performance analysis with
PostgreSQL and MS SQL
The experimental analysis is done using PostgreSQL database, MS SQL and Oracle. Datasets of size 10000, 50000, 100000 and 200000 have been considered. In PostgreSQL as well as MSSQL, the default index i.e. B-Tree is compared with the implementation of HZR+-tree index. A comparison with a modified version of R-Tree, NSR-Tree (Non-Spatial R-tree) has also been done. The analysis is done on table without index and on the table with index in PostgreSQL and with index in MSSQL. Experiments have been done with fill factor 3 because 3 is the default fill factor of the implementation. The minimum fill factor for PostgreSQL B-tree index structure is 10 and hence 11 is taken as another fill factor. Experimentation was done with fill factor 90 too. In MSSQL, analysis is done with fill factor 90.
The range/point queries which are used for analysis are:
select * from table_name where day between 1 and 5 and sales between 100 and 2000
select * from table_name where day between 1 and 14 and sales between 1000 and 20000
select * from table_name where day between 9 and 12
select * from table_name where sales between 1000 and 20000
select * from table_name where day between 2 and 5
select * from table_name where sales between 100 and 2000 and day between 1 and 5
select * from table_name where sales between 100 and 2000 and day between 1 and 14
select * from table_name where day=5 and sales=2614
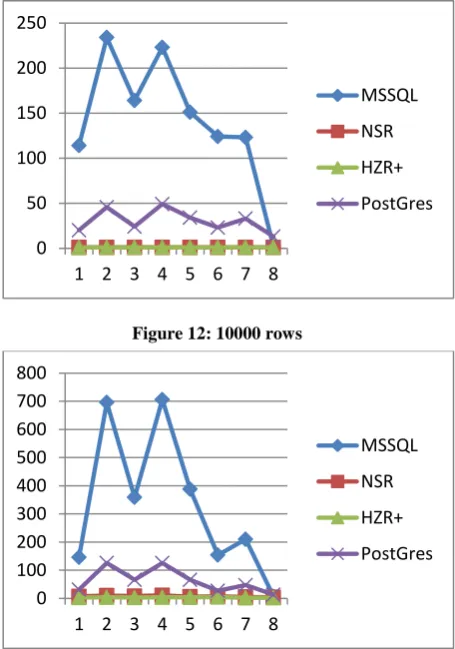
Figure 12 to Figure 15 shows the execution time to get the leaf node using HZR+ tree, R Tree and B-tree. The reason for using B-tree structure for comparison is that in PostgreSQL and MSSQL, the non-spatial data is not indexed using R-tree index.
Here, from the experiments, it is shown that for range queries, HZR+ tree performs better than conventional B-tree index.
The X-axis shows the queries 1 to 8 as described above. Y-axis shows the leaf node retrieval time for these queries. The comparisons have been made for 7 cases.
a. With B-tree index fill factor 90, 11 and 100
[image:4.595.324.552.392.717.2]b. HZR+ tree fill factor 3, 11, 90 and 150
Figure 12: 10000 rows
Figure 13: 50000 rows
0 50 100 150 200 250
1 2 3 4 5 6 7 8
MSSQL
NSR
HZR+
PostGres
0 100 200 300 400 500 600 700 800
1 2 3 4 5 6 7 8
MSSQL
NSR
HZR+
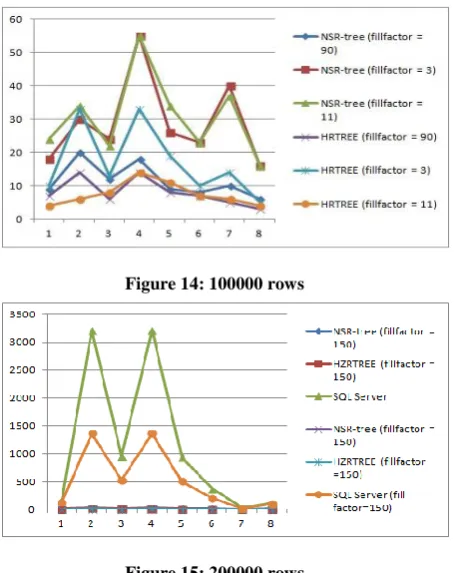
Figure 14: 100000 rows
Figure 15: 200000 rows
5.2
Comparison of HZR+-Tree index
with PostgreSQL and MSSQL
The analysis results show that HZR+-tree indexing has increased efficiency with larger datasets. In queries where the filter has leading index column with full range, the index is not used by PostgreSQL and MSSQL. The sequential scan is done leading to higher execution time. On the contrary, in HZR+-tree index scan is effective with lesser execution time. In queries where the leading index column is not specified in the filter, PostgreSQL avoids index scan and does the sequential scan. But HZR+-tree index scan is effective here too. In HZR+-tree index scan, as the fill factor is increased, the execution time is decreased. HZR+-tree index scan has lesser execution time for point queries also compared to PostgreSQL and MSSQL index scan. However if the queries have ranges of big sizes, HZR+-tree is not so successful.
The experimental analysis is done using PostgreSQL database. Datasets of size 10000, 50000, 100000 and 200000 have been considered. Experimentation is done by evaluating the performance between the HZR+-tree table and the original table with B-Tree index. Similar queries are shot to both the table and the execution time is analyzed. Each row is a page access. So the total number of rows returned gives us the number of page accesses required, also the total cost for execution of a query is calculated. The indexing of original table is based on pid, day, and sales, with the leading index as the pid. The Fill factors used are 3, 11, 90 and 150.
6.
CONCLUSIONS
With the presented material it could be concluded that applying the spatial indexing methods for non spatial domains is worth improving the performance measures of range and point queries on the data. The preprocessing and clustering steps may seem to be overhead, but by slightly modifying the regular insertion algorithm to insert data into
the database only after the number of rows required for forming the rectangular data from the point data could be considered. If queries with particular filter clauses were executed on the database beyond a certain threshold, creating an index dynamically based on the filter attributes could be considered for future work. Based on the number of dimensions, learning an optimal fill-factor provides scope for further research as well. This would drastically improve the performance of the database management system.
7.
REFERENCES
[1] Chang-Tien Lu, Jing Dai, Ying Jin, Mathuria J. “GLIP: A Concurrency Control Protocol for Clipping Indexing”, Knowledge and Data Engineering, IEEE Transactions, Volume: 21, Issue: 5, May 2009.
[2] Ibrahim Kamel and Christos Faloutsos,Hilbert RTree-An improved Rtree using fractals, Proceedings of the 20th VLDB Conference Santiago, Chlle, September,1994
[3] A. Guttman, “R-Trees: A Dynamic Index Structure for Spatial Searching,” Proc. ACM SIGMOD ’84, pp. 47-57, 1984.
[4] V. Gaede and O. Gunther, “Multi- dimensional Access Methods”, ACM Computing Surveys, Vol 30, no. 2, pp. 170-231, June 1998.
[5] A. Guttman, “R-Trees: A Dynamic Index Structure for Spatial Searching,” Proc. ACM SIGMOD ’84, pp. 47-57, 1984.
[6] Harry Leslie, Rohit Jain, Dave Birdsall, and Hedieh Yaghmai “Efficient Search of Multidimensional B-Trees”, Proceedinge of the 21st VLDB Conference, Zurich, Switzerland, 1995.
[7] T. Sellis, N. Roussopoulos, and C. Faloutsos, “The R+-Tree: A Dynamic Index for Multi-dimensional Objects”, Proc. 13th International Conference, Very Large Data Bases (VLDB ’87), pp.507-518, 1987. [8] Norbert Beckmann, Hans–Peter Kriegel, Ralf
Schneider, Bernhard Seeger, Praktuche Informatlk, Umversltaet Bremen, “The R*-tree:An Efficient and Robust access Access Method for Points and Rectangles+”, SIGMOD conference, 1990.
[9] Kamel, Ibrahim and Faloutsos, Christos, "On packing R-trees" (1993). Computer Science Department. Paper 588, Conference proceedings of CIKM,January,1993. [10] N. Roussopoulos ,D.Leifker “Direct spatial searche on
pictorial databases using packed R Trees”, proc. Of ACM SIGMOD ’85
[11] H. V. Jagadish, L. V. S. Lakshmanan, and D. Srivastava. “Snakes and sandwiches: optimal clustering strategies for a data warehouse, SIGMOD Rec., 28(2):37–48. ACM Press, 1999.
[12] Joseph M. Hellerstein, Jeffrey F. Naughton, “Generalized Search Trees for Database Systems”, Proceeding VLDB '95 Proceedings of the 21th International Conference on Very Large Data Bases, Zurich, Switzerland, 1995.