http://dx.doi.org/10.4236/jmp.2014.58073
How to cite this paper: Movahedi-Rad, A. and Alizadeh, R. (2014) Simulating Grain Boundary Energy Using Molecular Dy- namics. Journal of Modern Physics, 5, 627-632. http://dx.doi.org/10.4236/jmp.2014.58073
Simulating Grain Boundary Energy Using
Molecular Dynamics
A. Movahedi-Rad
*, R. Alizadeh
School of Metallurgical and Materials Engineering, College of Engineering, University of Tehran, Tehran, Iran Email: [email protected]
Received 7 March 2014; revised 5 April 2014; accepted 1 May 2014
Copyright © 2014 by authors and Scientific Research Publishing Inc.
This work is licensed under the Creative Commons Attribution International License (CC BY). http://creativecommons.org/licenses/by/4.0/
Abstract
Grain boundary energy is very important in determining properties of ultra fine grain and nano structure materials. Molecular dynamics were used to simulate grain boundary energy at different misorientations for Al, Cu and Ni elements. Obtained results indicated well compatibility with theoretic predictions. It was obtained that higher cohesive energy results in higher grain boun- dary energy and depth of CSLs. In this manner, Ni had the highest and Al had the lowest cohesive energy and grain boundary energy. Also, a linear correlation was obtained between GBE of ele- ments, which was related to relative cohesive energy.
Keywords
Molecular Dynamic, Cohesive Energy, Grain Boundary Energy, Misorientation Angle
1. Introduction
Grain boundary (GB) is one of the planar defects in microstructure of crystalline materials which can be consi- dered as one of the most important parameters which affect properties of ultra fine grain (UFG) and nano struc- ture (NS) materials because of the increased area fraction of GBs. Grain boundary energy (GBE) can be so criti- cal in the field of stability of grains and deformation mechanisms of UFG and NS materials.
There are many reports in literature that have studied different properties of GBs experimentally from differ- ent aspects [1] [2]. However, nowadays computational simulation provides an opportunity to improve our un- derstanding about crystallographic defects more easily in addition to experimental attempts. In this regards and in the field of GBE, Uehara et al. [3] carried out atomistic simulation and studied GBE both before and after re- laxation and stability of GBs in Al. Holm et al. [4] showed strong linear correlation between GBEs of different materials by the means of molecular dynamic (MD) simulation.
Dependence of the GBE on the composition ratio in the bcc iron-chromium alloy was investigated by classic- al molecular dynamics simulation [5]. In another investigation, a phase-field model was used to investigate the simultaneous effects of grain boundary energy anisotropy and the presence of second-phase particles on grain growth in polycrystalline materials [6]. Also, some researchers have simulated the evolution of grain boundaries at elevated temperatures [3] [7].
As mentioned above, it can be seen that computational simulations have been successfully employed for GB studies in recent years. Nevertheless, to the best of authors’ knowledge, little work has been done until yet to study the GB energy as a function of misorientation angle for different FCC metals, comprehensively. So, the aim of this paper is to use MD simulation with LAMMPS, as the advanced computer program for modeling de- fects in materials, to investigate GBE in Al, Cu and Ni elements. LAMMPS is a classical molecular dynamic simulation code designed to run efficiently on parallel computers.
2. Calculation Method
2.1. Embedded Atom Method (EAM)
In this method, each individual atom is considered as an embedded particle in a host aggregate composed of other atoms and it is assumed that the embedding energy of each atom is a function of the electron density of the host before the atom is added [8].
It can express an equation for the total energy of the system which contains N atoms to solve practical prob- lems in metals with many-body bonding properties [9] [10]. The total energy of the system that is composed of
N atoms is given by the following equation:
1 N total i i E E =
=
∑
(1)where Ei is the energy of atom i and Etotal is the total energy.
The EAM potential is made up of two components. First, embedding energy as a function of local electron density and the second, pair potential between atoms i and j.
( )
1( )
2
i ij ij
i J j i
E Fα ρα r ϕαβ r
≠ ≠
= +
∑
∑
(2)where F is the embedding energy which is a function of the atomic electron density,φ is a pair potential interac- tion, and α and β are the element types of atoms i and j. ρα is the electron density at site i. The multi-body nature of the EAM potential is a result of the embedding energy term [10].
2.2. Calculation of Cohesive Energy in Solids
Cohesive energy in solids is defined as the required amount of energy in order to break the atoms into isolated atomic species. The cohesive energy is calculated by using following equation:
isolated coh solid i
i
E =E −
∑
E (3)where i indicates the atoms which constitute the solid.
2.3. Definition of the Grain Boundary Energy
In order to calculate the grain boundary energy, following equation is defined:
(
0)
gb i gb
i V
E E E S
∈
=
∑
− (4)2.4. System Characteristics
For having a sufficiently large system, the area of every region is 200 unit cells in x direction, 200 unit cells in y
direction, and 1 unit cell in z direction and total number of atoms is 160,000. Also, periodic boundary condition is applied in three directions.
Symmetrical 100 tilt GBs were created by arranging atoms in upper and lower groups in x-direction and rotating them in θ/2 and −θ/2, respectively, where θ was given as the misorientation angle. Simulation was done every 5˚ from 0˚ till 90˚ and also for five specific angles, 22.6˚, 28.1˚, 36.9˚, 53.1˚, and 61.9˚ related to the Coincidence-Site Lattice (CSL) boundaries. In addition, since some atoms may be too close to each other due to the rotation in the GBs, a threshold distance was chosen to delete one of the overlapped atoms. So, Delete_atoms
command was used in freely available LAMMPS code to delete created atoms in the GBs.
In order to understand the effect of types of materials on the GB energy, Al, Cu, and Ni elements with FCC crystal structure were selected. In this study, Mishin Al EAM [11], Mishin Ni EAM [11], and Mishin Cu EAM1 [12], and are parameterized to represent Al, Cu, and Ni, respectively. In addition, so as to avoid activating any thermal phenomena, all simulations were carried out at 0.0 K.
2.5. GB Relaxation
For having reliable results, it is essential to reach an equilibrium state. It is done via performing minimize com- mand by iteratively adjusting atom coordinates in two stages. The initial relaxation was applied to the system in order to release it from internal stresses. Then, additional relaxation was programmed to remove hydrostatic pressure of atoms gradually and achieving full relaxation state. In this stage, the GB energies were calculated and the configurations were obtained for all atomistic specimens.
3. Results and Discussion
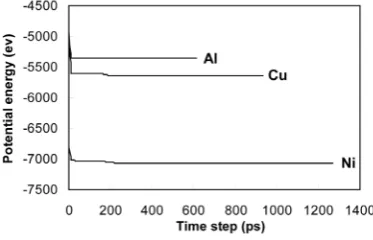
The variation of the potential energy with time step of the investigated elements is shown in Figure 1 for se- lected misorientation of 53.1˚. Similar results were obtained for other misorientations. As can be seen in this figure, the potential energy reaches to a steady state shortly after start. This behavior shows that atoms expe- rience a relaxation state in which they are displaced from their initial positions and try to find more energetically favorable positions. It should be stated here that all potential energies in this paper were calculated after reaching to steady state.
To have a better understanding about the movement of atoms during relaxation state, atomic structure of the material near the grain boundaries at different misorientations is shown in Figure 2 for both before and after re- laxation of atoms. It can be observed from Figure 2 that not only the atoms which are on the grain boundaries, but also the atoms adjacent to the grain boundaries also experience some relaxation. These can be related to steps 1 and 2 of relaxation, respectively, as described in Part 2.5. Another important feature in this figure is that atoms tend to decrease empty region at the grain boundaries by relaxation. This behavior seems reasonable since the grain boundary energy is a function of empty region at the boundary and thus systems have a tendency to change atomic order to decrease energy by decreasing empty regions. It is also evident that dislocations exist at some specific intervals along LAGBs (Figure 2(a)).
To calculate grain boundary energy according to Equation (4), firstly, it was necessary to calculate cohesive energies of the elements. The calculated cohesive energies of Al, Ni and Cu are given in Table 1. These values are in agreement with previous reports for these elements [4] and were used for further calculations.
Figure 1. The variation of the potential energy of the investigated elements with time step.
Figure 2.Atomic structure of grain boundary before (a) (c) and (e) and after (b), (d) and (f) relaxation at misorientation angles of: 10˚ ((a) and (b)), 30˚ (c) and (d) and 36.9˚ (e) and (f).
Table 1.The calculated cohesive energy form EAM interatomic potentials for Al, Cu and Ni.
Elements Ni Cu Al
Cohesive energy (ev) 4.45 3.54 3.37
The GBE shows a smooth increase with misorientation in the low angle region (misorientation < 15˚), which is in agreement with previous reports [13]. However, in the high angle region, the situation becomes more com- plex. Some energy valleys can be seen at specific misorientations for all investigated elements. These valleys are known as CSL when considering variations of GBE with misorientation. CSL definition is based on a simple assumption that the grain boundary energy is low when the coincidence of atomic positions in both adjoining grains is high because the number of bonds that are broken across the boundary would be less in this case. This fact can be clearly seen in Figure 2(f), where it can be observed that the coincidence of atomic positions is high at 36.9˚, in accordance with the observed energy valley at this misorientation in Figure 3.
[image:4.595.83.542.563.599.2]Al at all misorientations. According to the definition of CSLs given above, the depth of CSLs depends on the cohesive energy. This depth is higher whenever the cohesive energy is higher, since there would be more de- crease in GBE in comparison with the GBE of the material in the adjacent misorientations to the CSLs, for the material with higher cohesive. Therefore, the observed trend seems reasonable considering corresponding cohe- sive energy values of the investigated elements given in Table 1. Thus, it can be concluded that cohesive energy plays a critical role in GBE calculations.
GBE of Cu and Ni are plotted against GBE of Al in Figure 4. All data points are taken from Figure 3 at dif- ferent misorientation angles. As can be seen in Figure 4, there is a linear correlation between GBE values in both cases, although there is some scattering. This is in complete accordance with the findings of Holm et al. [4], whom also found similar correlations between GBE values of different fcc materials. They concluded that boun- daries in different fcc metals that share a common crystallography, have energies proportional to one another, when the proportionality factor was related to elastic shear modulus and stacking fault energy in some especial cases. However, here we want to discuss this behavior from another aspect. Since cohesive energy and thus atomic bond energy remains constant by changing misorientation angle, variations in GBE must be due to the change in number of broken atomic bands. Thus, it can be stated that in fact, the trend of variations of number of broken bands with misorientation angle is similar for elements with similar crystallographic structure. Also, it can be concluded that the slope of the lines between GBE of elements at different misorientations depends di- rectly on the relative cohesive energy of elements. Slope of GBE lines in Figure 4 together with relative cohe- sive energy values are given in Table 2. It is clear from Table 2 that the slope of Ni-Al line in Figure 4 is more
Figure 3.The variation of the grain boundary energy with misorientation an- gle.
Table 2.Calculated relative cohesive energy and slope of the GBE lines.
Ni/Al Cu/Al
Relative cohesive energy 1.32 1.05
Slope of the GBE lines in Figure 3 2.63 1.48
than that of Cu-Al line since relative cohesive energy of Ni/Al is more and vice versa for Cu-Al pair. This con- clusion is in accordance with that of Holm et al. [4], since elastic constants originate from cohesive energy in nature. We would discuss this linear relation with more details in our future publications.
4. Conclusion
Molecular dynamics were used to simulate grain boundary energy at different misorientation angles for Al, Cu and Ni fcc elements. Obtained results indicated that cohesive energy plays a critical role in grain boundary energy and also depth of CSLs. Higher cohesive energy results in higher grain boundary energy and depth of CSLs. Obtained results also indicated a linear relation between GBE of elements with similar crystallography structure, an effect which was related to similar change in number of broken bands in elements when changing misorientation angle. The slope of the line between GBE of elements was related to their relative cohesive energy values.
References
[1] Prokoshkina, D., Esin, V.A., Wilde, G. and Divinski, S.V. (2013) Acta Materialia, 61, 5188-5197. http://dx.doi.org/10.1016/j.actamat.2013.05.010
[2] Li, J., Dillon, S.J. and Rohrer, G.S. (2009) Acta Materialia, 57, 4304-4311. http://dx.doi.org/10.1016/j.actamat.2009.06.004
[3] Uehara, T., Wakabayashi, N., Hirabayashi, Y. and Ohno, N. (2008) International Journal of Mechanical Sciences, 50, 956-965. http://dx.doi.org/10.1016/j.ijmecsci.2007.09.001
[4] Holm, E.A., Olmsted, D.L. and Foiles, S.M. (2010) Scripta Materialia, 63, 905-908. http://dx.doi.org/10.1016/j.scriptamat.2010.06.040
[5] Shibuta, Y., Takamoto, S. and Suzuki, T. (2009) Computational Materials Science, 44, 1025-1029. http://dx.doi.org/10.1016/j.commatsci.2008.07.013
[6] Asle Zaeem, M., El Kadiri, H.P., Wang, T. and Horstemeyer, M.F. (2011) Computational Materials Science, 50, 2488-2492. http://dx.doi.org/10.1016/j.commatsci.2011.03.031
[7] Brandenburg, J.E., Barrales-Mora, L.A., Molodov, D.A. and Gottstein, G. (2013) Scripta Materialia, 68, 980-983. http://dx.doi.org/10.1016/j.scriptamat.2013.02.054
[8] Horstemeyer, M.F., Farkas, D., Kim, S., Tang, T. and Potirniche, G. (2010) International Journal of Fatigue, 32, 1473-1502. http://dx.doi.org/10.1016/j.ijfatigue.2010.01.006
[9] Daw, M.S. and Baskes, M.I. (1983) Physical Review Letters, 50, 1285-1288. http://dx.doi.org/10.1103/PhysRevLett.50.1285
[10] Daw, M.S., Foiles, S.M. and Baskes, M.I. (1993) Materials Science Reports, 9, 251-310. http://dx.doi.org/10.1016/0920-2307(93)90001-U
[11] Mishin, Y. and Farkas, D. (1999) Physical Review, B59, 3393-3407. http://dx.doi.org/10.1103/PhysRevB.59.3393
[12] Mishin, Y., Mehl, M.J., Papaconstantopoulos, D.A., Voter, A.F. and Kress, J.D. (2001) Physical Review, B63, Article ID: 224106. http://dx.doi.org/10.1103/PhysRevB.63.224106