Search for Secure Random 8-bit Generator by Modular
Approach of Statistical Test
J K M Sadique Uz Zaman
Department of Radio Physics and Electronics, University of Calcutta, Kolkata – 700009, India
Ranjan Ghosh
Department of Radio Physics and Electronics, University of Calcutta, Kolkata – 700009, India
ABSTRACT
Random key bit generators are used in statistically secured stream ciphers. In stream ciphers pseudorandom key bits are XORed with non-random text bits to generate random cipher bits. In practice, it is impossible to get a Random Bit Generator (RBG) that can be used for encryption as well as for decryption. The solution is to search for a suitable Pseudo Random Bit Generator (PRBG). In this paper, a comparative study of randomness of RC4 is made with that of six set of pseudorandom 8-bit sequences generated by introducing some variations in BBS and PM algorithms. In RC4, the given key randomizes an 8-bit identity S-Box in 256 rounds. The BBS and PM require an initial seed to be given as key. In the study, one algorithm generates 167800 pseudorandom 8-bit key sequences for a given key. For each of the seven sets, 300 such sequences are generated using 300 different given keys. The randomness of 300 sequences for each set are tested using three test modules.
General Terms
Pseudo Random Bit Generator (PRBG), Pseudo Random Number Generator (PRNG), Statistical Randomness Test.
Keywords
NIST Statistical Tests, Pseudorandom Bit Generator, Statistical Randomness Test, Stream Cipher.
1.
INTRODUCTION
In cryptography, stream ciphering algorithms generate a stream of pseudorandom key bits (pk-bits) and such pk-bits are XORed in succession with text bits giving rise to cipher bits. Following reference [1], the necessary condition, that a symmetric ciphering scheme is unconditionally secure, is H(K) ≥ H(M), where H() is an entropy function for random variables K and M denoting respectively the secrete random key and plaintext message. The fact, that the entropy of K is greater than that of M, indicates the probability of occurrence of each bit in a stream of pk-bits under ideal condition is 0.5. The ciphering being unconditionally secure ensures that after XORing the probability of occurrence of each cipher bit is also 0.5. This means that in a stream cipher a sequence of pk-bits shall make a sequence of meaningful message pk-bits into a sequence of completely meaningless irrevocable random cipher bits. The strength of a stream ciphering algorithm lies essentially on its capability to generate a stream of random key bits.
Among many stream ciphers, e.g. RC4, HC-128, Grain etc., each one has its own algorithm to generate pseudorandom sequence (p-sequence). RC4 is the oldest one generating 8-bit p-sequence; HC-128 generates 32-bit p-sequence and the Grain, the 1-bit p-sequence in hardware. In course of time, RC4 turns out to be a popular stream cipher. Its algorithm is very simple and the code is unthinkably short. Possibly, due to
this reason, it is used in many applications. During the last two decades, RC4 has drawn attentions of many researchers - some worked to mark its weaknesses [2-4], some analyzed its strength followed by suggestion to incur small changes in order to improve its algorithm (RC4A and RC4+) without sacrificing its inherent simplicity [5-8] and some worked on hardware design of the original one and also of the improved ones [9-12].
In the present paper it is planned to use a standard Blum Blum Shub (BBS) algorithm [13,14] to generate 8-Bit PRBG and to use Park and Miller (PM) algorithm to generate 8-bit PRNG [15] and to compare their statistical randomness with RC4. It may be noted that the BBS algorithm is based on composite quadratic residue property [16] due to which it exhibits provable security and is considered to be the best possible PRBG. It generates 1-bit (LSB) from one random number generated in each cycle making it a cryptographically secured, but slow algorithm. A faster BBS is considered here by choosing 4 bits in one cycle thereby forming 8 bits in two cycles. On the contrary, the PM algorithm, a number sequence based on linear congruential property, is considered here even though it is considered by many as cryptographically weak. The focus of the present paper is a comparative study on the degree of statistical randomness of the 8-bit BBS p-sequence and 8-bit PM p-sequence with RC4.
The comparative study is undertaken using three test modules. In Sec. 2, the procedures adopted for the three test modules are described. In Sec. 3, the three algorithms generating 8-bit p-sequences are discussed. The results obtained from the three test modules are given in Sec. 4 and the conclusion, in Sec. 5.
2.
MODULAR APPROACH OF
STATISTICAL TEST
A new concept is proposed in Test Module-1 that checks the probability of 8-bit p-sequences in two tests. The Test Module-2 undertakes four tests mentioned in [1] and the Test Module-3 is the CU software [17] based on the NIST Statistical Test Suite [18-21]. In the study, each one of the three algorithms detailed in Sec. 3 generates 8-bit 167800 p-sequences using given non-random keys. Each algorithm generates 300 such p-sequences using 300 different given keys. To study the random characteristics of the three algorithms, the 300 p-sequences generated by each are tested using the three test modules. Both the test modules 2 and 3 consider 1342400 bit sequence instead of the 167800 8-bit p-sequences. Brief description of the three test modules follows.
2.1
Test Module-1
deviation is zero. A sequence is considered to be random if the probability of occurrences of each and all 8-bit characters is close to 1/256. The calculation procedure is as follow.
Let, the probability of ith character is pi and the expected probability for all characters is pn = 1/256 ≈ 0.0039. The normalized standard deviation of occurrences of characters (σ) is obtained as,
2550
2
256
1
i n
n i
p
p
p
(1)First Test: In this test, σ is calculated considering the long stream of 167800 8-bit characters as a whole. To satisfy the value of pn = 0.0039, the expected value of occurrences of each character is about 655 times. If it is assumed to allow 10% deviation and if σ < 0.1024, then the 8-bit p-sequence stream can be considered as random. The σ is calculated using eq.(1) above.
Second Test: Calculation procedure of the second test is similar to the first one. The only difference is that, the 8-bit p-sequence stream is divided into five blocks and σ is calculated for each block. The motivation behind this test is to see if the characters are distributed throughout the whole stream uniformly or there exist clustering of characters. If clustering occurs in a particular p-sequence, the sequence fails the second test, while it may pass the first one. In each block, the expected value of occurrences of each character is 131 times. Five σ values are calculated for each stream and if all σ values are less than 0.1024, the sequence is considered as random.
2.2
Test Module-2
In test module-2, four tests, namely the Frequency test, 2-bit Serial test, 8-bit Poker test and Runs test are considered following Menezes [1]. In frequency test, one has to ascertain if the numbers of 0s and 1s are approximately equal as would have been for a random sequence. The purpose of the 2-bit serial test is to see if the overlapping frequencies of occurrences of 00, 01, 10 and 11 in a bit sequence are approximately the same as would be expected for a random bit sequence. The 8-bit Poker test sees if the non-overlapping frequencies of 28 types of 8-bit patterns appearing in a long bit sequence are approximately the same as would be for a random bit sequence. The runs test considers the number of runs, both of zeros and of ones, of various lengths from 1-bit to 9-bit and sees if these are approximately the same as would be for a random bit sequence. The four tests calculate values X1, X2, X3 and X4 respectively.
The four tests are executed on output sequences of an algorithm. All the tests of this module check the first 13424 bits from the sequence to get a preliminary understanding about the randomness of the algorithm. The degrees of freedom of all the four tests are 1, 2, 255 and 16 respectively. The significance level α is already set at 0.05 and the corresponding upper value of 2 for each of the four tests are 3.8415, 5.9915, 293.2478 and 26.2962 respectively following the table given in [1] for respective degrees of freedom. A sequence will pass the tests if X1, X2, X3 and X4 values are lying within the maximum limit 3.8415, 5.9915, 293.2478 and 26.2962 respectively.
2.3
Test Module-3
The test module-3 contains fifteen statistical randomness tests proposed by NIST [19] – all are important and exhaustive in nature. In fact, module-3 takes a long time to quantitatively
measure parameters defining the degree of randomness of p-sequences generated by an algorithm and to draw a comprehensive decision on randomness of the concerned algorithm. In the event, one has to choose one or few PRBG or PRNG algorithms from among many such algorithms, say 10, module-3 takes exhaustively long time. In order to reduce the total testing time, module-1 and module-2 are considered as preliminary modules so that bad algorithms can be located and rejected fast even without applying module-3 on them.
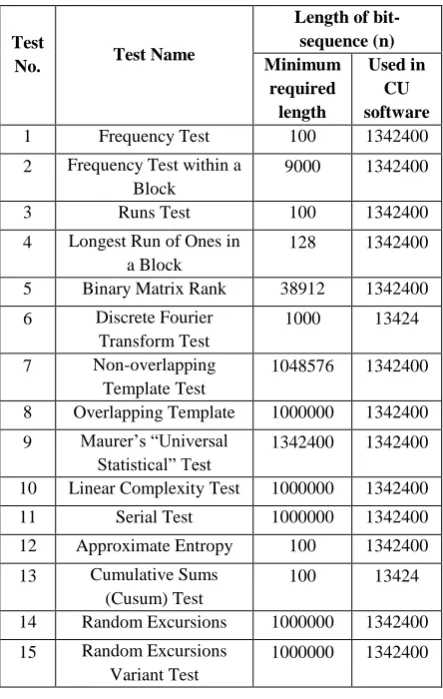
[image:2.595.319.541.255.605.2]The fifteen tests included in module-3 are not described here in detail - the interested reader can go through [17-21]. The test numbers with name of the fifteen tests are given in Table 1 where the minimum length of bit-sequence required for a particular test is also mentioned following the NIST guideline.
Table 1. Minimum required lengths and used lengths of bit-sequence for different tests
Each test provides one or more P-value(s) as a statistical measure for each of 300 bit sequences generated by an algorithm. From P-values of a particular test, one can estimate the Observed Proportion of Passing (OPOP) and compare it with the T-value given in eq.(2). The distribution pattern of P-values is estimated from the P-value of P-values (POP) given in eq.(3). These two parameters are considered as the quantitative measures of degree of randomness of the concerned algorithm. The T-value depends on the number of P-values generated by a particular test; hence it differs from test to test. Tests 1 through 10 and 12 have one P-value, tests 11 and 13 both have two P-values, Test 14 has eight, test 15 has eighteen. In respect to a test, all P-values of the sequences
Test
No. Test Name
Length of bit-sequence (n) Minimum
required length
Used in CU software
1 Frequency Test 100 1342400
2 Frequency Test within a Block
9000 1342400
3 Runs Test 100 1342400
4 Longest Run of Ones in a Block
128 1342400
5 Binary Matrix Rank Test
38912 1342400
6 Discrete Fourier Transform Test
1000 13424
7 Non-overlapping Template Test
1048576 1342400
8 Overlapping Template Test
1000000 1342400
9 Maurer’s “Universal Statistical” Test
1342400 1342400
10 Linear Complexity Test 1000000 1342400
11 Serial Test 1000000 1342400
12 Approximate Entropy Test
100 1342400
13 Cumulative Sums (Cusum) Test
100 13424
14 Random Excursions Test
1000000 1342400
15 Random Excursions Variant Test
will be considered uniformly distributed between 0 and 1, if POP ≥ 0.0001.
Observed Proportion of Passing (OPOP) of a test based on P-values: To observe the Proportion of Passing of a test, it is necessary to consider large number of samples of sequences generated by an algorithm. If m samples of bit-sequences obtained from an algorithm are tested by a test producing one P-value, then a statistical threshold value (T-value) would be,
m
T
value
(
1
)
3
(
1
)
(2)where significance level (α) = 0.01. The size of m should be greater than inverse of α. If m = 300, T-value = 0.972766. This means that such a test is considered to be statistically successful, if at least 292 P-values out of the 300 P-values do pass the test. If any test produced n number of P-values, then to calculate T-value in eq.(2), one should consider m×n instead of m. With same values of α and m, the T-value is 0.983907 for n = 8 (tests 14). Such a test is considered statistically successful if at least 2362 P-values out of the total 300×8 = 2400 P-values do pass the test.
Distribution pattern of P-values and Estimation of P-value of P-values (POP): The concept of distribution pattern
of
P-values is mentioned in [17-18]. It calculates the POP, where it is stated that P-values for a particular test can be considered uniformly distributed, if it’s POP ≥ 0.0001. For computing POP, χ2 is calculated as
101
2
2
10
10
i i
m
m
s
,
where, Si is the number of P-values in sub-interval i, and m is the sample size. If any test produced n number of P-values, then m = n×(number of files calculated). Here the degrees of freedom K = 9. Two parameters are a = K/2 and x = χ2/2 and the corresponding POP is calculated as,
)
,
(
)
,
(
1
a
x
a
POP
(3)3.
RC4, PM and BBS ALGORITHMS
In reality, there is no algorithm to produce pure random bits or numbers. All mathematical algorithms have deterministic features and the output sequences produced by them are not expected to be statistically random - at best can be called pseudorandom. There are different types of pseudorandom generators, e.g. Linear Congruential, Quadratic Congruential, etc. A Linear Congruential generator, a Quadratic one along with RC4 is discussed in this Section.
3.1
RC4 algorithm
The RC4 involves an idea coined by Knuth [22] which states that a series of 8-bit random numbers can suitably be generated if number elements of a reasonably large linear matrix are randomly shuffled for a number of times. Ronald Rivest translated the concept in two stages, Key Scheduling Algorithm (KSA) and Pseudorandom Generator Algorithm (PRGA). In KSA an identity S-Box is chosen with indices as element values. The element values are shuffled 256 times within fixed indices considering a role of the given key in the shuffle. In PRGA, two elements are randomly chosen, modulo added to give 8-bit random key and then swapped – the
infinite continuation of the process generates a stream of 8-bit p-sequence.
3.2
Park-and-Miller (PM) algorithm
The Park-and-Miller proposed a linear congruential algorithm [15] to generate sequence of floating-point random numbers (fprn) between 0 and 1. The algorithm can be stated as, seedi+1 = A × seedi % M (4a) fprn = seedi+1 / M (4b) where M is chosen as a large 32-bit positive integer, (231 – 1) = 2147483647, a prime number and A is considered as a large integer (16807) less than square root of M (A < √M).
The algorithm involves choice of an initial non-zero seed number (seed0). The seed is continuously upgraded by the remainder obtained by dividing (A×seed) by M. If seed0 is zero, all remainders become zero and the algorithm fails. There is another problem - while multiplying A with seed, the product may not fit into the 32-bit computer memory and the algorithm may fail due to the storage problem. A technique is presented in [23] following Schrage [24,25] to handle the memory overflow problem. The coding is shown below in PMB block:
PMB block: Q = M / A; R = M % A; k = seed / Q; r = seed % Q;
if ((A×r – k×R) ≥ 0) seedi+1 = (A×r – k×R); otherwise, seedi+1 = M + (A×r – k×R);
The PM algorithm generates non-repeating integral seeds between 0 and M, if and only if the initial seed is non-zero positive integer less than M. In order that 0 is accepted as an initial seed, XOR operation between seed and an arbitrary integer (MASK) is introduced before and after the PMB block [23]. The code then looks like,
seed = seed^MASK; PMB block seed = seed^MASK;
The above algorithm may also fail, if MASK happens to be an initial seed or an intermediate seed. One can handle such an eventuality using the following code instead of the previous one,
if(seed != MASK) seed = seed^MASK; PMB block
seed = seed^MASK;
Considering the innovation proposed in the coding of the PM algorithm, the symbolic code narrated above is sound and shall accept any seed including zero.
3.2.1
PM with Small multiplier (PM-S)
To get an 8-bit random integer key with small multiplier, a 16-bit multiplier is used in eq.(4b) as,
key = (fprn× multiplier) % 256
This way, an 8-bit p-sequence is produced in each iteration using small multiplier.
3.2.2
PM with Large multiplier (PM-L)
To get an 8-bit random integer key with large multiplier, the M itself is virtually used as 32-bit multiplier in eq.(4b) as,
seedi+1 = A × seedi % M key = seedi+1 % 256
3.3
BBS Algorithm
The Blum Blum Shub (BBS) algorithm is a popular and well known pseudorandom bit generator. It is considered that BBS generator is a cryptographically secured PRBG and provides pseudorandom bit stream [13,14]. Brief information of this generator along with its security is as follows:
Let p and q be two prime numbers and both are congruent to 3 modulo 4, that is,
p ≡ q ≡ 3 (mod 4) (5) Now,
n = p × q (6) Let s is a randomly chosen seed number relatively prime to n indicating that neither p nor q is a factor of s. A stream of BBS bits bi will be produced using the following algorithm:
X0 = s2 mod n; for i = 1 to ∞
Xi = (Xi–1)2 mod n; bi = Xi mod 2;
In each iteration, the LSB is considered as a random key bit. The computational approach of this algorithm is very simple and is easy to implement in software as well as in hardware. There is some evidence that the BBS generator has provable security [16]. But it is considered as a slow algorithm, since it produces only one bit at a time. To make it faster, it is proved that r bits can be extracted at a time if r ≤ log2log2(n) where n is the modulus used in the algorithm [14]. The generator will be faster if r ≥ 2. Now let, one intends to extract 4 bits in each iteration, n ≥ = 216 = 65536. In this paper two sets of p and q given in eq.(6) are considered for statistical tests – for the first set n is small with p = 131, q = 499 and for the second set n is large with p = 42839 and q = 50123.
3.3.1
BBS-1S
In BBS-1S, the smaller value of n is obtained by considering prime values of p = 131 and q = 499 in eq.(6) and one LSB bit is extracted in one cycle from the upgraded seed.
3.3.2
BBS-3S
In BBS-3S, the smaller value of n is chosen as is being done in BBS-1S by considering prime values of p = 131 and q = 499 in eq.(6) and three LSB bits are extracted in one cycle from an upgraded seed in succession of 3 steps.
3.3.3
BBS-1L
In BBS-1L, the larger value of n is obtained by considering prime values of p = 42839 and q = 50123 in eq.(6) and one LSB bit is extracted in one cycle from an upgraded seed.
3.3.4
BBS-4L
In BBS-4L, the larger value of n is obtained by considering prime values of p = 42839 and q = 50123 in eq.(6) and four LSB bits are extracted in one cycle from an upgraded seed in succession of 4 steps.
4.
RESULT AND DISCUSSION
Based on the three algorithms discussed in Section 3, seven set of data each having 300 bit-sequences are generated. The data set are named as: RC4, PM-S, PM-L, BBS-1S, BBS-3S, BBS-1L and BBS-4L and these are discussed respectively in sections 3.1, 3.2.1, 3.2.2, 3.3.1, 3.3.2, 3.3.3 and 3.3.4. The results obtained by the three test modules are discussed in sections 4.1, 4.2 and 4.3 respectively.
4.1
Result of Test Module-1
[image:4.595.326.528.188.470.2]Seven set of data each having 300 bit sequences are tested by Module-1. For a particular algorithm the best and worst values of σ calculated by eq.(1) are shown in Table 2 along with the Proportion of Passing obtained from the probability of occurrence of 8-bit value. It is seen from Table 2 that, the value of σ for data set BBS-1S and BBS-3S is always higher than 0.1024 for both the frequency test and block frequency test. The results of other data sets are satisfactory.
Table 2. The value of σ in Test Module-1
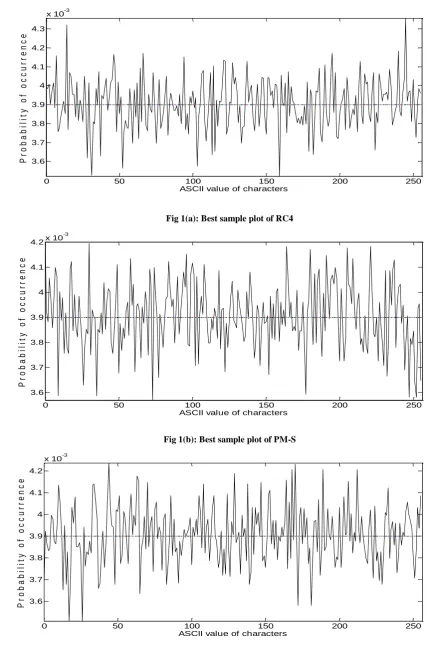
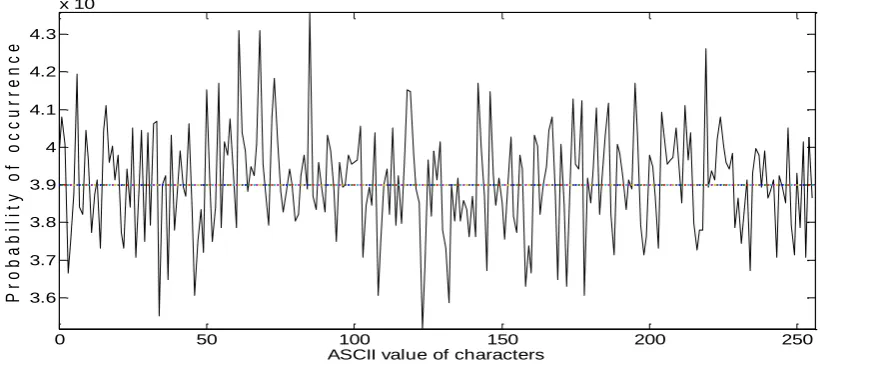
Of each set of the seven sets, the sequence with least value of σ (best sequence) are also graphically shown in Figs. 1(a) through 1(g) of Appendix A using MATLAB, where 8-bit ASCII value of each characters are plotted in x-axis and their frequency of occurrences in y-axis. The Figs. 1(d) and 1(e) corresponds to BBS-1S and BBS-3S respectively and for both the probability of occurrences of each 8-bit value are seen to lie within 0 and 2×10⁻² – all are not distributed randomly and uniformly centering around 3.9×10⁻³. For other sets, the values are within the range of 0.0039 ± 0.0004. Hence one can conclude that BBS-1S and BBS-3S do not satisfy the random properties and can be declared as non-random.
4.2
Result of Test Module-2
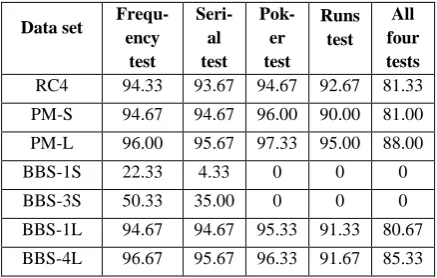
In this module, the passing criterion for each test is set at 90% while it is set at 80% for all the four tests together. Though the results of BBS-1S and BBS-3S do not satisfy the random properties under test module-1; yet these are considered here with a view to see their results with the test module-2. Hence, module-2 considers the same seven data sets as in module-1. The results of four tests executed on data of seven sets are noted in columns 2 through 5 of Table 3 depicting test-wise percentage of passing data. The last column indicates the percentage of simultaneously passing data of all the four tests. The criterion of percentage of passing a test has been mentioned in Section 2.2. It is seen from Table 3 that BBS-1S and BBS-3S are unsatisfactory. For all the other five sets, the results are satisfactory. Hence, as per the results of module-2,
Data set Best
value
Worst value
Passing Proportion Result of frequency test: Sequence length 166400 characters
RC4 0.0339195
6
0.0442959 4
100.00
PM-S 0.0334897 1
0.0438840 9
100.00
PM-L 0.0339922
5
0.0446135 2
100.00
BBS-1S 1.273882 15.96872 0.00
BBS-3S 0.7244467 9.183318 0.00
BBS-1L 0.0341972
6
0.0445378 1
100.00
BBS-4L 0.0349984
2
0.0445548 3
100.00
Result of block frequency test: Block length 33280 characters
RC4 0.0857523
1
0.1013203 100.00
PM-S 0.0853362 0
0.1004934 100.00
PM-L 0.0850295
8
0.1021745 100.00
BBS-1S 1.274072 15.96872 0.00
BBS-3S 0.7247481 9.183318 0.00
BBS-1L 0.0853172
4
0.1014229 100.00
BBS-4L 0.0842951
8
both the BBS-1S and BBS-3S can be declared as non-random. These two are not considered in test module-3.
Table 3. Percentage of passing in Test Module-2
4.3
Result of Test Module-3
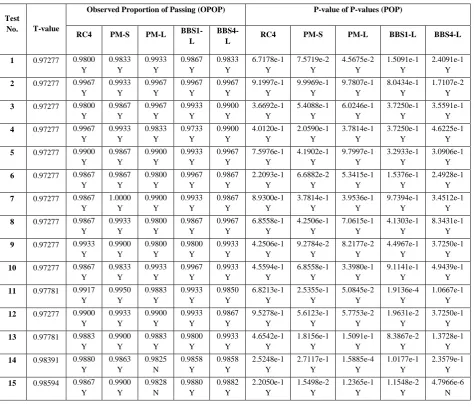
In Module-3 five algorithms, namely, RC4, PM-S, PM-L, BBS-1L and BBS-4L each having 300 bit sequences are tested. For all the five algorithms, the P-value data of all the 15 tests are presented in Tables 4(a) through 4(e). If P-value < 0.01, then it will be considered as unsuccessful. In Tables 4, column C0 indicates test number and the P-value data for a particular test are shown being divided in 11 groups, C1 to C11. The ranges of groups are C1: 0.00 – 0.01, C2: 0.01 – 0.1, C3: 0.1 – 0.2, C4: 0.2 – 0.3, C5: 0.3 – 0.4, C6: 0.4 – 0.5, C7: 0.5 – 0.6, C8: 0.6 – 0.7, C9: 0.7 – 0.8, C10: 0.8 – 0.9, and C11: 0.9 – 1.0. The Observed Proportion of Passing for a particular test is the ratio of sum of the last ten columns (C2 to C11) to the total sum of eleven columns (C1 – C11). For each test, the Observed Proportion of Passing (OPOP) of all the 300 sequences is estimated and presented in Table 5 and if OPOP ≥ T-value, a particular test is considered as being passed. The distribution pattern of P-values is estimated through P-value of P-values (POP) following the mathematical equations given in eq.(3). The P-values are uniformly distributed if POP ≥ 0.0001. In OPOP column Y/N indicates the successful/unsuccessful in Observed Proportion of passing and in POP column Y/N indicates the uniformity/non-uniformity of distribution of P-values. From various observations on test results, it is also understood that P-values are more uniformly distributed if POP is larger. The OPOP and POP are the two checking parameters measuring the degree of randomness of an algorithm.
Regarding the uniformity or non-uniformity distribution of P-values, one can correlate the POP value shown in Table 5 with a corresponding visual histogram obtained from the right data of the tables of Table 4. From Table 5, the test 2 of PM-S is seen as the best POP obtained from the test 2 data shown in Table 4(b) – the same data is displayed in a corresponding histogram in Fig. 2(a) of Appendix B. The uniformity of the P-value distribution is visually evident. The worst POP is the test 15 of BBS-4L (vide Table 5). The corresponding data from test 15 of Table 4(e) is displayed in another histogram in Fig. 2(b) of the same Appendix. The histogram shows non-uniform distribution of P-values. In both the histograms, there are ten columns: first column indicates the number of P-values lying between 0 and 0.1; second column indicates the number of P-values lying between 0.1 and 0.2, so on and so forth. It may be noted that the test 2 has 300 P-values for 300 sequences, while the test 15 has 5400 P-values for 300 sequences. For paucity of space, the number of P-values for test 15 above 300 is shown in the ordinate axis of Fig. 2(b).
Table 4(a). Frequency distribution of P-values in RC4
C0|C1| C2 | C3 | C4 | C5 | C6 | C7 | C8 | C9 |C10 |C11 1| 6 | 24 | 29 | 33 | 38 | 26 | 36 | 32 | 24 | 25 | 27 2| 1 | 27 | 32 | 31 | 33 | 32 | 31 | 26 | 26 | 25 | 36 3| 6 | 24 | 29 | 31 | 32 | 25 | 17 | 35 | 32 | 38 | 31 4| 1 | 36 | 39 | 30 | 23 | 29 | 28 | 30 | 21 | 34 | 29 5| 3 | 27 | 26 | 33 | 40 | 32 | 27 | 25 | 27 | 31 | 29 6| 4 | 19 | 43 | 29 | 26 | 28 | 27 | 35 | 37 | 25 | 27 7| 4 | 25 | 28 | 29 | 28 | 37 | 27 | 34 | 32 | 32 | 24 8| 4 | 29 | 30 | 28 | 28 | 24 | 37 | 38 | 29 | 25 | 28 9| 2 | 23 | 30 | 24 | 25 | 43 | 31 | 29 | 28 | 33 | 32 10| 4 | 29 | 26 | 34 | 29 | 39 | 21 | 28 | 24 | 32 | 34 11| 5 | 60 | 70 | 62 | 56 | 49 | 51 | 65 | 63 | 62 | 57 12| 3 | 26 | 38 | 31 | 30 | 27 | 26 | 31 | 31 | 29 | 28 13| 7 | 54 | 61 | 61 | 44 | 57 | 71 | 55 | 70 | 58 | 62 14| 29 | 216 | 236 | 248 | 246 | 263 | 252 | 233 | 254 | 207 | 216 15| 72 | 474 | 543 | 573 | 558 | 561 | 530 | 568 | 503 | 522 | 496
Table 4(b). Frequency distribution of P-values in PM-S
C0|C1| C2 | C3 | C4 | C5 | C6 | C7 | C8 | C9 |C10 |C11 1| 5 | 25 | 25 | 24 | 21 | 29 | 40 | 36 | 41 | 22 | 32
2| 2 | 28 | 30 | 32 | 32 | 29 | 30 | 30 | 28 | 32 | 27 3| 4 | 27 | 39 | 28 | 23 | 36 | 35 | 26 | 26 | 29 | 27 4| 2 | 24 | 23 | 25 | 36 | 32 | 22 | 29 | 30 | 42 | 35 5| 4 | 19 | 26 | 37 | 38 | 35 | 26 | 30 | 26 | 34 | 25 6| 4 | 27 | 36 | 31 | 23 | 28 | 21 | 38 | 42 | 20 | 30 7| 0 | 30 | 19 | 35 | 33 | 30 | 40 | 31 | 27 | 25 | 30 8| 2 | 20 | 39 | 32 | 24 | 31 | 33 | 29 | 25 | 28 | 37 9| 3 | 22 | 29 | 22 | 48 | 32 | 32 | 26 | 30 | 29 | 27 10| 5 | 23 | 30 | 33 | 29 | 39 | 33 | 25 | 33 | 23 | 27 11| 3 | 49 | 60 | 53 | 60 | 54 | 51 | 66 | 69 | 57 | 78 12| 2 | 26 | 36 | 21 | 28 | 27 | 26 | 34 | 31 | 31 | 38 13| 6 | 66 | 68 | 72 | 58 | 56 | 61 | 43 | 57 | 51 | 62 14| 33 | 207 | 215 | 219 | 266 | 242 | 242 | 268 | 239 | 229 | 240 15| 54 | 441 | 575 | 539 | 561 | 598 | 550 | 527 | 482 | 549 | 524
Table 4(c). Frequency distribution of P-values in PM-L
C0|C1| C2 | C3 | C4 | C5 | C6 | C7 | C8 | C9 |C10 |C11 1| 2 | 20 | 32 | 28 | 25 | 32 | 37 | 27 | 31 | 46 | 20 2| 1 | 26 | 29 | 32 | 30 | 31 | 30 | 29 | 28 | 27 | 37 3| 1 | 26 | 41 | 29 | 33 | 31 | 30 | 32 | 23 | 25 | 29 4| 5 | 23 | 22 | 35 | 25 | 33 | 27 | 31 | 42 | 27 | 30 5| 3 | 28 | 30 | 29 | 37 | 28 | 27 | 28 | 28 | 30 | 32 6| 6 | 26 | 31 | 27 | 29 | 38 | 24 | 36 | 34 | 27 | 22 7| 3 | 26 | 32 | 21 | 30 | 23 | 28 | 30 | 39 | 30 | 38 8| 6 | 32 | 29 | 29 | 22 | 32 | 25 | 27 | 33 | 33 | 32 9| 6 | 16 | 42 | 30 | 26 | 33 | 39 | 33 | 26 | 30 | 19 10| 2 | 31 | 32 | 22 | 40 | 31 | 30 | 21 | 25 | 34 | 32 11| 7 | 61 | 49 | 63 | 80 | 58 | 54 | 46 | 70 | 51 | 61 12| 3 | 30 | 21 | 30 | 47 | 29 | 23 | 28 | 35 | 24 | 30 13| 7 | 51 | 64 | 71 | 63 | 61 | 54 | 69 | 68 | 52 | 40 14| 42 | 260 | 264 | 220 | 231 | 213 | 252 | 259 | 216 | 236 | 207 15| 93 | 487 | 558 | 557 | 568 | 501 | 544 | 545 | 502 | 544 | 501
Data set
Frequ-ency test
Seri-al test
Pok-er test
Runs test
All four tests RC4 94.33 93.67 94.67 92.67 81.33
PM-S 94.67 94.67 96.00 90.00 81.00
PM-L 96.00 95.67 97.33 95.00 88.00
BBS-1S 22.33 4.33 0 0 0
BBS-3S 50.33 35.00 0 0 0
BBS-1L 94.67 94.67 95.33 91.33 80.67
Table 4(d). Frequency distribution of P-values in BBS-1L
C0|C1| C2 | C3 | C4 | C5 | C6 | C7 | C8 | C9 |C10 |C11 1| 4 | 21 | 19 | 27 | 24 | 33 | 27 | 37 | 36 | 32 | 40 2| 1 | 25 | 23 | 29 | 27 | 34 | 35 | 30 | 28 | 36 | 32 3| 2 | 20 | 27 | 30 | 31 | 31 | 44 | 28 | 27 | 28 | 32 4| 8 | 16 | 39 | 25 | 28 | 26 | 33 | 40 | 26 | 28 | 31 5| 2 | 25 | 37 | 30 | 25 | 31 | 21 | 33 | 23 | 36 | 37 6| 1 | 23 | 38 | 28 | 27 | 35 | 18 | 36 | 37 | 32 | 25 7| 2 | 29 | 34 | 31 | 28 | 27 | 33 | 26 | 27 | 29 | 34 8| 4 | 28 | 24 | 28 | 39 | 22 | 36 | 24 | 34 | 30 | 31 9| 6 | 32 | 34 | 27 | 35 | 27 | 23 | 23 | 26 | 35 | 32 10| 1 | 33 | 29 | 24 | 27 | 29 | 33 | 28 | 32 | 36 | 28 11| 4 | 25 | 53 | 64 | 58 | 66 | 47 | 73 | 69 | 60 | 81 12| 2 | 12 | 24 | 32 | 31 | 29 | 21 | 36 | 38 | 37 | 38 13| 12 | 54 | 77 | 56 | 51 | 65 | 73 | 59 | 53 | 45 | 55 14| 34 | 245 | 241 | 242 | 227 | 215 | 262 | 251 | 220 | 236 | 227 15| 65 | 427 | 492 | 485 | 555 | 573 | 569 | 546 | 568 | 566 | 554
Table 4(e). Frequency distribution of P-values in BBS-4L
C0|C1| C2 | C3 | C4 | C5 | C6 | C7 | C8 | C9 |C10 |C11 1| 5 | 17 | 33 | 33 | 30 | 33 | 41 | 24 | 29 | 21 | 34 2| 1 | 17 | 30 | 31 | 33 | 25 | 26 | 28 | 23 | 46 | 40 3| 3 | 33 | 35 | 30 | 27 | 30 | 35 | 21 | 37 | 22 | 27 4| 3 | 21 | 34 | 30 | 38 | 26 | 20 | 32 | 30 | 35 | 31 5| 1 | 31 | 31 | 25 | 28 | 24 | 43 | 34 | 33 | 24 | 26 6| 4 | 33 | 36 | 28 | 36 | 34 | 24 | 29 | 32 | 18 | 26 7| 4 | 23 | 35 | 32 | 34 | 25 | 23 | 34 | 40 | 27 | 23 8| 1 | 28 | 27 | 32 | 28 | 32 | 35 | 23 | 28 | 37 | 29 9| 2 | 27 | 30 | 38 | 23 | 36 | 25 | 26 | 28 | 26 | 39 10| 2 | 27 | 28 | 30 | 35 | 42 | 32 | 25 | 28 | 27 | 24 11| 9 | 51 | 38 | 69 | 54 | 61 | 66 | 60 | 53 | 69 | 70 12| 4 | 24 | 20 | 35 | 28 | 34 | 40 | 25 | 27 | 30 | 33 13| 4 | 38 | 52 | 67 | 51 | 66 | 68 | 65 | 72 | 55 | 62 14| 34 | 233 | 220 | 234 | 228 | 269 | 240 | 238 | 219 | 252 | 233 15| 64 | 479 | 517 | 525 | 508 | 507 | 458 | 545 | 596 | 568 | 633
Table 5. Observed Proportion of Passing (OPOP) and P-value of P-values (POP) in Test Module-3
Test
No. T-value
Observed Proportion of Passing (OPOP) P-value of P-values (POP)
RC4 PM-S PM-L BBS1-L
BBS4-L RC4 PM-S PM-L BBS1-L BBS4-L
1 0.97277 0.9800
Y 0.9833 Y 0.9933 Y 0.9867 Y 0.9833 Y 6.7178e-1 Y 7.5719e-2 Y 4.5675e-2 Y 1.5091e-1 Y 2.4091e-1 Y
2 0.97277 0.9967
Y 0.9933 Y 0.9967 Y 0.9967 Y 0.9967 Y 9.1997e-1 Y 9.9969e-1 Y 9.7807e-1 Y 8.0434e-1 Y 1.7107e-2 Y
3 0.97277 0.9800
Y 0.9867 Y 0.9967 Y 0.9933 Y 0.9900 Y 3.6692e-1 Y 5.4088e-1 Y 6.0246e-1 Y 3.7250e-1 Y 3.5591e-1 Y
4 0.97277 0.9967
Y 0.9933 Y 0.9833 Y 0.9733 Y 0.9900 Y 4.0120e-1 Y 2.0590e-1 Y 3.7814e-1 Y 3.7250e-1 Y 4.6225e-1 Y
5 0.97277 0.9900
Y 0.9867 Y 0.9900 Y 0.9933 Y 0.9967 Y 7.5976e-1 Y 4.1902e-1 Y 9.7997e-1 Y 3.2933e-1 Y 3.0906e-1 Y
6 0.97277 0.9867
Y 0.9867 Y 0.9800 Y 0.9967 Y 0.9867 Y 2.2093e-1 Y 6.6882e-2 Y 5.3415e-1 Y 1.5376e-1 Y 2.4928e-1 Y
7 0.97277 0.9867
Y 1.0000 Y 0.9900 Y 0.9933 Y 0.9867 Y 8.9300e-1 Y 3.7814e-1 Y 3.9536e-1 Y 9.7394e-1 Y 3.4512e-1 Y
8 0.97277 0.9867
Y 0.9933 Y 0.9800 Y 0.9867 Y 0.9967 Y 6.8558e-1 Y 4.2506e-1 Y 7.0615e-1 Y 4.1303e-1 Y 8.3431e-1 Y
9 0.97277 0.9933
Y 0.9900 Y 0.9800 Y 0.9800 Y 0.9933 Y 4.2506e-1 Y 9.2784e-2 Y 8.2177e-2 Y 4.4967e-1 Y 3.7250e-1 Y
10 0.97277 0.9867
Y 0.9833 Y 0.9933 Y 0.9967 Y 0.9933 Y 4.5594e-1 Y 6.8558e-1 Y 3.3980e-1 Y 9.1141e-1 Y 4.9439e-1 Y
11 0.97781 0.9917
Y 0.9950 Y 0.9883 Y 0.9933 Y 0.9850 Y 6.8213e-1 Y 2.5355e-1 Y 5.0845e-2 Y 1.9136e-4 Y 1.0667e-1 Y
12 0.97277 0.9900
Y 0.9933 Y 0.9900 Y 0.9933 Y 0.9867 Y 9.5278e-1 Y 5.6123e-1 Y 5.7753e-2 Y 1.9631e-2 Y 3.7250e-1 Y
13 0.97781 0.9883
Y 0.9900 Y 0.9883 Y 0.9800 Y 0.9933 Y 4.6542e-1 Y 1.8156e-1 Y 1.5091e-1 Y 8.3867e-2 Y 1.3728e-1 Y
14 0.98391 0.9880
Y 0.9863 Y 0.9825 N 0.9858 Y 0.9858 Y 2.5248e-1 Y 2.7117e-1 Y 1.5885e-4 Y 1.0177e-1 Y 2.3579e-1 Y
15 0.98594 0.9867
5.
CONCLUSION
Among the three test modules, the test module-3 is the most important. It has been possible to discard the BBS-1S and BBS-3S based on test modules 1 and 2 without trying on it the test module-3. Based on the results obtained from all the three modules, one can conclude that the Park-and-Miller algorithm provides good 8-bit random sequences and can be used in stream ciphers. From Table 5, one notices that PM-L has two “N” for test 14 and 15, although numerical values are very close to the thresholds. Moreover, it has uniform distribution of P-values for all the fifteen tests. Hence PM can be considered as random. On the other side, for BBS-4L, the distribution of P-values in test 15 is not uniform, though it well satisfies the Observed Proportion of Passing criteria. Considering the overall result, BBS-4L can also be treated as random. The RC4, PM-S and BBS-1L have very good result for all tests of each of the three test modules. From the observations on test-results, one can mark two points. The first – if modulus in BBS is larger, it exhibits better randomness and extraction of 4-bits at a time from BBS algorithm using 32-bit modulus would give good randomness. The second one – the Park-and-Miller algorithm is good for both small and large multipliers. Based on these statistical tests it is proved that, RC4, PM and BBS with large modulus are secured from the statistical point of view. Hence these can be used in stream ciphers.
6.
ACKNOWLEDGMENTS
The authors are grateful to the UGC, New Delhi for providing financial support to the first author, Mr. J K M Sadique Uz Zaman. The cooperation and supports extended by the Head of the Department is also greatly appreciated. In connection to test module-1 the various discussions held with Mr. Sangeet Saha, Research Scholar at AKCSIT, University of Calcutta is a pleasure to acknowledge.
7.
REFERENCES
[1] A. Menezes, P. van Oorschot, S. Vanstone, Handbook of Applied Cryptography (CRC Press, 1996) 169-190.
[2] S. Maitra, G. Paul, Analysis of RC4 and proposal of additional layers for better security margin, Proc. Indocrypt, 2008, IIT Kharagpur, LNCS 5365, 27-39.
[3] S. Paul, B. Preneel, A New Weakness in the RC4 Keystream. Generator and an Approach to Improve the Security of the Cipher, Proc. Fast Software Encryption, 2004, Berlin, LNCS 3017, 245-259.
[4] S. Fluhrer, I. Mantin, A. Shamir, Weakness in the Key Scheduling Algorithm of RC4, Proc. Int. Workshop on Selected Areas in Cryptography, 2001, Toronto, LNCS 2259, 1-24.
[5] I. Mantin, A. Shamir, A Practical Attack on Broadcast RC4, Proc. Fast Software Encryption, 2001, Japan, LNCS 2355, 152-164.
[6] S. Fluhrer, D. McGrew, Statistical Analysis of the Alleged RC4 Key Stream Generator, Proc. Fast Software Encryption, 2000, New York, LNCS 1978, 19-30.
[7] L. Knudsen, et al., Analysis Method for Alleged RC4, Proc. ASIACRYPT, 1998, Beijing, LNCS 1514, 327-341.
[8] S. Mister, S. Tavares, Cryptanalysis of RC4-Like Ciphers, Proc. Int. Workshop on Selected Areas in Cryptography, 1998, Canada,LNCS 1556, 131-143.
[9] S.S. Gupta, K. Sinha, S. Maitra, B.P. Sinha, One Byte per Clock: A Novel RC4 Hardware, Proc. Indocrypt, 2010, Hyderabad, LNCS 6498, 347-363.
[10] P. Kitsos, G. Kostopoulos, N. Sklavos, O. Koufopavlou, Hardware Implementation of the RC4 stream Cipher, Proc. 46th IEEE Midwest Symposium on Circuits & Systems, 2003, Cairo, Vol.3, 1363-1366.
[11] D.P. Matthews, Jr. System and method for a fast hardware implementation of RC4, US Patent No. 6549622, Campbell, CA, April 2003.
[12] R. Paul, S. Saha, JKM.S. Zaman, S. Das, A. Chakrabarti, R. Ghosh, A Simple 1-byte 1-clock RC4 hardware design and its implementation in FPGA coprocessor for secured Ethernet communication, Proc. National Workshop on Cryptology, 2012, India, 61-70.
[13] W. Stallings, Cryptography and Network Security (Delhi, Pearson Education, 4th Edition, 2008).
[14] L. Blum, M. Blum, M. Shub, A Simple Unpredictable Pseudo-Random Number Generator, SIAM Journal on Computing, 15(2), 1986, 364-383.
[15] S. K. Park, K. W. Miller, Random Number Generators: Good ones are hard to find, Communications of the ACM, 31(10), 1988, 1192 – 1201.
[16] D.R. Stinson, Cryptography Theory and Practice (Boca Raton, Chapman & Hall, CRC, 3rd Edition, 2006).
[17] JKM. S. Zaman, R. Ghosh, Review on fifteen Statistical Tests proposed by NIST, Journal of Theoretical Physics and Cryptography. 1, 2012, 18-31.
[18] Rukhin A., Soto J., et al, 2010. A Statistical Test Suite for Random and Pseudorandom Number Generators for Cryptographic Applications, NIST, US.
[19] http://csrc.nist.gov/publications/nistpubs/800-22-revla/SP800-22rev1a.pdf
[20] Rukhin A., Soto J., et al, 2008. A Statistical Test Suite for Random and Pseudorandom Number Generators for Cryptographic Applications, NIST, Technology Administration, U.S. Department of Commerce.
[21] http://csrc.nist.gov/groups/ST/toolkit/rng/documentation _software.html
[22] Donald Knuth, The Art of Computer Programming, Seminumerical Algorithms, Volume 2, 3rd edition, Addison Wesley, Reading, Massachusetts, 1998.
[23] W.H. Press, S.A. Teukolsky, W.T. Vetterling, B.P. Flannery, Numerical Recipes in C: The Art of Scientific Computing (New York, Cambridge University Press, 2nd Edition, 1988) 274-328.
[24] L. Schrage, A More Portable Fortran Random Number Generator, ACM Transactions on Mathematical Software, 5(2), 1979, 132-138.
0 50 100 150 200 250 3.6
3.7 3.8 3.9 4 4.1 4.2 4.3
x 10-3
ASCII value of characters
P
r
o
b
a
b
i l
i
t y
o
f
o
c
c
u
r
r
e
n
c
e
Appendix A: Graphical representations showing the best sequences for each data set
Fig 1(a): Best sample plot of RC4
0 50 100 150 200 250 3.6
3.7 3.8 3.9 4 4.1 4.2x 10
-3
ASCII value of characters
P
r
o
b
a
b
i l
i
t y
o
f
o
c
c
u
r
r
e
n
c
e
Fig 1(b): Best sample plot of PM-S
0 50 100 150 200 250 3.6
3.7 3.8 3.9 4 4.1 4.2
x 10-3
ASCII value of characters
P
r
o
b
a
b
i l
i
t y
o
f
o
c
c
u
r
r
e
n
c
e
[image:8.595.86.516.100.747.2] [image:8.595.104.512.109.321.2]0 50 100 150 200 250 0
0.005 0.01 0.015 0.02
ASCII value of characters
P
r
o
b
a
b
i l
i
t y
o
f
o
c
c
u
r
r
e
n
c
e
Fig 1(d): Best sample plot of BBS-1S
0 50 100 150 200 250 0
0.002 0.004 0.006 0.008 0.01 0.012
ASCII value of characters
P
r
o
b
a
b
i l
i
t y
o
f
o
c
c
u
r
r
e
n
c
e
Fig 1(e): Best sample plot of BBS-3S
0 50 100 150 200 250 3.6
3.7 3.8 3.9 4 4.1 4.2
x 10-3
ASCII value of characters
P
r
o
b
a
b
i l
i
t y
o
f
o
c
c
u
r
r
e
n
c
e
[image:9.595.83.529.73.754.2] [image:9.595.72.511.86.273.2] [image:9.595.104.517.419.726.2]0 50 100 150 200 250 3.6
3.7 3.8 3.9 4 4.1 4.2 4.3
x 10-3
ASCII value of characters
P
r
o
b
a
b
i l
i
t y
o
f
o
c
c
u
r
r
e
n
c
e
Appendix B: Histograms for distribution of P-values
Fig 1(g): Best sample plot of BBS-4L
0 5 10 15 20 25 30 35
1 2 3 4 5 6 7 8 9 10
300 350 400 450 500 550 600 650
1 2 3 4 5 6 7 8 9 10
[image:10.595.102.538.87.274.2] [image:10.595.92.290.333.469.2] [image:10.595.324.524.333.469.2]