The Role of Business Intelligence Tools in Decision
Making Process
Mohammad Atwah Al-ma'aitah
Al-balqa Applied University
ABSTRACT
Business organization sheds the lights on the development in marketing to be able to accompaniment with the last even in marketing and to handle market management. The organizations create their own business decisions and operations through using business intelligence justification. Therefore organization can do that through knowledge, and convey the correct information.
As a result, business intelligence becomes the main criterion and the strategic performance in the modern organization to achieve the dominant character. This study will show the impact of using business intelligence strategy on the decision making process by showing a study of the Jordanian customs department.
Keywords:
Business Intelligence, Data Mining, Data warehouse, Decision Making.1.
INTRODUCTION
In the last decade , there are some organizations are deprived from the sharing in the marketing processes, other organization are survived too, and they became expanded to be in the top of the worldwide market and there are some elements affected of them, later on , these elements are adapted with these changes and other are not. The example of these elements is globalizations which changes the whole entire world and make it connected with each other. Therefore the economical stability becomes the challenging factor which creates uncertain environment. Other challenges like the new technology, business complexity politics and government rules which have increased the level of risks. From these points it's clear for us that the organizations have to change their own performances quickly and make the right decision in the right time to overcome these factors.Any construction right decision needs accurate details to adapt with the business solution to increase the level of customers' satisfaction, business performance and promote a successful decision making to avoid any consequences [1]. These days a new technology such as BI system have been developed to enhance organization process through store to analyze and interpreting a big amount of information which need to be transformed to a useful knowledge and used it correctly to reduce the mistakes or avoid them as a whole. This technology helps in business solution and management information system integration which consists of business intelligence techniques and his strategy. [2] [3].
2. LITERATURE REVIEW
Some research workers have been conducted about the business intelligence and how it plays a role in forming the decision making process, many organizations are restricted to
business intelligence tools. They do that because they need to respond quickly for both internal and external environmental forces. these decision have not paid attention to the customers and markets because they don‟t depend on the strong bases, and now a day‟s business intelligence tools become the strong strategies that are fixed and its build up their abilities and performances and follow the decisions that they make[4]. Murugan, Asokan, and Cadambi (2004) express that Business Intelligence tools help organizations to have a successful and loyalty with customers by presenting and showing early decisions to guarantee customers loyalty and admiration too. research workers identify the concept of business intelligence as" a combination of software packages and data storages that enable organizations to collect, storing, retrieving, and analyzing data to quick up their right decisions and improving business processes and their performances too". [5] Williams (2007) presents that business Intelligence tools are the key for business process integration and management. Business intelligence tools are the compound of processes, technology and data which refers to one package (software) which developed to close the gabs and fulfillment of business which need to in a high level of efficiency and effectiveness. Business intelligence tools create business intelligence tools work and support decisions and actions. we should take in to consideration that business intelligence tools work and supporting decisions in all level of managements starting from executive and ending with operational level [6] [7]. Maria (2005) mentioned that the BI tools are not methods that make decision, but they support decision making process and business developmental[8]. Both Powers and Williams (2007) agreed that BI tools lead to right future prediction through creates integration environment that fill gaps among business function and provide specific information which based on historical data. Powers also speaks that BI system is a data which leads driven system more than model driven and the meaning of the whole entire results and predictions which relies on collected and processed data. so the degree of decision characters which based on the accuracy of the collected of data [9]. Petrini and Pozzebon (2008) cited that the BI system depend on historical information which allows the capability of decision. They are studying the BI system from two side's managerial and technical approaches. The managerial approach consists of data generated from external and internal environments. . After that this data is being
processed, analyzing and retrieving again to support semi structured and unstructured decision. The technical approach
2.1 Business Intelligence Concepts
BI system has developed since a long time and this system is under the means of developing that can help the customers to improve their own skills by adding a new proprieties to get the objectives in general and there are many previous researches are conducted in this field. Some people who are belonging to the economy identify the BI as a system which covered the features and objectives. Some definitions are wide and in the same time it belongs to the BI system as a cover of all aspects and other definitions are specific and concrete. Some technical features or managerial aspects have a relation with the BI system The best definition for BI system is "The processes, technologies that they needed to turn data into information, information into knowledge, and knowledge into plans that drive cost-effective business action. Business intelligence encompasses data warehousing, business analytic tools and content management” [13] [14]. The next definition mentioned the sequence of actions which ordered to ascend to go through all stages that the BI tools perform, and it covered the both side, the managerial and the technical concepts of BI system. Another concept of BI system is the process that goes through many stages to meet the desire goals. The stages start from the output to the resource to gather data. Therefore different sources are available in the business to collect data such as, document, reports, comments and interviews, the second stage is to interpreting and analyzing this data to be understood, these two stages are dealing with available data only and no actions to be taken during this stage [15].
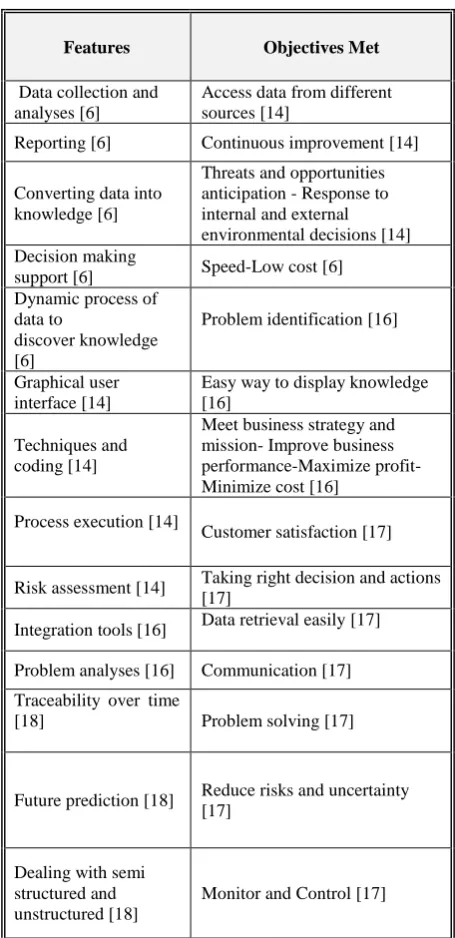
2.2 BI Features and Objectives
[image:2.595.320.548.105.575.2]BI features are closely related to objectives. Needs for certain objectives pushes to add new features to meet these objectives. This statement is clearly explained in the table (1):
Table 1. BI Features and Objectives
Features Objectives Met
Data collection and analyses [6]
Access data from different sources [14]
Reporting [6] Continuous improvement [14]
Converting data into knowledge [6]
Threats and opportunities anticipation - Response to internal and external environmental decisions [14] Decision making
support [6] Speed-Low cost [6] Dynamic process of
data to
discover knowledge [6]
Problem identification [16]
Graphical user interface [14]
Easy way to display knowledge [16]
Techniques and coding [14]
Meet business strategy and mission- Improve business performance-Maximize profit-Minimize cost [16]
Process execution [14]
Customer satisfaction [17]
Risk assessment [14] Taking right decision and actions [17]
Integration tools [16] Data retrieval easily [17] Problem analyses [16] Communication [17] Traceability over time
[18] Problem solving [17]
Future prediction [18] Reduce risks and uncertainty [17]
Dealing with semi structured and unstructured [18]
2.3 Business Intelligence Components
BI components are groups to compose a completely integrated system that works as a backbone to allow organization sustain and to survive with correct response to environmental pressures [19].2.3.1 On-Line Analytical Processing
This part provides us of multidimensional visions of data which are stored in warehouse this part performance many kinds if missions like: Answering complicated queries by interpreting these queries in a significant mode and retrieving the needed data in reports and understandable statements [18]. OLAP gives the user a possibility to access data warehouse. OLAP creates models that make life easier to users to categorize problem in simple forms and shows all variables affect the problem model [20].
2.3.2 Advanced analytics
This part is a superior model of OLAP and it cares more about the future prediction which based on statistics processed and delivered by OLAP. OLAP has advanced analytics features; it deals with complicated problems and vast amount of data [21].
2.3.3 Data Warehouse and Data Mart
This part is acting as a data source that helps BI with historical deep information which is necessary for OLAP to counter complex queries In many researches and studies, data warehouse and data market are different from each other. On the other hand, some researches consider both of them as one. [22].2.3.4 Data Mining
The first role of this part is classifies unstructured data in to levels and categories. The second role is to think in deeply to extract historical data and provide upcoming predictions. In addition data mining used to analyze unorganized data which based on stored data in warehouses and data markets. "Data mining and OLAP have generally the same roles in BI system but the difference is that OLAP generates report with summary and results while data mining is more detailed oriented. It delivers comparisons and statistics" [22] [23].
2.4 Business Intelligence and Decision
Making Process
Decision making process starts from the need to solve the problem by identifying this problem and the variables that
have impact on business functions. The general framework of the decision making process is recommended by Simons who includes four stages, Intelligence, design choice and
implementation [24]. In the operational level the decisions have taken to support a daily basis procedure and to meet operational level strategies and objectives. The strategies at the operational level are the input for middle management level. At the same time at the middle management level, decisions made to predict future forecast of resources and efficient allocation of these resources. At the executive level, strategic decisions are being made to meet business objectives and to assure validation and verification of these decisions [21] [22]. BI system and components play a major role in decision making process. Each component has a direct impact on decision making in a varied technique. The following table shows the utilization and the benefits of BI components for decision making:
Table 2. BI components and benefits
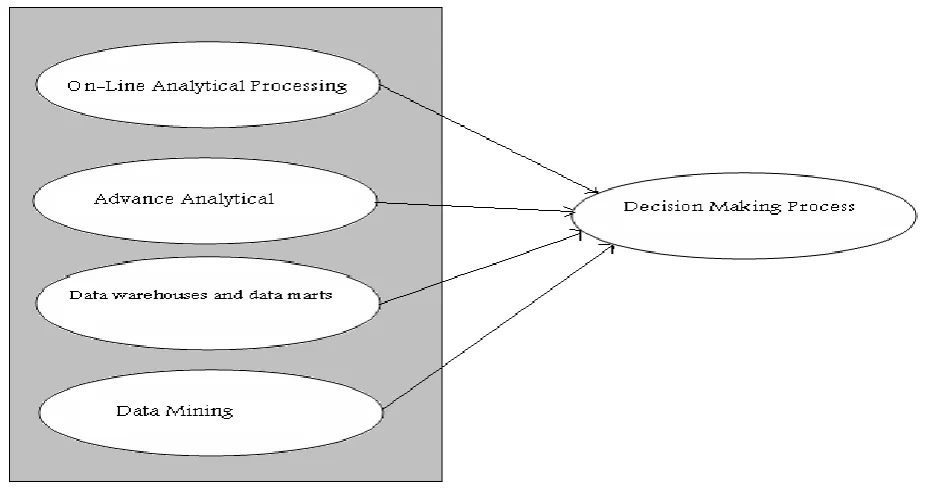
3. Research Model
Depending on the theoretical background above we proposed the following model:
BI component Benefits and impacts on decision making
On-Line Analytical Processing
Analyze huge amount of data from different sources
Data models
Reports and conclusion generation[21]
Advance Analytical
Analyze huge amount of data from different sources
Data models
Statistical reports [23]
Data warehouses and data marts
Storage for huge amount of data Input for using OLAP techniques Provides multidimensional view of data [20]
Data Mining
Detailed reports
Fig 1. Research Model
3.1 Study Hypotheses:
Based on the previous model and the literature review, the following research hypotheses were proposed:
HA1: There is a significant positive effect of On-Line Analytical Processing on decision making process in Jordanian Custom at level ( 0.05).
HA2: There is a significant positive effect of Advance Analytical on decision making process in Jordanian Custom at level ( 0.05).
HA3: There is a significant positive effect of Data warehouses and data marts on decision making process in Jordanian Custom at level ( 0.05).
HA4: There is a significant positive effect of Data Mining on decision making process in Jordanian Custom at level ( 0.05).
4. Research Methodology
To achieve these goals on this research we have to apply a few research hypotheses on a sample like Jordanian customs because it considered on the of the top and most important sample in this research and it would applied in other place in Jordan , the qualitative and quantitative methods are used in this research ,the researcher of this research visit the customs department and conducted some important interviews with people who are deal with this department itself, ( head of department, different sections, and divisions), furthermore these important information and documents were acquired from the IT department about the most important BI tools which used and how it was utilized. Some result of this
method will present in the following section, later on the 160 questionnaires were distributed within the main center and unit's border and the results will show in section 2.
4.1 Section 1: Case Study of the Jordanian
Customs Department
This part of the article discusses how Jordanian customs department using BI tools and how it promote their activities customs implementation of the data warehouse as envisaged by Realsoft architects composed of asset of business components/departmental data market which represent some organizational departments and sections in customs. This departments/process has been identified by Customs as the target of the BI implementations as shown in fig (2).
Fig 2. Business Components
[image:4.595.317.538.539.654.2]4.1.1 Declarations (Risk, Planning)
For the risk and selectivity BI subject areas, the data sources are limited to the Asycuda system and to the custom‟s declarations in particular and the Cases system.
4.1.2 Budgeting and Finance
Following are the benefits of using this approach:- Centralized budgeting data model with SQL Server 2012 Analysis Services.
- Form & report authoring through Microsoft Office Excel® 2010 & PivotTables.
- Centralized budgeting data model with SQL Server 2012 Analysis Services.
- Form & report authoring through Microsoft Office Excel® 2010 & PivotTables.
- Allow for spreading and allocation entry automatically calculated forecasts.
- Online document storage and collaboration with security management and control for forms and reports through Microsoft SharePoint® Server 2010.
4.1.3 Intelligence and Investigation
This business component/Subject area provides the intelligence BI capabilities to the Customs Intelligence Department and the intelligence section in the Airport Customs office.
4.1.4 Airport Intelligence and Investigation:
This part of intelligence is designed to identify the suspected travelers or smugglers upon their arrival to the airport, by linking each flight manifest to the historical data and the watch lists. The people in the list will be identified before leaving the airport to be checked carefully without disturbing the other passengers.4.1.5 Data Mining:
data will be used in the customs to create the efficiency of target declarations to be inspected, data implementation in this project will be limited to detecting fraud” infraction" behavior in customs declaration data. this work requires customs to identify the characteristics of declaration which in a preceding period ( for example, over the previous twelve months). it has a resulted in an infraction and then deducing the „statistical
regularities‟ in those infractions For this reason, all the important available information are used in the contents of verification which certificate details of declaration and the results of inspection during a reference period. Building a fraud detection model may help in decision supporting systems for preventing frauds or planning audit strategies (a posteriori fraud detection), but it is important to note that a valuable results are not always guaranteed in data mining models. The most basic part of a data mining question is the attribute, which is a single piece of information about an example. When choosing attributes for data mining, we should careful to choose attributes that are likely to relevant to the question and provide information that can be used by the data mining algorithm. Some important attributes could be driven and calculated from other attributes such as the frequency of infractions which is calculated for each importer (this is the ratio between the number of declarations made by an importer involved in a customs infraction and the total number of declarations made by that importer during the period in question). Thus, importers are rated on a scale from 0 to 1, where 0 is for importers that represent no risk and 1 for importers that represent a high risk.
4.1.6 Intelligence and Investigation:
The airport customs department is responsible on the balance between the customs monitoring and controlling and facilitating the procedures of the passengers. This center plays important role of the implementing the principles and the criteria for the target travelers who are suspects and apply the legal procedures on them and directing a special effort toward the most dangerous travelers and reduce the direct effort to the dangerous behaviors. The main concern to the implement of BI solution for airport customs center is matching names between different sources. Realsoft had developed a specific module for name matching, refer to section “Watch List name matching Module”. Airport customs center requires an online dashboards and analytical tools in order to find out the most dangerous travelers and targeting them by applying a set of indicators on the available data about the travelers and their histories, these indicators are listed in table(3).
Table 3. Most Dangerous Traveler's Indicators
Indicator Description
Number of tips When exceeding a certain number of trips per a certain period. Departed country The country from where the traveler came
Previous luggage What kind of luggage and how it was imported and entered to Jordan Previous Deposit luggage What was lifted before by the traveler
Previous booking receipts Receipts amount paid to retrieve the goods seized Ticket type, place of publication and
issued time
Duration between departure and arrival
Customs record Historical record for the traveler suspect whether it was offense or smuggling cases Travelers Departure Dealing with goods that came up with the traveler through the airport, whether or
customs declaration or policy shifts
4.1.7 Dashboards & Reports
Targeting through the criteria is applied on the next flight, where the report includes the following fields: Flight number and destination, arrival and lines and the number of passengers and the time of arrival and flight status. therefore
targeting people involved and named in the lists of the follow-up, where the report includes the following fields: Name by lists of airlines and name, according to previous data and the reasons for targeting and the degree of danger. From the previous interpretation it is cleared that the
Jordanian Customs used intelligence business tools to improve decision-making processes significantly.
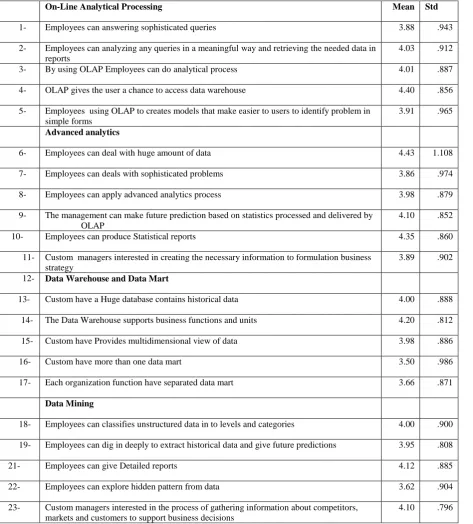
4.2 Section 2: Questionnaire Results
[image:6.595.46.520.237.762.2]The statistical description was used to count the mathematical means and standard deviation of the study questions; they were summarized in the following table:
Table 4. The mathematical means and standard deviation for the items
On-Line Analytical Processing Mean Std
1- Employees can answering sophisticated queries 3.88 .943 2- Employees can analyzing any queries in a meaningful way and retrieving the needed data in
reports
4.03 .912 3- By using OLAP Employees can do analytical process 4.01 .887 4- OLAP gives the user a chance to access data warehouse 4.40 .856 5- Employees using OLAP to creates models that make easier to users to identify problem in
simple forms
3.91 .965
Advanced analytics
6- Employees can deal with huge amount of data 4.43 1.108 7- Employees can deals with sophisticated problems 3.86 .974 8- Employees can apply advanced analytics process 3.98 .879 9- The management can make future prediction based on statistics processed and delivered by
OLAP
4.10 .852 10- Employees can produce Statistical reports 4.35 .860
11- Custom managers interested in creating the necessary information to formulation business strategy
3.89 .902 12- Data Warehouse and Data Mart
13- Custom have a Huge database contains historical data 4.00 .888 14- The Data Warehouse supports business functions and units 4.20 .812 15- Custom have Provides multidimensional view of data 3.98 .886
16- Custom have more than one data mart 3.50 .986
17- Each organization function have separated data mart 3.66 .871
Data Mining
18- Employees can classifies unstructured data in to levels and categories 4.00 .900 19- Employees can dig in deeply to extract historical data and give future predictions 3.95 .808
21- Employees can give Detailed reports 4.12 .885
22- Employees can explore hidden pattern from data 3.62 .904 23- Custom managers interested in the process of gathering information about competitors,
markets and customers to support business decisions
Decision Process
24- Decisions taken at the Custom contribute to achieving the Custom mission 3.89 .798 25- Decisions taken at the Custom are achievable 3.95 .754 26- Decisions taken at the Custom contribute to achieving the Custom vision 4.00 .803 27- Decisions taken at the Custom are measurable 3.62 .959 28- Decisions taken by Custom Characterized by easily follow up their results in the long term 4.10 809 29- Decisions taken at the Custom consistent with their strategic objectives 3.82 .917 30- Decisions that taken consistent at the Custom with the policy pursued by the Custom 3.75 .981 31- Custom Interested in developing strategies for new services that it intends to submit in the
coming years
4.15 .776 32- The Custom have an ability to customize the expulsion information as needed 3.98 .791 33- Information provided in Custom is characterized by comprehensive 4.20 .789 34- Information in Custom presented at appropriate level of detail and precision 4.10 .870 From table (4) the researcher observes that all answers were positive.
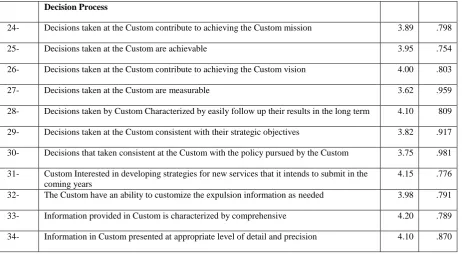
5. STUDY HYPOTHESIS TEST
[image:7.595.47.510.71.325.2]It the following we will examine each of the study hypotheses.
Table 5. Test Hypothesis one
Variable R R Square
Durbun Waston
F Sig
Decision Making Process
0.575 0.330 1.62 66.25 .000
Constant: On-Line Analytical Processing; Simple Regression Test
[image:7.595.309.549.412.500.2]From table (5) the researcher observes that there is a significant effect of on-line analytical Processing on decision making process in Jordanian Custom.
Table 6. Test Hypothesis tow
Variable R R Square
Durbun Waston
F Sig
Decision Making Process
0.641 0.441 1.54 77.319 .000
[image:7.595.50.288.529.608.2]Constant: Advanced analytics; Simple Regression Test From table (6) the researcher observes that there is a significant effect of advanced analytics on decision making process in Jordanian Custom.
Table 7. Test Hypothesis three
Variable R R Square
Durbun Waston
F Sig
Decision Making Process
0.631 0.398 1.61 75.237 .000
Constant: Data warehouses and data marts; Simple Regression
From table (7) the researcher observes that there is a significant effect of data warehouses and data marts on decision making process in Jordanian Custom.
Table 8. Test Hypothesis four
Variable R R Square
Durbun Waston
F Sig
Decision Making Process
0.521 0.271 1.74 41.237 .000
Constant: Data Mining; Simple Regression Test
From table (8) the researcher observes that there is a significant effect of data mining on decision making process in Jordanian Custom.
6. CONCLUSION
[image:7.595.48.287.662.744.2]7. REFERENCES
[1] Bahrami, M., Arabzad, M., and Ghorbani, M. "Innovation in Market Management by Utilizing Business Intelligence: Introducing Proposed Framework", Procedia- social and Behavioral Sciences, Vol. 41, (2012), pp: 160-167.
[2] Tutunea, F. R., and Rus., V. “Business intelligence solutions for SME‟s”, Procsdia Economics and Finance, Vol. 3, (2012), pp: 865-87.
[3] Hannula, M., and Pirttimaki V. "Business intelligence empirical study on top 50 finish companies”, Journal of American Academy of Business, 2(2), 2003; pp: 593-599.
[4] Hedgebeth, D. " Data-driven decision making for the enterprise: an overview of business intelligence applications, The journal of information and knowledge management systems, Vol. 37 No. 4, 2007 pp: 414-420 [5] Anandarajan, M., Anandarajan, A., and Srinivasan, C."
Business Intelligence Techniques a perspective from Accounting and Finance”, Springer, Berlin, 2004. [6] Williams, S., and Williams, N. “The Profit Impact of
Business Intelligence, Elsevier Inc, 2007.
[7] Azma, F., and Mostafapour, M., A. “Business intelligence as a key strategy for development Organizations”, Procedia Technology, Vol.1, (2012), pp: 102 – 106) [8] Maria, F., "Improving the utilization of external strategic
information”, Master Thesis, Tampere University of Technology (2005).
[9] Power, D., and J. „„Understanding data-driven decision support systems‟‟, Information Systems Management, Vol.25, No.2, (2008), pp: 149–154.
[10] Petrini, M., and Pozzebon, M. "What role is business intelligence playing in developing countries? A picture of Brazilian companies", IGI Global (2008), pp: 237– 257,
[11] Bose, R. "Advanced analytics: opportunities and challenges‟‟, Industrial Management & Data Systems, Vol.109, Issue (2), (2009), pp: 155–172.
[12] Rnjan, J. "Business justification with business intelligence", The Journal of Information and Knowledge Management Systems, Vol.38, Issue (4), (2008), pp: 461– 475.
[13] Turban, E., Sharda, R., and Dursun, D. "Decision Support and Business Intelligence Systems", 9th Ed., Prentice Hall, 2009.
[14] Cohen, C. "Business Intelligence: The Effectiveness of Strategic Intelligence and its Impact on the Performance of Organizations, John Wiley & Sons Inc, 2009. [15] Li Niu, Jie Lu, and Zhang, "Cognition Driven Decision
Support for Business Intelligence: Models, Techniques, systems and applications”, Springer Verlag Beerlin Heidelberg, 2009.
[16] Grigori, D., Casati, F., and Castellanos, M. "Business Process Intelligence", Computers in Industry, Vol. 53, (2004), pp: 321–343).
[17] Azma, F., and Ali, M. "Business intelligence as a key strategy for development organizations", Procedia Technology, Vol.1, 2012, pp: 102 – 106)
[18] Vitt, E., Luckevich, M., and Misne, S. "Making better Business Intelligence Decision faster”, O‟Reilly media, Inc., Apr 19, 2010.
[19] Ranjan, Jayanthi. "Business Intelligence: Concept, Component, Technique and Benifits", Journal of Theoretical and Applied Information Technology, 2009, pp: 60-70.
[20] Matei, G. “A collaborative approach of business intelligence systems”, (2010). Journal of Applied Collaborative Systems, Vol.2, No.2, (2010), pp: 91-101. [21] Olszak, C.M., and Ziemba, E. "Business intelligence
systems in the holistic infrastructure development supporting decision-making in organizations", Interdisciplinary Journal of Information, Knowledge and Management, Vol.1, pp: 47- 58.
[22] Cody, F., Kreulen, J.T., and Spangler, W.S. "The integration of business intelligence and knowledge management”, IBM Systems Journal, Vol.41, No4, 2002, pp: 697-713.
[23] Shi, Z., Wang, M., Wu, W., Xu, L., and Zeng, L. "Techniques, process, and enterprise solutions of business intelligence", Systems, Man and Cybernetics. SMC '06. IEEE International Conference, (2006), pp: 4722-4726.