http://dx.doi.org/10.4236/acs.2014.42032
Analyses and Numerical Modeling of Gravity
Waves Generated by Flow over Nanling
Mountains
Ziliang Li, Jin ZhouCollege of Physical and Environment Oceanography, Ocean University of China, Qingdao, China Email: [email protected]
Received 15 March 2014; revised 10 April 2014; accepted 17 April 2014
Copyright © 2014 by authors and Scientific Research Publishing Inc.
This work is licensed under the Creative Commons Attribution International License (CC BY).
http://creativecommons.org/licenses/by/4.0/
Abstract
Although there have been many observational and modeling studies of gravity waves excited by topograpghy, the detailed structure and its changes in real world are still poorly understood. The interaction of topography and background flow are described in details for a better understanding of the gravity waves observed by the Moderate Resolution Imaging Spectroradiometer (MODIS) satellite imagery over Nanling Mountains. The evolutionary process and spatial structure of grav- ity waves were investigated by using almost all available observational data, including MODIS sa- tellite imagery, the Final Analyses (FNL) data issued by National Centers for Environmental Pre- diction (NCEP), the aerosol backscattering signal data from Lidar, the surface observational data and the sounding data of Nanling mountain regions. In order to study its development mechan- ism, choosing the initial sounding of Jiangxi Gaizhou station located in the upstream of Nanling re- gions, and using the Advanced Regional Prediction System (ARPS), the numerical simulation was performed. It is shown that the ARPS model reproduced the main features of gravity waves rea- sonably well, where the gravity waves and turbulent mixed layer are consistent with the satellite image and the aerosol backscattering signal from Lidar observation. It is well-known that gravity wave-induced turbulence and thus turbulent mixing could affect the local composition of chemical species, which plays a significant role in the formation of low visibility and precipitation asso- ciated with local orography.
Keywords
Gravity Waves; Mountains; Boundary Layer; Simulation
1. Introduction
Wurtele (1957) [14], Crapper (1959, 1962) [15] [16], and Janowitz (1984) [17] for non-hydrostatic flows and by Smith (1980, 1988, 1989) [18]-[20] and Phillips (1984) [21] for hydrostatic flows. Crapper (1962) [16], Shar- man and Wurtele (1983) [22], Gjevik and Marthinsen (1978) [23], and GrubiŠić and Smolarkiewicz (1997) [24] examined the effect of vertical variations in wind speed and stability of the environment. Sharman (2004) [9] investigated the three-dimensional structure of lee waves using a combination of linear analysis and numerical simulation, where the flow structures considered are of constant static stability and zero, positive, and negative basic flow shears, the three-dimensional lee waves structures of a V-shaped region in the (y, z) plane that de- fines the location of maximum wave amplitudes were obtained. Smith (2002) [5] uses the linear theory model to illustrate the various physical attributes of lee waves, and the non-linear dissipative lee wave dynamics and the potential vorticity generation are discussed. Besides, large numbers of simulation have been performed in the study of linear and nonlinear wave dynamics and have greatly advanced the understanding of gravity wave dy- namics (Smolarkiewicz and Rotunno 1990 [10], Bauer et al. 2000 [25], and Epifanio and Durran 2001 [26]). Recently, James and Ruppert (2014) [27] studied the interaction of a mesoscale gravity wave with a mesoscale convective system.
Clouds can form in the upward motion areas of gravity waves if the moist airflow over mountain. The availa- bility of satellite imagery over the complex terrain has made possible the detection of wave cloud formation. The signature of waves in a satellite photograph consists of a series of white and black lines, where air ascends and descends respectively. Cloud patterns associated with gravity waves are always much less complicated than the mountain shapes which produce them. Despite all these previous studies, the fully structure of gravity wave systems is still a relatively unexplored area, especially, the three-dimensional problem of flow past the real ter- rain has been dealt with less frequently. The aim of this paper is to document the orographic gravity wave event of 22 December 2004, where gravity waves play a significant role in the formation of fog combined with a driz- zle associated with local orography. Sections 2 and 4 are devoted to the observations and simulations of flow over Nanling Mountains, respectively. Model descriptions are given in Section 2. Our conclusions are presented in Section 5.
2. Observation
Nanling Mountains are located within the north latitude 24˚- 26˚30' and east longitude 110˚ - 116˚, with 600 Km long from west to east and 200 Km wide from north to south. Consisting of five main mountain ranges, Nanling Mountains is also called the Five Ridges. Most massifs consist of hills with medium elevation about 1000 m, which are alternated with 300 - 500 m high hills and basins. It is a natural barrier against the cold air from the north and the tropical warm currents from the south. Satellite imagery confirms that lee waves have developed on lee side of the southern tip of Nanling mountain regions. Figure 1 is a typical satellite cloud picture of gravi- ty wave, which represents mountain wave clouds consisting of alternate black and white lines indicating upward and downward movement. Pilots with passengers prefer to avoid such wave clouds because they alter the height of the plane and often encounter turbulence, and the availability of a mountain wave forecast could allow pilots about the possibility of turbulence.
Figure 1. Satellite image from MODIS observation of lee wave pattern, which located at the northeast Guangdong (MYDO2HKM 2004-12-22-05:20 UTC).
with 500 hpa pre-trough southwest air current and 850 hpa wind shear of horizontal moving southward, and the air current crossing over Nanling Mountains and forming northeast reversal flow weather situation at the lower layer of lee side. From the sounding curve, we can also see that there also existed the wind shear between lower layer northeast wind and higher layer southeast wind in the vertical direction. The typical boundary layer cross- ing over Nanling Mountains and the stable stratifications in Guangdong are typical meteorological conditions favorable to the formation of trapped lee wave.
3. Model Description
The simulation experiments are conducted in there using the Version 5.0.0.0IHOP5 of the Advanced Regional Prediction System (ARPS), ARPS is a three-dimensional, non-hydrostatic model developed for storm scale nu- merical weather prediction in the University of Oklahoma. The computational domain consists of 163 by 163 grid points and with 10 km horizontal grid spacing, and there are 43 layers with 0.5 km vertical resolution, and Rayleigh damping is applied over the top half depth 20 layers. And the model domain center located in the lati- tude 25˚ and east longitude 115˚. In addition, for the model integrating time, the big time step and the small time step are 2 s and 0.5 s, respectively. Using the initial sounding of Ganzhou station located in the upstream of Nanling on Dec. 22.08. Turn on the Kessler-type warm rain microphysics parameterization scheme for the moist airflow over mountain.
4. Results of Simulation
The numerical model can successfully simulate gravity waves under certain conditions such as the ideal flow configuration and ideal terrain. However, gravity wave simulations involving in the real synoptic data and real terrain are rarely documented. It is surprising that the results shown in Figure 2 and Figure 3 are consistent with observations, comparing the satellite image and the velocity simulated by ARPS, where the results show the same characters of apparent diverging wave modes. From Figure 2, we can see that wave fields represents wave clouds consisting of alternate green and yellow lines indicating upward and downward movement and splay outward from the downstream centerline along the northeastern to southwestern, and show the same flow fea- tures as the wave pattern shown by the satellite image. The horizontal velocity filed (Figure 3) show that the horizontal wind shear with horizontal critical layer forms over the top and lee side of mountains. In addition,
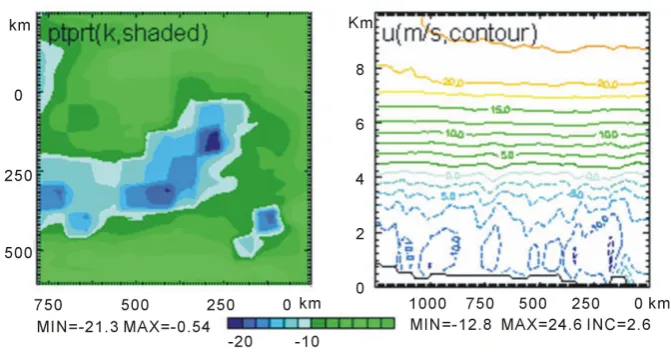
Figure 4 (left) show that the potential temperature drops greatly over the top and the lee side of mountain. Most important, a mixed boundary layer is fully developed and the model PBL is slightly deeper than the observations.
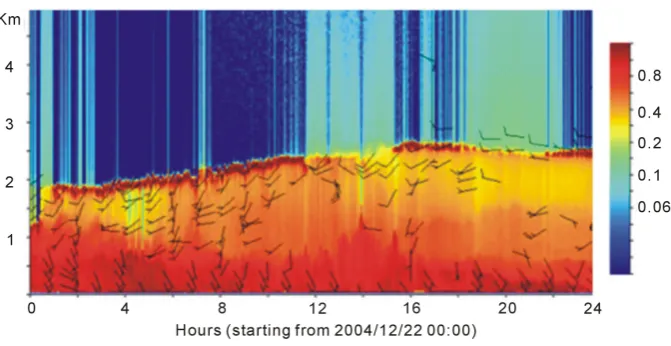
Figure 5 shows that the depth of boundary layer is about 2 km, with southeast wind in the lower, in contrast to southwest wind aloft. Figure 4 (right) confirms that there are waves between z = 2 km and z = 5 km, and there are some turbulent eddies below 2 km. Combined Figure 5 with Figure 4 (right), we can get that the mixed layer depth is about 2 km. It is concluded that lee waves are mainly determined by boundary layer depth, and the interaction of flow and boundary layer ultimately lead to the forming of lee waves, and the wave characters are subject to the evolution of boundary layer.
5. Discussion and Conclusion
Figure 2. The vertical velocity w (left) and its perturbation (right) at z = 3.5 km and time t = 3.33 h.
Figure 3. The simulation results of horizontal velocity u and v at z = 3.5 km and time t = 3.33 h.
[image:4.595.148.484.509.687.2]Figure 5. The evolution of local aerosol backscattering signal from Lidar,which located at lee side of Nanling.
imagery has made possible the detection of mountain wave cloud formation. The numerical simulations of grav- ity waves in real world encounter more difficulty than ideal case. In this article, we use the numeric model ARPS to simulate the three-dimensional gravity waves forced by topography, where gravity waves are simulated by the real terrain and observational data, the model results are consistent with the satellite image and results of Lidar data analysis. The observation and simulation of gravity wave patterns and boundary layer process show a striking resemblance to the classic waves and turbulence forced by topography.
Research on mountain flows is important in a mountainous country like China, in order to be able to deter- mine the conditions under which strong winds and turbulence can develop. The enhancement of rain is also of importance, in particular for the prediction of flash floods and landslides. We will continue exploring what syn- optic situations are needed in determining the characteristics of flow and improve the mountain wave weather forecasting.
Acknowledgements
This work was supported by the Ocean Public Welfare Scientific Research Project, State Oceanic Administra- tion of China (201105018) and National Natural Science Foundation of China (41176005).
References
[1] Queney, P. (1948) The Problem of Airflow over Mountains. A Summary of Theoretical Studies. Bulletin of the Ameri- can Meteorological Society, 29, 16-26.
[2] Scorer, R.S. (1949) Theory of Waves in the Lee of Mountains. Quarterly Journal of the Royal Meteorological Society, 75, 41-56. http://dx.doi.org/10.1002/qj.49707532308
[3] Scorer, R.S. (1956) Airflow over an Isolated Hill. Quarterly Journal of the Royal Meteorological Society, 82, 75-81.
http://dx.doi.org/10.1002/qj.49708235107
[4] Smith, R.B. (1979) The Influence of Mountains on the Atmosphere. Advances in Geophysics, 29, 87-230.
http://dx.doi.org/10.1016/S0065-2687(08)60262-9
[5] Smith, R.B. (2002) Stratified Flow over Topography. Environment Stratified Flows, 3, 119-159.
[6] Durran, D.R. (1990) Atmospheric Processes over Complex Terrain, Meteorological monographs. American Meteoro- logical Society, Cambridge.
[7] Baines, P.G. (1995) Topography Effects in Stratified Flows. Cambridge University Press, Cambridge.
[8] Wurtele, M.G., Sharman, R.D. and Data, A. (1996) Atmospheric Lee Waves. Annual Review of Fluid Mechanics, 28, 429-476. http://dx.doi.org/10.1146/annurev.fl.28.010196.002241
[9] Sharman, R.D. (2004) Three-Dimensional Structures of Forced Gravity Waves and Lee Waves. Journal of the Atmos- pheric Sciences, 61, 664-681. http://dx.doi.org/10.1175/1520-0469(2004)061<0664:TSOFGW>2.0.CO;2
[14] Wurtele, M.G. (1957) The Three-Dimensional Lee Wave. Beiträge zur Physik der freien Atmosphäre, 29, 242-252. [15] Crapper, G.D. (1959) A Three-Dimensional Solution for Waves in the Lee of Mountains. Journal of Fluid Mechanics,
6, 51-76. http://dx.doi.org/10.1017/S0022112059000490
[16] Crapper, G.D. (1962) Waves in the Lee of a Mountain with Elliptical Contours. Philosophical Transactions for the Royal Society of London. Series A, 254, 601-623.
[17] Janowitz, G.S. (1984) Lee Waves in Three Dimensional Stratified Flow. Journal of Fluid Mechanics, 148, 97-108.
http://dx.doi.org/10.1017/S0022112084002263
[18] Smith, R.B. (1980) Linear Theory of Stratified Hydrostatic Flow past an Isolated Mountain. Tellus, 32, 348-364.
http://dx.doi.org/10.1111/j.2153-3490.1980.tb00962.x
[19] Smith, R.B. (1988) Linear Theory of Stratified Flow past an Isolated Mountain in Isosteric Coordinates. Journal of the Atmospheric Sciences, 45, 3889-3896. http://dx.doi.org/10.1175/1520-0469(1988)045<3889:LTOSFP>2.0.CO;2
[20] Smith, R.B. (1989) Mountain Induced Stagnation Points in Hydrostatic Flow. Tellus, 41A, 270-274.
http://dx.doi.org/10.1111/j.1600-0870.1989.tb00381.x
[21] Phillips, D.S. (1984) Analytical Surface Pressure and Drag for Linear Hydrostatic Flow over Three Dimensional Ellip- tical Mountain. Journal of the Atmospheric Sciences, 41, 1073-1084.
[22] Sharman, R.D. and Wurtele, M.G. (1983) Ship Waves and Lee Waves. Journal of the Atmospheric Sciences, 40, 396- 427. http://dx.doi.org/10.1175/1520-0469(1983)040<0396:SWALW>2.0.CO;2
[23] Gjevik, B. and Marthinsen, T. (1978) Three Dimensional Lee Wave Pattern. Quarterly Journal of the Royal Meteoro-
logical Society, 104, 947-957. http://dx.doi.org/10.1002/qj.49710444207
[24] Grubisic, V. and Smolarkiewicz, P.K. (1997) The Effects of Critical Levels on 3D Orographic Flows: Linear Regime.
Journal of the Atmospheric Sciences, 54, 1943-1960.
http://dx.doi.org/10.1175/1520-0469(1997)054<1943:TEOCLO>2.0.CO;2
[25] Bauer, M.H., Mayr, G.J., Vergeiner, I. and Pichler, H. (2000) Strongly Nonlinear Flow over and around a Three Di- mensional Mountain as a Function of the Horizontal Aspect Ratio. Journal of the Atmospheric Sciences, 57, 3971-1991.
http://dx.doi.org/10.1175/1520-0469(2001)058<3971:SNFOAA>2.0.CO;2
[26] Epifanio, C.C. and Durran, D.R. (2001) Three Dimensional Effects in High Drag State Flows over Long Ridges. Jour-
nal of the Atmospheric Sciences, 58, 1051-1065.
http://dx.doi.org/10.1175/1520-0469(2001)058<1051:TDEIHD>2.0.CO;2