Intelligent Linear Data Structure with Self Performance
Optimization Capacity: Application on Big Data
1
Smail TIGANI,
2Mouhamed OUZZIF,
3Abderrahim HASBI and
4Rachid SAADANE
1RITM/ESTC, National High School of Electricity and Mechanics. Casablanca, Morocco2RITM/ESTC, High School of Technology. Casablanca, Morocco 3RSE/EMI, Mohamadia School of Engineering. Rabat, Morocco 4SIRC/LaGeS-EHTP, Hassania School of Labor Works. Casablanca, Morocco
ABSTRACT
The access to relevant information from a big data container is gain-ing immense significance. This depends on storage technics and the organization level. This work proposes an intelligent linear data structure with an integrated cognitive agent reorganizing periodi-cally the data structure content. The reorganization is based on a confidence interval of a random variable estimated by the agent. This random variable represents the demand frequency for each element. The cognitive agent studies the client behavior and puts most popular data in the beginning of the array in order to be found quickly. That increases considerably the search algorithm perfor-mance and solves by that one of most problems of the big data field. Models and algorithms in this work are implemented with Java pro-gramming language and simulated and that proves the reliability of the approach.
Keywords:
Data Structures, Big Data, Statistic Modelling, Algorithms and Computational Complexity, Auto-adaptive Systems, High Perfor-mance Systems.
1. INTRODUCTION
The Web 2.0 described by D. Dougherty (2003) allows internet end-users to interact with web pages content and exchange millions of comments, pictures and also massive data over social networks and personal pages... By that we mean that Modern information systems needs processing a huge quantity of data and manage an important network traffic : it is the Big Data. The big quantity of data presents an asset for inference algorithms by increasing precision and in the same time harms the performance witch is a very important aspect that many researches are focused on and still up to now. Z. Yang and al (2010) talks, in (1), about one of the most important aspect of information system performance : it is the availability of data and servers hosting those data.
This paper presents a new linear data structure having the ability to reorganize the data is self in order to optimize the performance of operation research of data on it. By self reorganize we means, the determination of most popular data subset and put them on first ranges of the list to be found quickly. The estimation
of popular and non popular data is done by un internal agent making the perception of the client behavior and then estimate some statistical parameters on which the decision making relies.
The content of his paper is organized as follows : the section 2 introduces some related works and some critics with discussions, while section 3 presents the statistical models. Algorithms design and computational complexity analysis are reported to the section 4, while simulation results and curves with comments are pre-sented in section 5. Finally, Section 6 presents concluding remarks followed by discussion of future work.
2. RELATED WORKS
In (3), R. Gupta (2014) talked about the evolution time line of intelligent information technologies from the data mining fields moving to the web mining arriving actually (2014) to the big data technology. By big data we means all technics allowing the processing of very huge quantity of data and the extraction of useful information keeping performance aspects. That comes to design intelligent data container able to assure the availability of data as described by Z. Yang and al (2010) in (1). One of works touching to the all those sides are works of I. Ioannidis and al (2003) who described in (2) the idea ofadaptive data structures
providing performance guarantee as an IP addresses lookups application.
K. Greer and al (2009) introduces the idea self-organising infrastructureof services in (5) and, in the same year, D. Lefeb-vre presents in (7) some challenges for adaptive systems. The discussed last works allows us to think about the incorporation of the auto-adaptive aspect in a linear data structure in order to reorganise the content of it and then optimize some performance indication to define posteriorly.
sample denoted sn, that allows to build the confidence interval
using works of S. Niwitpong and al (2013) found in (9) and statistical reference (11) of L. Lebart and al (1995).
3. MATHEMATICAL MODELLING
Designed algorithms in this work are based on some mathematical models. This section focuses on statistical modelling aspects and explains also the classification criteria of data in the array.
3.1 Basic definitions
Let consider a finite stateEcontaining all data in the linear data structure. In theory, the data is represented with elementse1...em
and, in practice, with a Java class introduced in the appendix 2. Formally :
E={ei}ii==1m (1)
Let consider a random experience repeatedntimes : the experi-ence is looking for an element fromEdefined previously. LetXei
be the random variable representing the average of the demand of the elementei during all the process andmn the mean ofXei.
Mathematically :
mn=
1
n
n X
k=1
1{ei=e∗
k} (2)
Withe∗k is the researched element at the instant k. The function 1{ei=e∗k} is equals to 1ifei = e∗k and equals to0if not. Let’s
call alsomnandsnthe average and the standard deviation,
respec-tively, of the variableXei.
3.2 Probability Law
This subsection discuses the probability law of the variableXei.
Based on this low, the confidence interval of the previous variable is build with a fixed confidence rate :90%,95%... S. Niwitpong and al (2013) affirms in (9) that with unknown standard deviation
σ. That comes to use a random variable with Student law based on non-biased estimatorsn. Formally :
Xei−m
n
sn/
√
n vT
n−1
(3)
WithTn−1is the Student distribution withn−1degrees of free-dom.
3.3 Confidence Interval Estimation
The confidence interval of Xei denoted ζ
95(Xei) with
LB(ζ95(Xei)) is the left bound of the interval ζ95(Xei) andRB(ζ95(Xei))the right one. See the proof on appendix 1. Formally :
ζ95(Xei) =
mn−1.96
sn
√
n
| {z }
LB(ζ95(Xei))
, mn+ 1.96
sn
√
n
| {z }
LB(ζ95(Xei))
(4)
3.4 Classification Criteria
In order to optimize the time of research in the linear array, The internal agent reorganizes periodically the content of the array. The
organization will be done by moving most demanded class of data to the beginning of the array, and the less demanded at the end. The CI1of the average of demand allow the agent to pin point the
element having the biggest chance to appear in next demand.The CI of demand average takes in consideration the popularity of the element and also the stability of it. By stability we mean, the homogeneity of the element demand, it is represented by the standard deviation. It is evident so that the element having the biggest lower bound of the CI is the most demanded stable element. This one needs to be moved in first range. Finally the agent makes an descending sort of all element of the array by the lower bound of the CI.
4. ALGORITHMS DESIGN
4.1 Reorganization Algorithm
In this section is the design of algorithms implementing models discussed in section 3. The algorithm 1 reorganizes data in the ar-ray according to the left bound of the confidence intervalζ95(Xei) : the algorithm makes a descending sort of elements according to the worst frequency of demand2. That makes most demanded
ele-ments reorganized in the beginning of the array in order to be found quickly. See the algorithm :
Algorithm 1:Data Reorganizer
Input:E: Data Set
fori= 1tom−1do forj=i+ 1tomdo
ifLB(ζ95(Xei))< LB(ζ95(Xej))then
vT mp←ej
ej←ei
ei←vT mp
Computational complexity of the algorithm 1 is quadraticO(m2). 4.2 Simulation Algorithm
In order to evaluate the performance and the reliability of the approach, this work proposes three key performance indicator to compute during the simulation. Those keys are the cost of research after each research operation, the average of total costs after all the process of simulation and finally the cumulative cost. See the next section for more discussions.
The algorithm 2, whose computational complexity is O(mn), generates a fixed number of data and store them, one by one, in a traditional array in one hand and proposed intelligent array in the other hand. The testing data are stored initially with the same way in the two arrays. The next step is making a search operation of the same randomized value in the two arrays and collecting costs in each case in order to compare them. This last operation is repeated quite a few times to have enough data to plot curves.
1Confidence interval.
Algorithm 2:Performance Simulator
Output:iCost: Costs on Intelligent Array
Output:sCost: Costs on Simple Array // Testing Data
fori= 0tondo
sArray[i]←i iArray[i]←i
// Researched Data
fori= 0tomdo
// Random Data with Normal Law
e←GenerateRandomV alue()
forj= 0tondo ifsArray[j]6=ethen
// Cost on simple array
sCost[i]←sCost[i] + 1
else
break
forj= 0tondo ifiArray[j]6=ethen
// Cost on intelligent array
iCost[i]←iCost[i] + 1
else
break
// Reorganize data for each 100 opertaion
ifm= 0[100]then
DataReorganizer()
4.3 Normal Law Generation Algorithm
The functionGenerateRandomValue(), called in the algorithm 2, generates values with normal law with a specific mean and vari-ance. Most programming languages allows the generation of uni-form random variable that are transuni-formable to an other proba-bility law using different methods. Let considerU1 andU2 two uniform random variables on[0,1]and X a given random vari-able. K. Ranga and al (2011) presents, in (12), the method intro-duced by Box-Muller (1958) allowing the generation of normal law
X∼N(µ, σ2)with :
X=µ+σsin (2π.U2)
p
−2ln(U1) (5) The algorithm 3 is able to generate random values with gaussian law, it is introduced in order to make simulation with a normal dis-tribution. This algorithm relies on Box-Muller method explained in equation 5. See the algorithm :
Algorithm 3:Normal Distribution Generator
Output:µ: Desired mean
Output:σ: Desired standard deviation
Output:X:X ∼N(µ, σ2)
// All programming language provide this function
U1←U nif ormeRandomV alue()
U2←U nif ormeRandomV alue() // Box-Muller method
returnµ+σsin (2π.U2)
p
−2ln(U1)
5. SIMULATION RESULTS
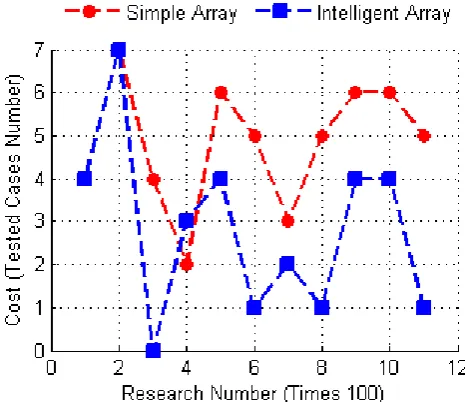
5.1 Research cost KPI
The algorithm 2 making the simulation computes the arraysiCost
[image:3.595.318.551.171.372.2]andsCostcontaining costs to find the same data in the intelligent array and the simple array respectively. In order to assure the vis-ibility of curves in the figure, The algorithm makes sampling each 100operation research and that gives the figure 1 :
Fig. 1: Research Cost Variation
The figure 1 shows that the adoption of the proposed intelligent array optimizes considerably after a small training period.
5.2 Cost average KPI
Based on the two arraysiCostandsCost, Let define the average of cumulative cost on the intelligent arrayΛiin all the simulation
process onmoperation research as :
Λi=
Pm
k=1iCost[k]
Pm
k=1(iCost[k] +sCost[k])
(6)
With the same way, the average of cumulative cost on the simple arrayΛsduring all the process is the following :
Λs=
Pm
k=1sCost[k]
Pm
k=1(iCost[k] +sCost[k])
(7)
The simulation program affirms in all cases thatΛi<Λs. The table
5.2 shows the result of cumulative cost average comparative study between the two approaches after 1100 iteration. See the table :
Cumulative Cost Average n= 1100 Λifor Intelligent Array 42%
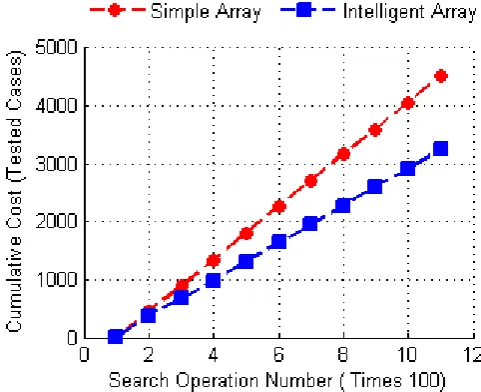
5.3 Cumulative Cost KPI
Letθi(n)be the cumulative cost for the intelligent array until the
nthoperation research defined in the equation 8. Formally :
θi(n) = n X
k=1
iCost[k] (8)
With he same way, let defineθs(n)for the simple array given by
the equation 9. Formally :
θs(n) =
n X
k=1
sCost[k] (9)
The figure 2 represents the variation ofθs(n)andθi(n)during the
[image:4.595.55.296.252.448.2]process of simulation. See the figure :
Fig. 2: Cumulative Cost Variation
Based on previous KPI, The figure 2 shows that the gain on re-sponse time is increasing using the proposed intelligent array.
6. CONCLUSION
This work proposes an intelligent array having the capacity to self-organize its content in order to optimize some performance aspects. The reorganization is based on the unilateral confidence interval of a random variable representing the average of demand of each element of the array. The approach is validated by simulation and results are more competitive comparing than the traditional approach.
This work presents also the algorithms designed implement-ing adopted statistical models and the algorithm of simulation designed and implemented in order to prove the reliability of the approach. Algorithms in this work are implemented with Java programming language following the Java reference of B. Eckel (2006) described in (13). The approach is validated by simulation and that gives satisfying numerical results.
Next works will continue on this way by using more
ad-vanced automatic learning technics to optimize complex systems efficiency and then increase performance.
APPENDICES
6.1 Appendix 1 : Proof on confidence interval.
In order to find the upper and lower bound ofXeiwith100(1−
α)%. Let suppose :
π(tn−1
α/2 ≤
Xei−m
n
sn/
√
n ≥t
n−1
1−α/2) = 1−α (10) With π is a probability function. Let fixeα = 0.05, according to Student law table, we haveTn−1
1−α/2 = −T
n−1
α/2 = 1.96for an infinite freedom degree. The choice of infinite freedom degree is due to the big quantity of data that will be stored in the array. Some simplifications of equation 5 gives :
π(mn−1.96
sn
√
n
| {z }
LB(ζ95(Xei))
≤Xei≤m
n+ 1.96
sn
√
n
| {z }
RB(ζ95(Xei))
) = 1−α (11)
Based on equation 11, a percentage of 95%, gives Xei ≥
LB(ζ95(Xei))andXei≤LB(ζ95(Xei)). 6.2 Appendix 2 : Data container with Java.
In order to implement the approach with a programming language, let develop a Java class to contain necessary parameters. See pro-posed class denotedCData:
import java.io.FileWriter; import java.io.IOException; import static java.lang.Math.*; import java.util.ArrayList; import java.util.Random;
/*
@author : Smail TIGANI @version : 1.0
*/
class CData {
// Data
private int element;
// Avarage of demand of the data private double average;
// Standard deviation of demand private double SDeviation;
// Left bound of the confidence interval of demand private double LeftBoundUIC;
public CData() { }
public CData(int element) { this.element = element; this.average = 0; this.SDeviation = 0; this.LeftBoundUIC = 0; }
public int getElement() { return element; }
this.element = element; }
public double getAverage() { return average;
}
public void setAverage(double average) { this.average = average;
}
public double getSDeviation() { return SDeviation;
}
public void setSDeviation(double SDeviation) { this.SDeviation = SDeviation;
}
public double getLeftBoundUIC() { return LeftBoundUIC;
}
public void setLeftBoundUIC(double LeftBoundUIC) { this.LeftBoundUIC = LeftBoundUIC;
} }
Acknowledgment
I would like to express all my gratitude to my supervisors Dr Mohamed OUZZIF, Dr Abderrahim HASBI and Dr Rachid SAADANE for excellent human behavior and technical support. Special thank to the Director of RITM Lab and the Director of High School of Technology - Casablanca, Dr Mounir RIFI.
Authors would like also to thank all reviewers for helpful comments and recommendations.
Thank to Dr Hafid GRIGUER, Mr Anis BOULAL, Miss As-sya BENHIMA and Dr Hicham LAALAJ for all efforts done to encourage scientific research in EMSI Rabat.
Biography
Smail TIGANI : Is a network and telecommunication systems engineer and Phd Student in artificial intelligence and systems modelling. He worked as software engineer and now an infor-mation systems engineer and professor at Moroccan School of Engineering Science in Rabat. Recently, his researches focuses on the application of artificial intelligence on big data and perfor-mance analysis and optimization.
Mohammed OUZZIF : Is a Professor of Computer Science at High School of Technology of the Hassan II University. He has prepared his PHD at Mohammed V University in collaborative work field. His research interesting concerns distributed system and Formal description.
Abderrahim HASBI : Is a Professor of Computer Science at the Mohammadia School of Engineering of the University Mohamed 5 Agdal, Morocco. He is member of the Network and Intelligent systems Group and he has a lot of contributions researches.
Rachid SAADANE : He is currently an Associate Professor in the Electrical Engineering Department at Hassania School of Labor Works of Casablanca, Morocco. His research interests include array of UWB channel measurements modeling and
characterization, mobile and wireless communications (GSM, WCDMA, TD/CDMA, LTE and LTE-A) and finally digital signal processing for wireless communications systems. Recently, he is intensively interested to the IR-UWB physical layer for WSN and WBAN. Rachid is an active reviewer of various international conferences and journals.
References
[1] Z. Yang, J. Tian and Y. Dai,Towards a more accurate avail-ability evaluation in peer-to-peer storage systems, Interna-tional Journal of High Performance Computing and Network-ing, Vol. 6, Nos. 3/4, 2010.
[2] I. Ioannidis, A. Grama and M. Atallah,Adaptive Data Struc-tures for IP Lookups, IEEE INFOCOM, Twenty-second An-nual Joint Conference of the IEEE Computer and Communi-cations Societies, Vol. 1, pp 75 - 84, 2003.
[3] R. Gupta,Journey from Data Mining to Web Mining to Big Data, International Journal of Computer Trends and Technol-ogy, Vol. 10, No. 1, October 2014.
[4] A. Habibizad Navin, M. Naghian Fesharaki, M.K. Mirnia and M. Teshnelab,A Novel Method for Improving the Uniformity of Random Number Generator Based on Data Oriented Mod-eling, International Journal of Computer Science and Net-work Security, Vol.7 No. 7, July 2007, pp 269-273.
[5] K. Greer, M. Baumgarten, M. Mulvenna and C. Nugent,An infrastructure for developing self-organising services, Inter-national Journal of Adaptive and Innovative Systems, Vol. 1, No. 1, 2009, pp 88-103.
[6] M. Beck Rutzig and A. Carlos Schneider Beck,An infras-tructure for developing self-organising services, International Journal of High Performance Systems Architecture, Vol. 4, No. 1, 2012, pp 13-24.
[7] D. Lefebvre,Introduction : Some challenges for adaptive and innovative systems in the next future, International Journal of Adaptive and Innovative Systems, Vol. 1, No. 1, 2009, pp 1-12.
[8] M. Tanusit, Two-Side Confidence Intervals for the Poisson Means, International Journal of Modeling and Optimization, Vol. 2, No. 5, October 2012.
[9] S. Niwitpong and S. Niwitpong,On Simple Confidence Inter-vals for the Normal Mean with a Known Coefficient of Vari-ation, International Journal of Mathematical, Computational, Physical and Quantum Engineering Vol:7 No:9, 2013, pp 1-12.
[10] M. Tanusit,A Novel Method for Improving the Uniformity of Random Number Generator Based on Data Oriented Model-ing, International Journal of Computer Science and Network Security, Vol.7 No. 7, July 2007, pp 269-273.
[11] L. Lebart, A. Morineay and M. Piron,Statistique Exploratoire Multidimensionnelle, ISBN 2 10 0028863, Dunod, Paris, 1995.
[12] K. Ranga, N. Kumar and M. Reddy,Generation of standard normal random variables, Indian Journal of Scientific Re-search, No. 4, Vol. 2, pp. 83-85, 2011.