Performance Analysis of a Telecommunication Network
using Swarm Intelligence
ABSTRACT
Swarm Intelligence, a mutant of biological swarms, exhibits numerous powerful features which are described in communication networks. With the increase in size and complexity of network, performance analysis is becoming difficult. With scalability of network, it becomes difficult to manage the route and indicate which one is the best. The intent of this paper is to find optimal path for routing of calls in a telecommunication network and achieve Load Sharing. For finding optimal path, the pheromone laying and sensing property of natural swarms is used. In this research work we present a simulated network model that uses artificial ants and simulated pheromone for finding optimal path from source to destination. Next node selection is done on the basis of local pheromone distribution and pheromone updation takes place based on the congestion encountered on the node. Simulation results using ACO mode will be compared with non-ACO mode using graphs.
Keywords
Swarm Intelligence, Ant Colony Optimization(ACO), Mobile Agents, Multiple Ant Colony Optimization(MACO),Set Covering Problem(SCP).
1. INTRODUCTION
1.1 Swarm Intelligence
“Swarm is a large or dense group of insects.” Swarm intelligence is the property of a system whereby collective behavior of unsophisticated agents interacting locally with their environment cause coherent functional global pattern to emerge[1].The properties of a swarm intelligence system are as follows[2]:
It is composed of many homogeneous individuals exhibiting identical properties or having same behaviour.
The interactions among these biological swarms takes place on the basis of information exchange that takes place in the environment and they organize their group behaviour without any central controller.
Thus we can use swarm intelligence to model a mechanism possessing properties like scalability, adaptivity, fault tolerance and distributive.
Motivation: The motivation of this biologically inspired approach are two in general.
Dealing with too complex problems: We can use this artificial intelligence of swarms where human proposed solution[3] does not work and the solution cannot be represented by any relevant mathematical model. Thus
it gives motivation to find an efficient solution to complex problems
Existence of similar problem in nature: Secondly, it is motivated to use when we realize that many complex problems that we tackle have similar versions[3] in the natural world and can be solved by using the exhibiting properties of swarms.
Swarm intelligence can be seen in bird flocking, fish schooling and ant and bee colonies[2]. One of the most well known algorithm inspired by swarm intelligence is ant colony optimization.
1.2 ACO Technique
ACO is acronym for Ant Colony Optimization. The word ant colony in ACO signifies that this technique aims to imitate the behaviours of real ant colonies and the word optimization expresses that it is a metaheuristic technique to solve real-world optimization problems. In dynamic optimization problems, the problem gets changed with the changing parameters and the environment, thus the algorithms used to solve these type of problems must be able to adapt the changes. The typical example of such problem is the network routing problem.
Ant Colony Optimization (ACO) belongs to non-deterministic algorithm class. Non-non-deterministic algorithms use randomness and prove useful for problems where it may not be possible to execute a deterministic algorithm due to the size, or nature of the problem search space[4]. A non-deterministic algorithm can find a near-optimal solution in less time unlike deterministic algorithm that may take days or months to find that solution.
1.2.1 The Source of Inspiration: Real Ants
Ant colony optimization algorithms have been inspired by a specific foraging behavior of real ant colony which is able to find if not the shortest, at least a very good path connects the colony’s nest with a source of food.[4] Ant as a single individual has a very limited effectiveness and a single ant acts randomly often leading to its own demise. When ants come together as a colony then they work towards the development of the colony. While designing an ACO based algorithm, it is often the robustness, adaptivity , self-organization and stigmergy properties that can be exploited.1.3 Artificial Ants
An artificial ant is mutant of real ant[5]. For applying ACO, the given problem is converted to weighted graph and an
Meenu Vijarania
Lecturer, CSE Dept. Amity University Haryana
Haryana,India
Karuna Rani
M.tech Student, CSE dept. Amity University Haryana
artificial ant can be defined as lightweight software mobile agent implemented as intelligent control packet responsible for discovering an optimal path between source and destination node[6]. An artificial ant is typically realized as a simple program consisting of simple procedures that simulate the laying and sensing of pheromone, and data structures that record the nodes that it visits.
1.4 Load Balancing in Telecommunication
Network
The word tele means to communicate at a distance and Telecommunication network is a collection of terminals, connected nodes and links, through which end users of terminal can communicate[7].Example: telephony, telegraphy, computer network. With the growing importance of telecommunication and the Internet, more complex networked systems are being designed and developed.Load balancing helps in making networks more efficient by distributing the processing and traffic evenly across a network. Web servers often use load balancing to split the traffic load among several different servers. Available bandwidth can be used effectively in this way and access to the websites they host becomes faster[8]. In a large telecommunication network, there are many possible routes for routing calls and these calls are routed using intermediate nodes. It is thus possible to ease actual local congestion by routing calls via parts of the network which have unused capacity. Thus to decrease the no. of lost calls ,it becomes necessary to make system adaptive to changing load and routing schemes are developed accordingly .
1.5 Network performance Management
Performance management tries to monitor and control the network to ensure that it is running efficiently as possible. Performance management quantify performance by manipulating the following factors:1) Capacity: The network is a collection of several terminals, each terminal having a limited capacity. The performance management must ensure the optimum utilization of whole network and less number of call failure.
2) Traffic: Using ant routing table information we can measure the number of calls completed vs. number of hops consumed to complete the calls. When the system is heavily loaded, excessive traffic causes call blocking.
3) Throughput: Throughput in a network is number of hops consumed to route fixed number of calls through network[9]. Throughput increases when there is less load on the network. When load reaches its capacity, the throughput remains constant and then starts decreasing.
1.5.1
Analysis of network Performance with ACO
To achieve optimum performance, the factors upon which network performance of network depends can be altered in many ways. The concept of network routing algorithm can route the traffic through shortest path. The available congestion control techniques and routing algorithm works independently, but doesn't take into account robustness and load balancing.Thus ACO plays an important role in routing traffic dynamically and the call placed on network consumes less no. of hopes thus making the system efficient and achieves load balancing. Unlike using routing table, ACO uses virtual
pheromone tables that contains fields like- virtual pheromone probability and all connected neighboring nodes to select next possible node to move on. The ants traverse the path and leave a certain amount of pheromones concentration. The shortest path is selected based upon shortest trip time and more concentration of pheromone. Similarly, pheromone tables in ACO considers the virtual pheromone value and the node having more pheromone concentration stands out the chance of being selected than any other node[10]. A link-state deterministic algorithm is used by the ant before placing any call on network and each node owns a pheromone table for every other node present on the network.
2. PROBLEM DEFINITION
In this paper work, the problem under study is analysis of telecommunication network performance using ACO algorithm and to measure performance in terms of no. of hops consumed with the help of simulation. For this purpose a simulated network models routing of calls between nodes. The nodes carrying heavy traffic can attribute to more call failures. The simulator model supports a population of simple mobile agents called artificial ants with behaviors modeled on the pheromone laying abilities of real ants.
The artificial ants move across the network between randomly chosen pairs of nodes and node having more value of pheromone concentration is chosen as the next intermediate node to move on. Calls are routed on the same path traversed by the artificial ants or mobile agents. In this study, a proposed ACO algorithm for analyzing network performance will be presented, and then results of using the ant colony optimization (ACO) are compared with those achieved by using non ACO. The performance of the network is measured by the average no of hops taken to complete the calls which represent the metrics like throughput rate, bandwidth consumption and number of calls lost. The ACO technique is shown as a support to distributive system and it gives better results.
2.1 Proposed Algorithm
Forward ants :- Forward ant Fs→d travel from source to a randomly chosen destination node d throughout the network. Each forward ant contains the following fields; source id and destination id and stack memory. The Forward ants trace the shortest path and stores the list of visited nodes in its stack. When destination is reached then forward ant is transformed into backward ant and stack is transferred to backward ant. Backward ants :- The backward ant Bd→s uses the memory from the forward ant. The task of the backward ant is to update the routing by traversing same path but in opposite direction. When source node is reached then backward ant get die.
Forward ant (Sn, Cn, Dn) where Sn=source node, Cn=current node and Dn= destination node. s is the sum of probability of all connected neighboring nodes of for a given node κ. P(Nκ) represents the pheromone concentration of all neighboring nodes of a certain node κ. r represents a random number generated between 0 and s.
Step1. Initialize stack (a memory to hold statistics of visited nodes) with Sn.
Step3. If Cn == Dn, then generate backward ant and transfer stack to it and Exit.
Else
Push Cn to stack and forward ant is further launched to connected node by following step4 and 5.
Step4. Select the next node based on following steps: (a) Initialize s=0
for 1to N [ s= s + P(Nκ) ] write s
end loop; (b) Select r. (c) [Loop]
If s>r then Cn= = Sn Endif
Step5. EXIT
Backward ant (Sn , Cn , Dn) where Sn= source node , Cn= current node and Dn= destination node.Ᵽ_sn is the pheromone probability of selected node.s’ is the new sum obtained.
Step1. Backward ant pop the nodes from stack maintained by forward ant and move to next node towards source.
Step2. If Cn = =Sn, then backward ant die and go to step3.
Else
Change pheromone concentration in present table and go to step 1.
(a) Using random number generator initialize a value for variable new.
(b) Store the sum in variable s by adding pheromone probabilities of all links attached
to given node. (c) Ᵽ_sn = Ᵽ_sn + new
(d) s’ = s+ new (e) ratio r’ = s’ / s.
(f) Update each entry in pheromone table, multiplying it by r.
Stop Step3. EXIT
3.
SIMULATION
RESULTS
AND
ANALYSIS
Simulation is a problem solving technique in which time dependent behavior of a given system is observed with the help of some equations and using them in the model. Thus simulation is the process of designing a model of real system and performing experiments to understand the behavior of the system[11]. It is used to solve those real life problems that may take a lot of time, effort and include risk.In this way simulation provides reliability, convenience and flexibility. With the help of simulator , we can observe dynamic behavior of a model prepared for a real life system.
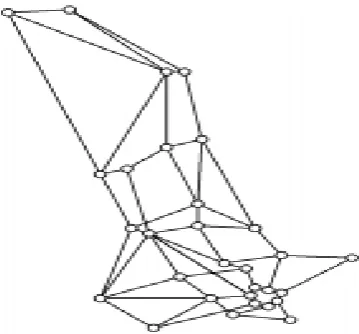
Simulation environment and assumption initialization: In this research work, a simulator is used by setting some parameters to run the simulator and simulation is based upon the network model used by Appleby and Steward in (Fig.1).
Fig 1: The Synchronous Digital Hierarchy network of British Telecom used for simulation
Simulator parameters set for the simulation process are as follows:
1) Check ACO mode On or Off. This will check simulation results based on varying ACO mode.
2) Simulation speed = 1000 ticks per sec.
3) Fixed number of calls to be routed for each simulation = 100,200,500,1000. We can vary the no. of calls as per the need.
4) Number of Synchronous calls that can be made = 60 calls.
5) Average duration of a call while each simulation = 170 time steps.
6) Node capacity for every node = 40.
The simulator is developed in .NET using C# language for deeper analysis of the factors of the ACO based algorithm,to implement routing calls startergy and performance analysis of a switched-based telecommunication network. To run the simulator, first ACO mode is checked, if the value is no then simulation is run using the existing pheromone table otherwise using ACO algorithm and following steps are followed:
For routing calls in telecommunication network, mobile agents are launched throughout the network to select an optimal path which is short as well as less congested and as these mobile agents move down to their path, updation takes place in the ant routing table according to the higher pheromone probability marked on the selected shortest path.
Simulator is run till the number of calls to be made gets completed. To show the output of simulation, graphs are used and these graphs are drawn between average no. of hops consumed in call routing and no. of completed calls. Thus to make different observations about the network
[image:3.595.318.498.80.247.2]Graphs, a pictorial representation of collected data are an appropriate way to analyze any heap of data. Charts are even easier than that of tabulation method, where data is represented in a 2-D matrix. Line charts get directly plotted when an experiment is performed. The graphs are plotted using charting dot com property of Microsoft visual studio platform. In order to make use of the mentioned property, it is necessary to have dot net charting Win forms.
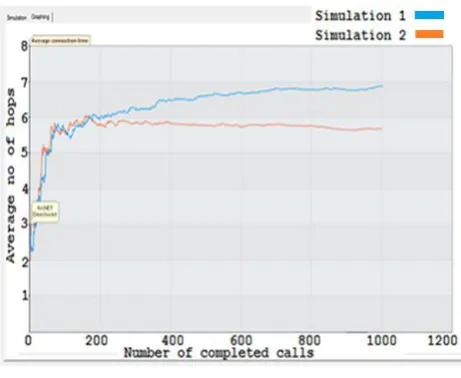
[image:4.595.318.555.127.306.2]Test 1: Number of calls to be made 500
Fig 2: Chart for simulation of 500 calls
The graph obtained has the following observations to be made:
Simulation 1 (Blue) - ACO mode Off Simulation 2 (Orange) – ACO mode On
The simulation performed with 500 calls shows that on completion of 500 calls , the result in terms of number of hops consumed is better with ACO mode than non ACO mode.
Test 2: Number of calls to be made 1000
Fig 3: Chart for simulation of 1000 calls
The graph obtained has the following observations to be made:
Simulation 1 (Blue) - ACO mode Off Simulation 2 (Orange) – ACO mode On
No. Of hops get reduced with increase in no. Of calls when ACO mode is on.
[image:4.595.57.275.190.364.2]Test 3: Number of calls to be made 5000
Fig 4: Chart for simulation of 5000 calls
Now we observe that simulation tests performed by increasing number of calls have outperformed with respect to average no. of hops consumed for routing of calls. This leads towards improvement in network performance as well as throughput. After observing changes in number of hopes with increase in number of calls made, now another test will be performed in which number of calls to be made is kept constant but the node capacity is altered.
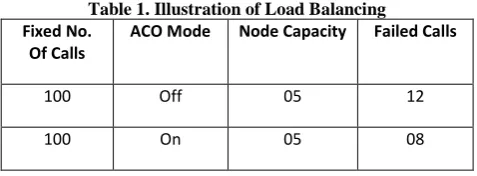
Test 4: Number of calls to be made 100 and node capacity is 05
Test4 shows that when node capacity is decreased then call gets failed. Because node is not capable of holding calls then it rejects to accept the connection. Hence calls get failed. But when ACO mode is on then less number of calls get failed as compared to non ACO mode .
4. CONCLUSION
One of the most occurring problem in telecommunication network is network congestion causing call failures. Thus there is a need to alleviate congestion effect and make it possible to explore new paths for routing of calls. The simulation tests are performed for performance measurement in terms of bandwidth usage and turnout. ACO algorithm is proposed combining with the routing scheme of a telecommunication network for the call routing strategy to find the most optimal path among various choices. The simulation results show that ACO outperforms than non ACO mode.
[image:4.595.56.287.501.690.2]Table 1. Illustration of Load Balancing Fixed No.
Of Calls
ACO Mode Node Capacity Failed Calls
100 Off 05 12
100 On 05 08
Furthermore we observe from Table1 that the proposed algorithm validate load sharing as well by reducing the number of call failures.
The two algorithms, ACO and non ACO are simulated on the same network with the same number of calls and the results show a great efficiency; the number of call failures without any load sharing is around 12 for 100 calls. The ACO with the optimized parameters gives around 8 failures for 100 calls.
REFERENCES
[1] http://www.sce.carleton.ca/netmanage/tony/swarm.html
[2] http://www.scholarpedia.org/article/Swarm_intelligence.
[3] www.slideserve.com/yael/bio-inspired-algorithms-in- robotics
[4] Marco Dorigo, Mauro Birattari, and Thomas St¨utzle Universit ´ e Libre de Bruxelles, Belgium 28 IEEE Computational Intelligence Magazine | November 2006 1556-603X/06©2006IEEE.
[5] Dorigo et al, M. Dorigo, V. Maniezzo, and A. Colorni. ,” Positive feedback as a search strategy” Technical Report 91-016, Dipartimento di Elettronica, Politecnico di Milano, Italy,1991.
[6] Beckers, R., Holland, O.E., & Deneubourg, J.L. , “ From local actions to global tasks:stigmergy and Collective Robotics”. In R.A. Brooks, & P. Maes(Eds.) Artificial Life IV, Cambridge, MIT Press. p. 181-189, 1994.
[7] http://www.umsl.edu/~joshik/msis480/chapt07.htm
[8] http://www.techterms.com/definition/loadbalancing
[9] Behrouz A. Forouzan, Data Communication and Networking, 4th ed., McGraw-Hill,2011.
[10] Richard S. Sutton and Andrew G. Barto. “ Reinforcement Learning: An Introduction”, Cambridge, MA: MIT Press, 1998
[11] System Simulation with Digital Computer: Books by Nar Singh Deon.
[12] Schoonderwoerd et al 97 R. Schoonderwoerd, O. Holland, J. Bruten, “Ant-like agents for load balancing in telecommunications networks”.Hewlett-Packard Laboratories, Bristol-England, 1997
[13] D. Subramanian, P. Druschel, and J. Chen.(1997), “ Ants and reinforcement learning: A case study in routing in dynamic networks”. In Proceedings of IJCAI-97, International Joint Conference on Artificial Intelligence, pp.832–838. Morgan Kaufmann, 1997.
[14] B. Baran and R. Sosa., “ A new approach for AntNet routing”. In Proceedings of the 9th International Conference on Computer Communications Networks, Las Vegas, USA, 2000..