Analysis of Detection of Multiple Attackers in Wireless
Networks
Pornima K.Girwalkar
PG Student M.B.E.S’s College of Engineering, Ambajogai
Maharashtra
B.M. Patil
Professor
M.B.E.S’s College of Engineering, Ambajogai Maharashtra
ABSTRACT
Wireless networks are usually deployed in hostile environment where an adversary can masquerade some internal nodes which may launch various inside attacks which may leads to reduction in network performance. Although the identity of a node can be verified through cryptographic authentication, conventional security approaches are not always desirable because of their overhead requirements. In this paper one method is used based on spatial correlation of Received signal strength of each node to find out the presence of attack and a cluster based mechanism is used to find out number of attackers. An efficiency based RADAR gridded algorithm is used further to localize the no of attackers in the network. Experimental evaluation is carried out using two test simulations of IEEE 802.11 and Zigbee networks. The comparison shows that the packet overheads are lesser as compared to other schemes. It has been observed that packet delivery ratio and end to end delay increases as increase number of nodes while energy decreases with optimal point.
Keywords
Wireless Network Security, Attack Detection, RSS value, Localization etc.
1.
INTRODUCTION
We ask that Wireless networks have displaced the well established and widely deployed wired communication networks of the past. Also, the reliability of wireless communication has improved significantly and is reflected in its application to areas such as police radio, military communication, and disaster recovery services. This reliability is not only reflected in such public safety applications, but also in many civilian applications [1]. Similarly, it is common to carry out a secure transaction over the Internet through a wireless local area network (WLAN). WLAN deployments based upon IEEE 802.11 standard are planned in many metropolitan areas.
ZigBee Network is based on an IEEE 802.15.4 standard. Though low-powered, ZigBee devices often transmit data over longer distances by passing data through intermediate devices to reach more distant ones, i.e., a network with no centralized control or high-power transmitter/receiver able to reach all of the networked devices. The decentralized nature of such wireless ad-hoc networks make them suitable for applications where a central node can't be relied upon. The explosive growth of 802.11b networks has coincided with an increased presence of security threats to these networks. A large proportion of these threats are in the form of spoof attacks or wormhole attacks. Due to the identity masquerading, Wireless networks are susceptible to the different types of network attacks. However, this same ease of
access and mobility can also be leveraged by malicious individuals to attack from the most unlikely of locations. Attacks on a wireless network can come from all directions and target at any node. Damages can include leaking secret information, message contamination, and node impersonation, sniff sensitive information, and access the internal network or attack wireless hosts without direct access to the network. All these mean that a wireless network will not have a clear line of defense, and every node must be prepared for encounters with an adversary directly or indirectly. Along with these issues, a wireless network has several special requirements that raise novel technical challenges such as network size, power constraints and energy consumption by nodes.
However, there is no perfect approach which has yet proven to be robust against all attacks. They can be combined to create more complex forms of attacks by flooding, packet dropping or manipulating nodes in the network. In the rest of this paper, we focus on the problem of detecting attacks on wireless networks. Attack Determination and localization can be done by various techniques. Many different types of approaches are available for security of network applications, some focus on energy saving, resource awareness or in-built security mechanisms. Cryptographic methods provide the strategic prevention and detection of attackers on account of identification and confidentiality of the network nodes.
2.
RELATED WORK
There are many approaches regarding wireless network security. The existing 802.11 security techniques such as including Wired Equivalent Privacy (WEP), WiFi Protected Access (WPA), or 802.11i (WPA2), these methodologies only protect data frames. But an attacker can still spoof management or control frames to cause significant impact on networks [2]. Traditionally cryptographic techniques are used for secure communications in wired and wireless networks. The asymmetric cryptography is widely used because it has the significant features like authentication, integrity, and confidentiality and simplicity for key distribution.
With regards to the cryptographic approach, Bing, Jie and Eduardo [3] have proposed one approach which is the centralized framework of public key infrastructure (PKI).By applying a secret and secure sharing scheme and an underlying multicast server group, a PKI is build. And after in SEKM, a view of the certification authority (CA) is created by the server group, which provides certificate update service for all nodes, including the servers themselves. In that a ticket scheme is introduced for efficient certificate service.
relationships during topology changes through an efficient handoff scheme, and provides data origin authentication for sensor data. It is not always desirable to apply these cryptographic methods because of its infrastructural, computational, and management overhead. Further, cryptographic methods are susceptible to node compromise, which is a serious concern as most wireless nodes are easily accessible, allowing their memory to be easily scanned.
For localizing the attackers one assumption is required that, all measurements gathered received signal strength (RSS) values are from a single station. Because of this assumption, localization algorithm matches with the point in the measurement space with a point in the physical space. To prevent and secure the network from spoofing, divided the techniques into three categories:
1. Sequence number analysis: In this method, the MAC address header is modified, so each device will have a serial number (SN).
2. Transceiver fingerprinting: In this method basic is each radio transceiver has its unique shape and pattern.
3. Signal strength analysis: This method depends on the strength of the coming signals from the clients.
Faria and Cheriton [5] proposes to detect spoofing attacks using a signal-print, which is the vector of median RSS for a MAC address measured at multiple AMs. They believed in that a transmitting device can be robustly identified by its signal print, a stream of signal strength values reported by access points acting as sensors. They restricted themselves to 802.11 networks, but as they said the ideas presented can be equally applied to other wireless LAN technologies.
The analysis of sequence number (SN) field in the MAC layer frame headers is a common method for spoofing detection [6], which assumes that a legitimate device produces a linear sequence of sequence numbers, and that an attacker cannot easily manipulate its own sequence numbers to match, because of firmware in the network cards. Since the SN counters in the attacker’s and victim’s cards are likely different, any abnormal SN gaps within the frame sequence from the same MAC address suggests a spoofing attack.
Madory proposed signal strength Fourier analysis (SSFA) for spoofing detection [7]. SSFA is based on the assumption that RSS values from one transmitter follow a fairly tight distribution, while during spoofing attacks the RSS values are interleaved from multiple sources. Sheng and Tan proposed one method of MAC spoof detection [8] which is based on the assumption that the attacker and the victim are separated by a reasonable distance, RSS can be used to differentiate them to detect MAC spoofing. This phenomenon was mainly due to antenna diversity, a widely-adopted technique to improve the stability and robustness of wireless connectivity .It is modeled with the RSS readings using a Gaussian mixture model.
3.
PROPOSED WORK
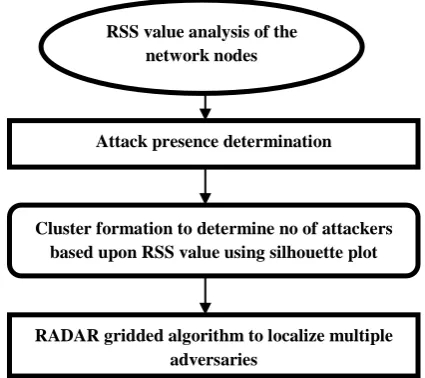
[image:2.595.314.527.73.262.2]This section of the paper describes the overview of the analysis of physical property of the nodes and about the RADAR gridded algorithm for localizing multiple adversaries. The problem can be defined in terms of modules as in figure 1.
Fig 1: Modules of the system
RSS values for each nodes are analyzed to determine presence of attack in the network. Based upon that clusters analysis determines the no of multiple adversaries and scen-matching RADAR gridded algorithm is used to find location information of the attacker nodes.
3.1
RSS Value Analysis
Received Signal Strength is a property of the wireless node closely correlated with location in physical space. This property is readily available in the existing wireless networks. As the RSS value reading is affected by random noise, multipath effects, and environmental bias, its reading is measured with respect to the reference points with known locations (i.e. Set of Landmarks) which is closely related to the transmitter’s physical location and is governed by the distance to the reference points [9]. The RSS readings at the same physical location are similar, whereas the RSS readings at different locations in physical spaces are distinctive. Thus, the RSS readings present strong spatial correlation characteristics [2].
Theoretically, RSS is a value vector as S = {S1, S2 ...Sn} where n is the number of reference/access points (APs).These points are monitoring the RSS of the wireless nodes to know their locations. Mathematically, the RSS at the ith Access point (AP) from a wireless node is log normally distributed as [10]:
(3.1)
Where represents the transmitting power of the node at the reference distance d0, dj is the distance between the wireless node j and the ith landmark, and γ is the path loss exponent, Xi is the shadow fading which follows zero mean Gaussian distribution with δ standard deviation [10]. It is assumed that wireless nodes have the same transmission power. Given two wireless nodes n1 and n2 in the physical space, then the RSS distance between two nodesn1 and n2 in space vector at the ith landmark is given by
(3.2)
where ΔX defines zero mean Gaussian distribution with the standard deviation of . The square of RSS distance in n-dimensional signal space (i.e. at n landmarks) is then calculated using the eq.(3.3),
RSS value analysis of the network nodes
Cluster formation to determine no of attackers based upon RSS value using silhouette plot
analysis
RADAR gridded algorithm to localize multiple adversaries
(3.3)
where with i = 1, 2..., n is the RSS distance at ith landmark and is given by equation (3.2).Based on the equations (3.2) and (3.3), when these two wireless nodes are at the same location, the distance in n dimension signal space follows a central Chi-square distribution χ2(n) with n degree of freedom. The probability density functions (PDF) of the random variable X = , which is the square distance in n dimensional signal space, when two wireless nodes are at the same location can be represented as [11]:
(3.4)
Where denotes the Gamma function, which has closed-form values at the half-integers. However, when these two wireless nodes are at different locations, becomes a non-central chi-square distribution with n degree of freedom and a noncentrality parameter λ, where
(3.5)
And with i = 1, 2 ...n., j = 1, 2, is the distance from jth wireless nodes to the ith landmark. The PDF of the random variable X = when two wireless nodes are at the different
locations can be represented as:
(3.6) Where is a modified Bessel function [10].
3.2
RADAR-Gridded Localization
Algorithm:
The RADAR-Gridded algorithm is a classification based scene-matching localization algorithm extended from [12]. In order to evaluate the generality for localizing adversaries, a representative localization algorithm based on nearest neighbor matching in signal space (RADAR Gridded) [12]. RADAR operates by recording and processing signal strength information at multiple base stations positioned to provide overlapping coverage in the area of interest. To determine user location, it requires the combination of empirical measurements with signal propagation modeling and thereby it enables location aware services and applications.
RADAR-Gridded uses an interpolated signal map, which is built from a set of averaged RSS readings with known (x, y) locations. Given an observed RSS reading with an unknown location, RADAR returns the x, y of the nearest neighbor in the signal map to the one to localize, where "nearest" is defined as the Euclidean distance of RSS points in an N-dimensional signal space, where N is the number of landmarks.
It is an improvisation over RADAR in which measurement area is sub-divided into a regular grid and the signal map provided in the offline phase is interpolated over the entire regular grid. The online phase is similar to RADAR with the exception that the “closest” finger-print in signal space is chosen from the interpolated signal map. This approach has an advantage of obtaining a much finer-grained resolution as the regions which are not covered by the signal map can also be returned as location estimates [13].
4.
PROBLEM FORMATION
4.1
Attack Determination:
A Silhouette Plot is a graphical representation of a cluster [14]. To determine the number of attackers, Silhouettes plot is constructed in the following way: the RSS sample points
(with N as the total number of samples) are the data set and let be its clustering into K clusters. Let be the distance between and .Let be the j-th cluster, j = 1... K, where
.The average distance between the i-th RSS vector in the cluster and the other RSS vectors in the same cluster is thus given by:
(4.1)
Further, the minimum average distance between the i-th RSS vector in the cluster and the and all the RSS vectors clustered in the clusters , k = 1,.., K, k ≠ j is given by:
(4.2)
Then the silhouette width of the i-th RSS vector in the cluster is defined as:
(4.3)
From the Equation (4.3), it follows that . So, defined silhouette plot of the cluster :
(4.4)
Hence, the global Silhouette index for partition p that partitions the data set into K clusters is given by:
(4.5)
Finally, Silhouette Coefficient SC is used to determine the number of attackers:
(4.6)
4.2
Silhouette Plot:
Fig 2: Silhouette Plot Construction
5.
SIMULATION ANALYSIS
For experimental observations (ns2) network simulation is used. NS is an object oriented discrete event simulator.
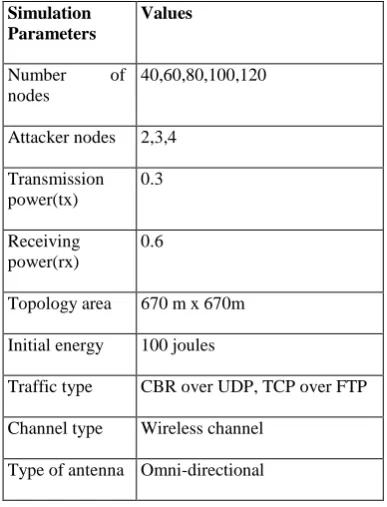
Table 1: Parameter Value
Simulation Parameters
Values
Number of nodes
40,60,80,100,120
Attacker nodes 2,3,4
Transmission power(tx)
0.3
Receiving power(rx)
0.6
Topology area 670 m x 670m
Initial energy 100 joules
Traffic type CBR over UDP, TCP over FTP
Channel type Wireless channel
Type of antenna Omni-directional
To validate this approach, experiments on two test beds through both an 802.11network (WiFi) and an 802.15.4 (ZigBee) network simulations shows the comparative performance analysis both the networks. The above table 1 shows the required parameter values during experimental evaluation. The results were analyzed by considering no of nodes 40, 60, 80,100,120. Experimentally, it is observed that the performance of Silhouette Plot in both networks is qualitatively the same. This detection mechanisms are highly effective in both detecting the presence of attacks with detection and its elimination by skipping the detected attacker node using rebroadcasting.
The System Evolution is a new method to analyze cluster structures and estimate the number of clusters [15]. The System Evolution method uses the twin-cluster model, which
are the two closest clusters (e.g. clusters a and b) among K potential clusters of a data set. The twin-cluster model is used for energy calculation. The Partition Energy Ep(K) denotes the border distance between the twin clusters, whereas the Merging Energy Em(K) is calculated as the average distance between elements in the border region of the twin clusters. The border region includes a number of sample points chosen from clusters a and b that are closer to its twin cluster than any other points within its own cluster. For instance, if cluster a contains total sample points, in the twin cluster model, a
will be partitioned into parts. Then the number of
sample points in the border region is defined as .The
same rule is carried out for its twin cluster b.
Thus the Partition Energy is computed by using the formula:
= = ,… ( , ) (5.1)
and the Merging Energy Em(K) as:
(5.2)
Where is the Euclidean/Pearson distance between the elements and in clusters a and b respectively. And , which are the elements in the border region of the twin clusters.
The basic idea behind using the System Evolution method to determine the number of attackers is that all the rest of clusters are separated if the twin clusters are separable. Starting from the initial state with K = 2, the algorithm works by changing the number of clusters in a data set through the partitioning process Ep(K) > Em(K) and the merging process Em(K) ≥ Ep(K) alternatively [2].The algorithm stops when it reaches a equilibrium state Koptimal, at which the optimal number of clusters is found in the data set: Koptimal = K, if Ep(K) > Em(K) and Ep(K + 1) ≤ Em(K + 1). Figure 2 presents an example of using the System Evolution method to determine the number of attackers in the 802.11 network.
C1
S1
C2
[image:4.595.70.264.313.567.2]Fig 3: Energy analysis for detection of no. of attackers
It shows the energy calculation vs. the number of attackers. The Koptimal is obtained when K = 4 with Ep(4) > Em(4) and Ep(5) < Em(5) indicating that there are 4 adversaries in the network using the same identity to perform attack.
6.
COMPARISON ANALYSIS
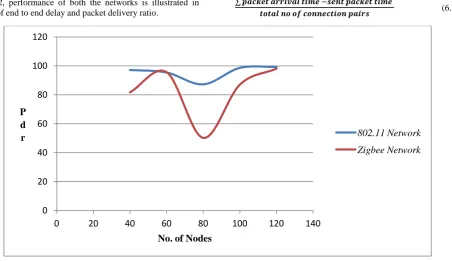
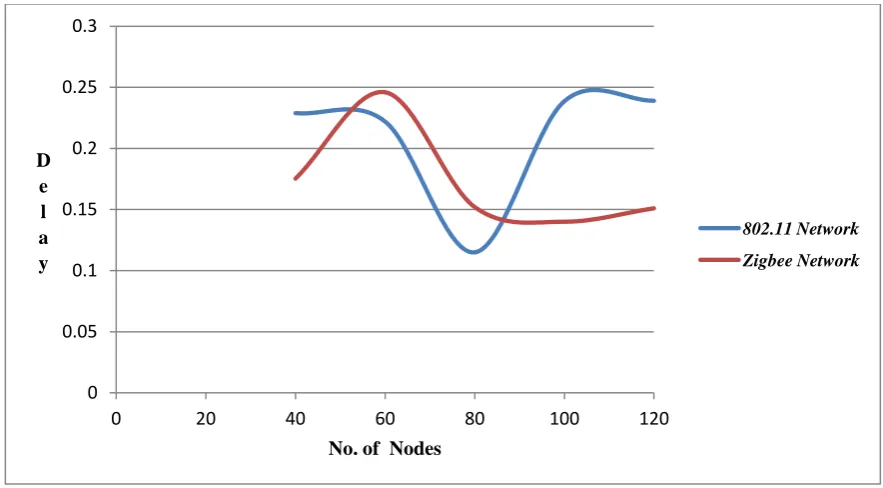
Zigbee networks are are based on IEEE 802.15.4 and these are more secured than the standard 802.11. Based on the eq.6.1 and 6.2, performance of both the networks is illustrated in terms of end to end delay and packet delivery ratio.
And packet delivery ratio refers to the no of packets received at the destination node over the no of packets sent by source. End-to-end delayrefers to the time taken for a packet to be transmitted across a network from source to destination. The lesser the value of packet delivery ratio means the better performance of the network
(6.2)
Fig 4: Comparative Analysis of pdr with 4 attacker node
The greater the value of packet delivery ratio means the better performance of the network.
(6.1)
An equation (6.1) and (6.2) illustrates the end to end and pdr values. Fig 4 and 5 shows the comparative performance of
both the networks with respect to packet delivery ratio and end to end delay with 4 attacker nodes respectively. It is observed that the pdr values gradually increases end to end delay gradually decreases. It is also observed that the performance of Zigbee network is more efficient than 802.11
Partition Energy, 1.3 Merge Energy,
1.82
1 1.1 1.2 1.3 1.4 1.5 1.6 1.7 1.8 1.9 2
2 3 4 5 6
Energy
No of attackers
0 20 40 60 80 100 120
0 20 40 60 80 100 120 140 P
d r
No. of Nodes
802.11 Network
[image:5.595.80.533.395.656.2]Fig 5: Comparative Analysis of end to end delay with 4 attacker node
[image:6.595.57.277.390.536.2]standard network. Table 2 and Table 3 show the network performance of both the networks for simulation networks.
Table 2: Network performance of 802.11network
No. of nodes
Consumed Energy
Remaining Energy
pdr delay
40 381.66 3618.22 97.15 0.228
60 313.072 5686.92 95.40 0.222
80 77.799 7922.22 87.203 0.114
100 928.184 9072.815 98.612 0.238
120 1005.15 10994.85 99.27 0.239
Table 3: Network performance of Zigbee network
No. of nodes
Consumed Energy
Remaining Energy
pdr delay
40 37.299 3962.22 81.57 0.175
60 233.97 5766.92 95.66 0.246
80 24.621 7975.379 50.00 0.151
100 180.984 9819.015 87.074 0.410
120 1196.12 10803.35 99.27 0.239
7.
CONCLUSION
The experiments on two test bed simulations through both an 802.11network (WiFi) and an 802.15.4 (ZigBee) networks were analysed. Determining the number of adversaries is a
particularly challenging problem. For that purpose location information, a physical property associated with each node. Comparatively we found that Zigbee networks are more efficient for this approach.
The Received Signal Strength (RSS) which is related to the Physical-layer is most appropriate tool and it is hard to forge, in other words it can be used to detect such spoofing. Usually the distance between the attacker node and the original node can be estimated with median error. But this method is generic. We used the test statistic based on the cluster analysis of RSS readings. This approach can both detect the presence of attacks as well as determine the number of adversaries, so that to localize any number of attackers and eliminate them using rebroadcasting. The comparison shows that the packet overheads and delay are lesser in zigbee. This approach is Effective only when implemented by large number of networks and its deployment is costly. An advantage of this detection approach is that it requires no communication between nodes, which is a significant factor in minimizing the energy required.
8.
REFERENCES
[1] S. Pandey And P. Agrawal,” A Survey On Localization Techniques For Wireless Networks”, Journal Of The Chinese Institute Of Engineers, Vol. 29, No. 7, Pp. 1125-1148 (2006).
[2] J. Yang and Y. Chen,” Determining The Number Of Attackers And Localizing Multiple Adversaries In Wireless Spoofing Attacks”, IEEE INFOCOM 2009.
[3] B. Wu, J. Wu, E. Fernandez and S. Magliveras, “Secure and Efficient Key Management in
Mobile Ad Hoc Networks,” In Proc. IEEE IPDPS, 2005.
[4] M.Bohge and W.Trappe, “An Authentication Framework For Hierarchical Ad Hoc Sensor Networks,” In Proc. ACM Workshop on Wireless Security (WiSe), 2003, pp. 79–87.
[5] D. Faria and D. Cheriton, “Detecting Identity-Based Attacks In Wireless Networks Using Singal-Prints,” In
0 0.05 0.1 0.15 0.2 0.25 0.3
0 20 40 60 80 100 120 D
e l a y
No. of Nodes
802.11 Network
[image:6.595.54.278.571.733.2]Proc. ACM Workshop on Wireless Security, Sept. 2006, pp. 43–52.
[6] F. Guo and T. Chiueh, “Sequence Number-Based MAC Address Spoof Detection,” In Proc. 8th International Symposium on Recent Advances in Intrusion Detection, Seattle, WA, USA, Sept. 2005.
[7] D. Madory, “New Methods Of Spoof Detection In 802.11b Wireless Networks,” Hanover, NH: M. Eng. Thesis, Dartmouth College, 2006.
[8] Y. Sheng, K. Tan, G. Chen, D. Kotz, and A. Campbell, “Detecting 802.11 MAC layer spoofing using received signal strength,” in Proc. IEEE INFOCOM, April 2008.
[9] Y. Chen, J. Francisco, W. Trappe, and R. Martin, “A Practical Approach To Landmark Deployment For Indoor Localization,” In Proc. IEEE SECON, September 2006.
[10]A. Goldsmith, “Wireless Communications: Principles and Practice,” New York, NY, USA: Cambridge University Press, 2005.
[11]M. Abramowitz and I. Stegun, “Handbook of Mathematical Functions with Formulas, Graphs, and Mathematical Tables”, New York: Courier Dover, 1965.
[12]P. Bahl and V. Padmanabhan, “RADAR: An In-Building RF-Based User Location and Tracking System,” In Proc. IEEE INFOCOM, 2000.
[13]G. Chandrasekaran, M. Ergin and J. Yang, “Empirical Evaluation of the Limits on Localization Using Signal
Strength” WINLAB, Rutgers
University,available:http://citeseerx.ist.psu.edu/viewdoc/ download?doi=10.1.1.157.9222.
[14]P. Rousseeuw, “Silhouettes: A Graphical Aid To The Interpretation And Validation Of Cluster Analysis,” Journal of Computational and Applied Mathematics, vol. 20, no. 1, pp. 53–65, November 1987.