N A N O E X P R E S S
Cavity Enhancement of Single Quantum Dot Emission in the Blue
Robert A. Taylor•Anas F. Jarjour •Daniel P. Collins• Mark J. Holmes•Rachel A. Oliver•Menno J. Kappers• Colin J. Humphreys
Received: 19 November 2009 / Accepted: 10 December 2009 / Published online: 27 December 2009
ÓThe Author(s) 2009. This article is published with open access at Springerlink.com
Abstract Cavity-enhanced single-photon emission in the blue spectral region was measured from single InGaN/GaN quantum dots. The low-Q microcavities used were char-acterized using micro-reflectance spectroscopy where the source was the enhanced blue output from a photonic crystal fibre. Micro-photoluminescence was observed from several cavities and found to be*10 times stronger than typical InGaN quantum dot emission without a cavity. The measurements were performed using non-linear excitation spectroscopy in order to suppress the background emission from the underlying wetting layer.
Keywords InGaNQuantum dotSingle-photon source
Microcavity
Introduction
In recent years, the use of III-nitride semiconductor materials in optoelectronic devices has grown significantly in step with the ability to control and manipulate their material properties. Commercial applications based around the white and blue–violet light-emitting diodes and edge-emitting laser diodes [1] have attracted much interest along with the demonstration of room temperature optically pumped vertical-cavity surface-emitting lasers (VCSELs) [2]. Recent advances in the growth of uniform epitaxial
nitride layers has enabled a significant increase in the obtainable Q factors of planar microcavities with lattice-matched layers of AlInN/GaN serving to reduce the inho-mogeneity seen in other distributed Bragg reflector (DBR) designs [3].
High-quality nitride microcavities have numerous applications in the fundamental study of room temperature light–matter interactions [4, 5]. The quantum dot (QD)-embedded micropillar device remains one of the most easily realized candidates for quantum-optical studies of semiconductors due to their potential for acting as non-classical light sources [6,7]. Their small mode volume and relative ease of fabrication using novel etching tech-niques [8] naturally allow the study of cavity quantum electrodynamical phenomena such as the Purcell effect and the strong-coupling between cavity mode and two-level emitter.
Nitride-based QDs possess various unique properties that distinguish them from other materials. In particular, GaN QDs have been demonstrated to provide an ultraviolet single-photon source up to *200 K [9]. Furthermore, the InGaN/GaN family of QDs has the potential of completing the visible spectrum as their emission can be tuned in the blue and green spectral region by changing the alloy content. The access to this wavelength range may prove particularly useful for free-space cryptography. It also corresponds to the range where the commercially avail-able ultrafast single-photon detectors are most sensitive. Moreover, the strong piezoelectric field present in these structures result in a spatial separation of the electrons and holes, which also allows the emission energy to be tuned over a large spectral range of up to 100 MeV by applying an external electric field [10]. It should be noted that it is difficult to grow layers with a substantial indium content because of the large lattice mismatch. Recent growth R. A. Taylor (&)A. F. JarjourD. P. CollinsM. J. Holmes
Clarendon Laboratory, Department of Physics, University of Oxford, Parks Road, Oxford OX1 3PU, UK
e-mail: r.taylor1@physics.ox.ac.uk
R. A. OliverM. J. KappersC. J. Humphreys
efforts have also centred on growing III-nitride quantum dots on non-polar surfaces, thus reducing the effects of the in-built piezoelectric field [11].
In this paper, we report on investigations of low-Q mi-crocavities necessary to improve the extraction efficiency for the detection and emission of single photons in the blue spectral region from single InGaN/GaN QDs. Previous studies into the performance of epitaxially grown nitride Bragg stacks have shown marked differences between theoretical and experimental Q factors [12]. This has been attributed to the presence of dislocations in the nitride layers, which have a well-known detrimental effect on their structural and optical properties. We employ two different methods to study the small-scale fluctuations of our planar cavity Q factors based around micro-reflectance (lR) and micro-photoluminescence (lPL).
Sample Details
The samples were grown by metal–organic vapour phase epitaxy on a GaN pseudo-substrate. First, a 20-period AlN/ GaN DBR structure was grown. The target thickness of the GaN layers was 45.5 nm and that of the AlN layers was 51.3 nm. The DBR was designed to have a maximum reflectivity of*95% at 435 nm. Above the final AlN layer, a 91-nm GaN spacer was grown followed by a QD layer. The QD formation is induced via the ‘‘modified droplet epitaxy’’ process [13]. The QD layer was then capped with a 91-nm GaN layer. In order to complete the cavity structure, either a 3- or 8-period SiOx/SiNxtop DBR was deposited on the final structure by plasma-enhanced chemical vapour deposition. The thicknesses of the SiOx and SiNxlayers were 73 and 56 nm, respectively, and the 3-period DBR was designed to have maximum reflectivity of*60% at 435 nm. The QD layer was hence designed to be in the middle of a low-Qk-cavity wherek =435 nm, whose role is to increase the extraction efficiency of the QD emission.
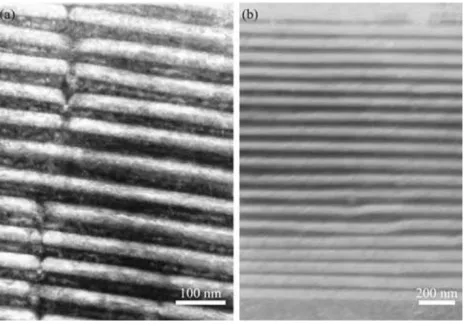
Figure1shows cross-sectional TEM images of the AlN/ GaN DBR (for k0=435 nm). V-shaped cracks can be
clearly made out in the AlN layers (lighter contrast) which are filled in with GaN. The appearance of these can be attributed to the tensile strain in the AlN grown on GaN. Furthermore, some of these layers are observed to be bent as can be seen from Fig1b. The origin of this is not yet well understood but these imperfections naturally lead to a variation in uniformity in the layer thicknesses and hence almost certainly reductions in reflectivity. Similarly, the propagation of these structural defects through the DBR to the GaN spacer layer means that the dots are grown on a more uneven layer, which has the potential to induce additional strain during their formation.
The rough nature of the final GaN layer made it nec-essary to use a SiO2/Si3N4 DBR as the top cavity mirror
since an attempt to grow AlN/GaN would lead to a very poor quality reflector. This first generation of sample was designed to increase extraction efficiency of dot emission, which would help decrease accumulation time in Hanbury– Brown and Twiss experiments. As such, these provide useful tests of our experimental method with the intention of comparing the results to future high-Q lattice-matched samples with incorporated QDs.
Micro-Reflectance
For the micro-reflectance measurements, we used the output from a commercially available, blue-enhanced photonic crystal fibre (PCF), which acted to a good approx-imation as a spectrally flat, coherent point source. In order to generate the highly non-linear output at the wavelengths of interest (*450 nm), it is necessary to pump the fibre using high peak-power near infrared pulses of the order of 150 fs in duration.
Due to the complex nature of supercontinuum genera-tion in the ultraviolet and blue regions of the spectrum, it is extremely difficult to obtain a truly flat spectrum. For our purpose, we need a strong and relatively stable output that covers the stop band of the DBR mirrors enabling the cavity mode to be seen in reflectance. The fluctuating nature of the generated light meant that for individual Q measurements we used a control sample with a known, flat reflectance that was used as our normalizing signal for the fibre. Switching from cavity sample to control allows us to identify actual sample dependent features in the signal. Figure2a shows a typical measurement from a random point on the surface, approximately 2lm in diameter. The
Fig. 1 Cross-sectional TEM images of an AlN/GaN DBR at a design
[image:2.595.310.542.58.221.2]slightly red-shifted cavity mode can clearly be seen and has been fitted with the expected Lorentzian to give a Q factor of 167. Theoretical predictions using both transfer matrix and finite difference methods lead us to expect a value closer to 800, which is over a factor of two larger than the highest value found experimentally. For cavities with a 3-layer top DBR, the average Qvalue was*50, and for the 8-period DBRQvalues varied from 40 to 180 over the surface of the sample studied. The micro-reflectance technique can also be used to produce reflectance maps of 10lm910lm regions of the sample, as is shown in Fig.2b for the DBR without the top mirrors added; a crack in the mirrors running diagonally across the figure can be resolved clearly.
Micro-Photoluminescence
Micro-photoluminescence (micro-PL) measurements were performed using non-resonant non-linear spectroscopy. In this technique, the excitation energy falls in the bandgap of the structure, and hence only transitions by multiple-photon absorption are possible. We have found [14] that such excitation results in almost total suppression of the back-ground emission from the underlying wetting layer and yet relatively strong QD emission can still be observed. This is very important in the present study since the photons related to this background would mask the signature of single photons emitted from the QD. Another advantage of this technique in the current study is that it allows for wide separation between the excitation and collection wave-lengths. Non-linear excitation was achieved using 1-ps pulses from a Ti:sapphire laser followed by a pulse-picker in order to reduce the repetition rate. A 509 achromatic objective was used to focus the laser to a spot of*1lm. This, together with non-linear excitation, gave sufficient spatial resolution to resolve single QDs. The PL was col-lected using the same microscope objective and separated by a dichroic mirror from the excitation path. The
reflection of the mirror was *100% for the QD emission wavelength, and its transmission was*100% for the laser wavelength. This allows for the separation of the excitation and collection paths with very little loss of the collected photons. Time-integrated spectra were recorded using a cooled CCD mounted on a 0.3 m spectrometer with a 1,200 g/mm grating.
Photon-correlation measurements were performed by sending the spectrally filtered PL to a Hanbury-Brown and Twiss (HBT) interferometer. It consisted of a 50/50 beamsplitter and two photomultipliers, each with a time resolution of*150 ps. A time-correlated single-photon counting module was then used for time-resolved and photon-correlation measurements. The experiment was performed at 4.2 K using a continuous-flow cryostat.
Figure3 shows a micro-PL spectrum from the 3 top DBR sample under an excitation at 814 nm. Strong emis-sion is observed in the spectral range corresponding to the cavity mode. In particular, the intensity of the QD emission at 437.8 nm is found to be more than 2,000 counts/s which is a factor of 10 stronger than any typical InGaN QD emission from samples grown with similar methodology but without a cavity. The inset in Fig.3 shows time-resolved measurements on the studied QD. The decay trace fits well with a single exponential and the lifetime is found to be 7.7±0.1 ns. This relatively long lifetime suggests that no Purcell effect is observed. Cavities with higher Q factors are probably needed for this effect to be observed given the reduced oscillator strength in nitride-based QDs in general.
[image:3.595.164.547.60.216.2]A photon-correlation spectrum from the QD under consideration is shown in Fig.4 together with the corre-lation function of the laser light measured under the same conditions. It is well known that for a single-photon source the second-order correlation function g(2)(t) vanishes for a time delay oft=0. This is observed to be the case as the peak at t =0 is completely suppressed. We have carried out similar measurements on several QDs in this sample and we always observed values for g(2)(0) less than 0.3.
Fig. 2 aNormalized
These findings demonstrate blue single-photon emission from InGaN QDs. It should be noted, however, that the observed lifetimes are relatively long compared to other materials. We have observed single-photon emission from QDs with lifetimes up to 60 ns. Such long lifetimes are attributed to the reduced oscillator strength due to the internal piezo-electric field present in nitride materials. We have found [15], however, that it is possible to reduce the lifetime by more than a factor of 2 when the internal field is partially compensated by an applied electric field. More-over, the lifetime can be reduced by the Purcell effect when the QDs are embedded in high-Q microcavities. Hence, this should not, in principle, limit the potential of InGaN QDs as single-photon sources. It should be noted that early
studies of recombination dynamics in ensembles of InGaN QDs reported complex behaviour exemplified by non-exponential decay traces [16, 17]. It was then found that this behaviour was mainly due to the contribution of the wetting layer [14,18]. In this context, the demonstration of single-photon emission provides unambiguous evidence of recombination from a two-level-like system, therefore, supporting the previous explanation.
Conclusions
We have studied the optical properties of planar nitride DBR cavities and demonstrated single-photon emission from cavity-enhanced singe InGaN quantum dots. Through the use of a blue-enhanced supercontinuum generated in a PCF, we have been able to obtain reflectance measure-ments from areas on the order of a few lm2. Whereas
macro-reflectance values imply a Q factor of approxi-mately 50, the increased spatial resolution of the point source highlights the inhomogeneity of the cavity struc-tures showing regions with both higher and lowerQvalues. By embedding a quantum dot layer in these microcavities, an enhancement in the collection efficiency was found, and the emission of the underlying wetting layer was sup-pressed by using non-linear spectroscopy.
This research is part of the QIP IRC (www.qipirc.org) supported by EPSRC (GR/S82176/01). We also acknowl-edge funding from the Clarendon Fund and the ORS scheme (AFJ), and from the Royal Society (RAO).
Open Access This article is distributed under the terms of the
Creative Commons Attribution Noncommercial License which per-mits any noncommercial use, distribution, and reproduction in any medium, provided the original author(s) and source are credited.
References
1. S. Nakamura, S. Pearton, G. Fasol, The blue laser diode (Springer, Berlin, 2000)
2. E. Feltin, G. Christmann, J. Dorsaz, A. Castiglia, J.-F. Carlin, R. Butte´, N. Grandjean, S. Christopoulos, G. Baldassarri Ho¨ger von Ho¨gersthal, A.J.D. Grundy, P.G. Lagoudakis, J.J. Baumberg, Electron. Lett.43, 17 (2007)
3. G. Christmann, D. Simeonov, R. Butte´, E. Feltin, J.-F. Carlin, N. Grandjean, Appl. Phy. Lett.89, 261101 (2006)
4. F. Semond, I.R. Sellers, F. Natali, D. Byrne, M. Leroux, J. Massies, N. Ollier, J. Leymarie, P. Disseix, A. Vasson, Appl. Phys. Lett.87, 021102 (2005)
5. H. Lohmeyer, K. Sebald, C. Kruse, R. Kro¨ger, J. Gutowski, D. Hommel, J. Wiersig, N. Baer, F. Jahnke, Appl. Phys. Lett.88, 051101 (2006)
6. J.P. Reithmaier, G. Se˛k, A. Lo¨ffler, C. Hofmann, S. Kuhn, S. Reitzenstein, L.V. Keldysh, V.D. Kulakovskii, T.L. Reinecke, A. Forchel, Nature (London)432, 197 (2004)
Fig. 3 Micro-PL spectrum under non-linear excitation recorded at
4.2 K. The excitation wavelength is 814 nm, and the average excitation power is 6.3 mW at a repetition frequency of 19 MHz. The inset shows the time-resolved emission spectrum of the QD whose emission is at 437.8 nm. Thecontinuous lineis a least-square fit with single exponential
-100 -75 -50 -25 0 25 50 75 100 125 0
20 40 60 80 100 120
Coincidences (counts)
Time (ns)
Fig. 4 Photon-correlation spectrum (black trace) of the QD shown in
[image:4.595.52.287.53.222.2] [image:4.595.55.288.307.485.2]7. J.M. Ge´rard, B. Sermage, B. Gayral, B. Legrand, E. Costard, V. Thierry-Mieg, Phys. Rev. Lett.81, 1110 (1998)
8. A. Dousse, L. Lanco, J. Suffczyn´ski, E. Semenova, A. Miard, A. Lemaıˆtre, I. Sagnes, C. Roblin, J. Bloch, P. Senellart, Phys. Rev. Lett.101, 267404 (2008)
9. S. Kako, C. Santori, K. Hoshino, S. Go¨tzinger, Y. Yamamoto, Y. Arakawa, Nat. Mat.5, 887 (2006)
10. T. Nakaoka, S. Kako, Y. Arakawa, Physica E32, 148 (2006) 11. L. Lahourcade, S. Valdueza-Felip, T. Kehagias, G.P.
Dimit-rakopulos, P. Komninou, E. Monroy, Appl. Phys. Lett. 94, 111901 (2009)
12. E. Feltin, R. Butte´, J.-F. Carlin, J. Dorsaz, N. Grandjean, M. Ilegems, Electron. Lett.41, 94 (2005)
13. R.A. Oliver, G.A.D. Briggs, M.J. Kappers, C.J. Humphreys, J.H. Rice, J.D. Smith, R.A. Taylor, Appl. Phys. Lett.83, 755 (2003)
14. A.F. Jarjour, A.M. Green, T.J. Parker, R.A. Taylor, R.A. Oliver, G.A.D. Briggs, M.J. Kappers, C.J. Humphreys, R.W. Martin, I.M. Watson, Physica E32, 119 (2006)
15. A.F. Jarjour, R.A. Oliver, A. Tahraoui, M.J. Kappers, R.A. Taylor, C.J. Humphreys, Phys. Rev. Lett.99, 197403 (2007) 16. I.L. Krestnikov, N.N. Ledentsov, A. Hoffmann, D. Bimberg, A.V.
Sakharov, W.V. Lundin, A.F. Tsatsulnikov, A.S. Usikov, Z.I. Alferov, Y.G. Musikhin, D. Gerthsen, Phys. Rev. B66, 155310 (2002)
17. A. Morel, M. Gallart, T. Taliercio, P. Lefebvre, B. Gil, J. Allegre, H. Mathieu, B. Damilano, N. Grandjean, J. Massies, Phys. Stat. Sol. A180, 375 (2000)