Munich Personal RePEc Archive
Evaluating land administration systems:
a comparative method with an
application to Peru and Honduras
Bandeira, Pablo and Sumpsi, Jose María and Falconi, Cesar
Universidad Politencia de Madrid, Inter American Development
Bank
12 July 2008
Online at
https://mpra.ub.uni-muenchen.de/13370/
EVALUATING LAND ADMINISTRATION SYSTEMS: A
COMPARATIVE METHOD WITH AN APPLICATION TO
PERU AND HONDURAS
Pablo Bandeira1, José María Sumpsi1 and Cesar Falconi2
1
Universidad Politecnica de Madrid
2
Inter American Development Bank This version: July 2008
Abstract
This article develops a methodology for the evaluation of land administration systems. We propose a set of quantitative and qualitative indicators with benchmarks for each one of them that signal possible venues to improve the administration’s structure and budgetary/management arrangements, in order to bring about the following goals: (1) to contribute to public sector financing through taxes; (2) to encourage the productive and sustainable use of land, and (3) to facilitate access to land for low-income citizens. This methodology was applied to the cases of Honduras and Peru in order to refine our draft evaluation indicators, while evaluating the systems of both countries. Here we present the final refined indicators and benchmarks, and the conclusions from both case studies.
Keywords: land administration systems; cadastre; evaluation; performance indicators
1. Introduction
on land tenure, land use, and land value, we even extend the definition used by Dale and McLaughlin so as to also include land market regulations and land-related subsidies (land subsidies can be interpreted as a negative tax on land).
Also, the academic literature uses the term “land” with two different meanings. Land is often used as it is commonly known, i.e. as any part of the earth's surface not covered by a body of water. But it is sometimes used referring also to the buildings attached to it. In this article, we will use this second broader meaning because public administration laws, tools, policies and agencies normally target buildings and land as a whole.
Once we have defined the object of this paper, we need to address the question of why it is important to evaluate it. On the one hand, land is a crucial economic and social asset. For example, there is broad consensus on that access to shelter is a fundamental civil right, and one cannot conceive firms or investments without land. However, on the other hand, the need for a formal land administration system is subject to debate. There are, in fact, numerous studies that conclude that the formalization of land property rights does not have a significant economic or social impact in less developed regions, but which have developed sufficiently secure and transferable informal property rights (Migot-Adhola et al., 1993; Pinckney and Kimuyu, 1994; Katz, 2000; Otsuka and Quisumbing, 2001).
These results can be explained using the economic theory that tries to explain the fundamental mechanisms of economic development. In a less developed economy, where productivity and specialization are low and most exchanges take place on a personal basis, the need for a formal administration system is not demanding. However, in order to enhance specialization and productivity, and therefore economic development, it is necessary that market size grow based on impersonal exchanges. This, in turn, requires a formal public system that defines, regulates and enforces property rights so as to reduce transaction costs (North, 1990).
Having clarified the need for a public apparatus that administers the rights and obligations of an asset as fundamental to society as land is, it makes sense to consider whether this public apparatus is functional or not and whether it is fulfilling the objectives for which it is designed.
study that included 17 developing countries and six developed countries. This was the first international survey to elaborate indicators on several features of land information systems that can be used to make comparisons. However, the study has three important shortcomings. First, it is based on the limited UN-ECE definition of the land administration system and hence it does not include indicators related to key intervention and regulation tools that a government has. Secondly, the study uses a set of qualitative indicators with open questions lacking a benchmark framework. As a consequence, the qualitative section is basically descriptive, and cannot be used to derive policy conclusions regarding effectiveness or efficiency of the systems. Finally, while the study includes a set of quantitative indicators supported by an explicit benchmark framework, the data required for these indicators is difficult to collect, and is not available in most of the developing countries included in the sample (see Burns et al, 2006).
The other study was jointly developed by the Melbourne University, the United Nations General Secretariat, and the International Federation of Surveyors (see Rajabifard et al, 2007 and http://www.cadastraltemplate.org). This research project used both quantitative and qualitative indicators to compare the national administration systems of 42 countries. Same as above, the project is restricted to the analysis of the information system, and it does not include a benchmark framework that would allow obtaining policy implications from the qualitative and quantitative indicators. However, in this case most quantitative data from developing countries is available, resulting in a useful descriptive study of the land information systems of 42 countries from the five continents.
Finally, it is also worth mentioning the creation in 2004 of The Inter-American Alliance for Real Property Rights, financed by the USAID. The Alliance seeks, among other goals, to evaluate the land administration systems of the Latin American and Caribbean countries. In so doing, it has developed an evaluation tool with many indicators, the so called Alliance Blueprint, but there are no final results publicly available yet. In any case, the Blueprint has the same problems as the ones already mentioned (see http://www.landnetamericas.org).
and qualitative indicators which can be easily collected in developing countries, and comparing each one of them with an explicit benchmark.
The principal goal of this article will be to provide an evaluation methodology that enables the identification of aspects from national land administration systems subject to improvement according to international standards. The most important novelty is the use and justification of benchmarks for each indicator. Some of them can certainly be subject to criticism, but we believe that making them explicit is a necessary step in order to be able to derive policy implications from these types of studies. Actually, we believe that a debate on the benchmarks could move forward the applied research agenda related to land administration. This article aims to be a step in this direction.
The methodology is then applied to Honduras and Peru in order to obtain specific policy conclusions for these countries, but also in order to test and refine the methodology itself.Due to space constraints, we only include the main conclusions and recommendations from these case studies. Readers interested on them can contact the corresponding author to receive full versions, written in Spanish. Since the most important bottlenecks found were similar for both countries, we find it plausible that other developing countries face similar problems, and therefore we have included some final practical recommendations to improve land administration systems.
2. A methodological approach to evaluate national land administration systems
A study that seeks to evaluate a system must start defining the main goals or results
expected from the system, as well as the tools available to reach them. In our case, we present three results and four tools. The three results are as follows: (1) to contribute to public sector financing; (2) to encourage the productive and sustainable use of land, and (3) to facilitate low-income groups’ access to land (including shelter). The available tools are: taxes, subsidies, regulations and the land information system. The first three tools are related to government intervention while the Registry and the Cadastre are the public information tools that enable the entire system to function properly (see box 1).
2.1. First part: the description of the land administration system
Box 2 contains the index that we have used to carry on the description of the land administration system for each country. The first section summarizes how the government functions, paying special attention to the degree of government and fiscal decentralization. The goal is to explain the institutional framework in which the land administration system is inserted. The first chapters describe the government system at the supranational, national and sub-national levels, indicating principal responsibilities and available budgets for each level. The chapter on government financing breaks down the public budget, differentiating at least between own revenues, transfers from other government levels, and from public debt.
The second section describes the situation of land use, land access and land markets. The chapter on land use describes the evolution of agricultural, livestock, forestry, agro forestry, water, artificial, and any other soil potential use areas. The principal features that we will try to analyze is whether there has been an intensification process of land use (towards more intensive crops or towards artificialization) and, if data on the optimum potential uses of the land is available, the quantification of land under and over exploitation.
Box 1. Land administration system: Objectives and tools
Objectives or expected Tools:
outcome:
Intervention Information
Box 2. Index for the description of the land administration system
SECTION I: STATE STRUCTURE AND FINANCING
1. Introduction: bases and political organization of the national government 1.1. Legislative power
1.2. Executive power 1.3. Judicial power 2. Territorial division of the state
2.1. The regional administration 2.2. The local administration
2.3. Membership in international bodies 3. State financing
3.1. Central state financing 3.2. Regional state financing 3.3. Local state financing
SECTION II: ACCESS TO LAND, LAND USE AND LAND MARKETS 4. The use of land
5. Access to land and land markets
5.1. Access to rural land and rural land markets 5.2. Access to urban land and urban land markets
SECTION III: THE LAND ADMINISTRATION SYSTEM 6. The Land Registry
6.1. Historical evolution 6.2. Current functioning 7. The Cadastre
7.1. Historical evolution 7.2. Current functioning
7.3. Cadastral value assessment 7.4. Cadastral data updating
On the chapter on access to land and land markets, both urban and rural, we look for data on the proportions of each tenancy option (ownership, lease, or possession), and of each access option (inheritance, sale, public project, squatting, handed over or lease). We also try to include information on the evolution of average prices and on the percentage of households that engage in sale and rental transactions. Finally, we search for data on the proportion of households who lack access to rural land and urban housing. All this information will be used in order to gain knowledge regarding access types and problems, degree of land market activity, and evolution of prices versus headline inflation.
Once general state functioning has been described, and land access, transfer, and use problems identified, the third part describes the national land administration system. Several chapters in this section begin with an overview of the historical process, in order to enhance our understanding of the problems related to institutional change. The chapter on the land Registry (also called the Juridical Cadastre) begins describing its origins, the evolution of the register’s and notary public’s roles, and the requirements needed for title registration. It then describes in greater detail the current operation of
8. Land taxes
8.1. National land taxes 8.2. Regional land taxes 8.3. Local land taxes 8.4. Land tax collection 9. Land subsidies
9.1. Historical evolution 9.2. Current description 10. Access to land policies
10.1. Agrarian reforms
10.2. Access to housing policies 11. Land market regulation
11.1. Land sales markets legislation 11.2. Land rental markets legislation 11.3. Donation and inheritance legislation 12. Land use regulation
12.1. National land use planning
the Registry, focusing on: its position within the general public administration, registration principles, types of documents that can be registered, requirements for first time registration (adjudication of title) and transfer registration, type of information registered, registration costs, and technologies available to facilitate information to citizens.
The chapter on the Cadastre (also called the Fiscal Cadastre) also begins with a historical overview that includes its origins, the technology used, and the type of collected data. In order to describe its current performance we study its organizational structure and responsibilities, the type of data collected, its coverage, the administrative use of the cadastral reference, and the currency of photographic and digitalized data. We also include subsections that illustrate how cadastral value assessments, ownership and use updates, and coordination with other spatial information systems are conducted by the Cadastre.
The chapter on taxes describes all taxes levied on land, specifying what administrative level is in charge of collection and how the tax base and applicable rates are calculated. We also include information on the available deductions and exemptions. Using the most recent data, we present information on the collection of each tax and their rate with respect to total tax collection by each administrative level. Finally, we classify taxes according to two levels: those that tax transfers and those that tax property on a yearly basis. When possible, the latter taxes are broken down into two categories: taxes on rural versus urban property, and taxes on property used as homestead versus taxes on property not used as homestead. All this information will be used to evaluate taxes, as we will see below.
The chapters on land-related subsidies and access to land policies briefly describe objectives, type of support (grant, subsidized credit, etc.), financing rules (eligibility criteria and the restrictions imposed on the beneficiaries), public budget that has been executed, obstacles to policy implementation, and outcomes attained from these policies (total number of beneficiaries, resulting land distribution, etc).
The chapter on urban and rural land market regulation analyzes the legislation that rules these markets. It is important to incorporate here the description of possible restrictions to transfers commonly imposed by public access program such as land reform and housing projects.
level (land use planning). We also indicate which public administrative level is responsible for the elaboration, financing, monitoring, and control of these plans, as well as current outcomes, and the interaction of land use planning with other policies with a territorial approach.
As we have already mentioned, the objective of this descriptive part is to understand how the land administration works and how has it come to work this way (section three), together with the description of the main elements on which the administration system tries to exert influence on (collection of land taxes, land use, land markets, and access to land; sections one and two).
2.2. Second part: the evaluation of land administration systems
One way to evaluate land administration systems could be based on the descriptive analysis summarized in the previous section. In this sense, we would try to relate current (or the evolution of) results on land taxes, land use, access to land, and land markets with the tools that the public administration has applied (Registry, Cadastre, taxes, subsidies, and regulations). However, this strategy would suffer from three important practical problems. First, much of the searched data on results described on the first and second sections will probably not be available for developing countries. Secondly, even when the data is available, we do not have known benchmarks for most of these results that would enable us to conclude whether goals had been achieved or not - for example, what is the optimum level of land market activity or access to land. Finally, even if we had the data and benchmarks related to results, it would be complicated to relate each result with a tool, since we often have several tools in place at any time, all of them influencing the same result. As a consequence, it is highly difficult in practice to categorically assert whether a tool is being effective or not.
Nevertheless, what we can do is to analyze each tool independently and assess whether it is contributing or not to the outputs or immediate goals - as against results - that the tool is designed to affect. In order to accomplish this it is necessary to build a set of qualitative and quantitative indicators for each tool as well as a benchmark for each indicator.
this issue, we compare the value for each country with the average and the standard deviation that the value shows in developed countries. This comparison enables us to determine whether a specific feature of the system is close or far from average developed country practice, which gives us an idea of the degree of development of that feature.
To develop this quantitative benchmarks we have used data compiled by international organizations such as the Organization for Economic Cooperation and Development (OECD), the International Monetary Fund (IMF), and the World Bank, as well as information gathered by other land administration international surveys, such as those mentioned at the introductory section of this article. It is important to highlight that for some variables the international information does not include all the developed countries or it does not exist at all. We solve this last problem by using data from Spain whenever there is no quantitative international data. We hope that the methodology proposed here serves as a basis for future case studies, which will give us more precise and universal quantitative benchmarks. In this study we specify the source of each benchmark so as to be accordingly cautious when interpreting outputs.
Finally, within each tool we isolate structural indicators from output indicators. The former provide information relative to the institutional design features of the tool. The latter evaluate the effectiveness or efficiency of each tool. This distinction allows us to discern whether it is necessary to undertake institutional changes (that generally involve legislation changes) from whether it is necessary to improve land administration agencies’ management practices or increase their budget. That is, if output values are far from the benchmark, but the institutional design is appropriate, we can conclude that it is necessary to improve management practices of the responsible agency and/or increase its public budget.
2.2.1. Best practice in land information systems
The information system is normally made up of the Registry (or Juridical Cadastre) and the Cadastre (or Fiscal Cadastre). The Registry is the database that compiles the information on the legal aspects of the property, including legal ownership, spatial extent, charges and liens. The Cadastre is the geographical and alphanumerical database that describes the features, use and spatial coordinates of land parcels, as well as the current “administrative ownership” of the land.
In many countries - mainly under common law - registering property is compulsory. In this case, administrative ownership equates legal ownership. However, in countries under civil law registration is voluntary, resulting in two different types of formal ownership: a legal one – recorded at the Registry - that will not encompass the entire territory, and an administrative one - recorded at the Cadastre - that includes (or aims to include) the totality of the national territory, in order to tax all land.
This information system must provide reliable and current information on land ownership, use, and value. This is so because only if we know who owns what, how much it costs and how it is being used, will the government be able to effectively and fairly raise land taxes, and enhance the social, economic and environmental sustainability of land use. Moreover, current and reliable information on land rights is necessary, although probably not sufficient, to increase the size of formal land and credit markets (Feder, 1993 and Deininger, Zegarra and Lavadenz, 2003).
There are three requisites that are necessary for the information system to be reliable: (1) the Registry must be the only definitive (or legal) source of ownership; (2) there must be a single cadastral parcel number, and (3) the Registry must require the cadastral parcel number for any registration of ownership. (See table 1 at the end of this section).
Cadastre for each jurisdiction; and (3) the national or regional government regulates, subsidizes, and monitors the development of regional or municipal fiscal cadastres.
Since there are many countries - such as Denmark, Honduras, Japan, Spain and Peru - where registration is not compulsory, we cannot compare data from the Registry and the Cadastre to determine the reliability and consistency of the information system. However, we can ask civil servants if they are aware of inconsistencies between both data bases, and gather data on total rural and urban coverage in both data sets. We will use two different quantitative benchmarks for the Registry, depending on whether registration is compulsory or voluntary (see table 2).
For an information system to be updated the first requirement will be to make compulsory the notification to government authorities of both property transfers and changes in land use. When this obligation does not refer to the registration of title at the Registry, it must be compulsory to provide such data to some other public agency, generally the Cadastre.
Another requirement for proper updating is related to the cost imposed on the citizens to provide this information. If the cost is too high, the state is creating negative incentives towards providing this information. In this sense, we will measure the registration costs of titles and mortgages, including lawyer and notary fees. We also include indicators on the relative number of Registry and Cadastre offices relative to the size of the country and its population so as to use them as proxies for other transaction costs (see table 1). It is important to note here that register costs also include specific taxes that will be analyzed later, and might include other private costs, such as those related to surveyor mapping when a parcel is not properly mapped at the Cadastre (which is, for example, the case in Peru).
An ideal indicator to assess the currency of the data would be to gather information on the percentage of land parcels or apartments that belong to an owner, or appear in the information system with a use, different from the current one. This could be done for example crossing new land cover maps with the cadastral information. Unfortunately, this information is normally not available, but we can use the age of the last systematic update of the cadastral map as another measure for currency (table 2).
complexity of the Cadastre, and the scarcity of resources commonly suffered by many local public agencies in developing countries, we recommend to manage the Cadastre at the regional or national level. In other words, the Cadastre is a vital informational tool for many different public policy purposes, and leaving its management to municipalities can result in highly heterogeneous data quality.
We have also included the relationship between cadastral and market land values as an output indicator of the currency and the reliability of the data contained in the information system. While this data is difficult to obtain, we can at least calculate a proxy based on information provided by cadastral surveyors. Since cadastral values should reflect market values, much lower cadastral values imply insufficient updating, while broad differences between different places would suggest lack of reliability. This information is needed to determine whether potential tax collection problems are due to the tax rate used, to insufficient cadastral coverage or updating, or to deficient land value assessments.
Useful policy planning tools can be obtained if data on land use and land ownership obtained from the land information system is integrated with other spatial information such as poverty maps, public infrastructure or environmental risks. Many public agencies are beginning to do this, using Geographical Information System (GIS) technologies, so we will add another best practice indicator on this issue.
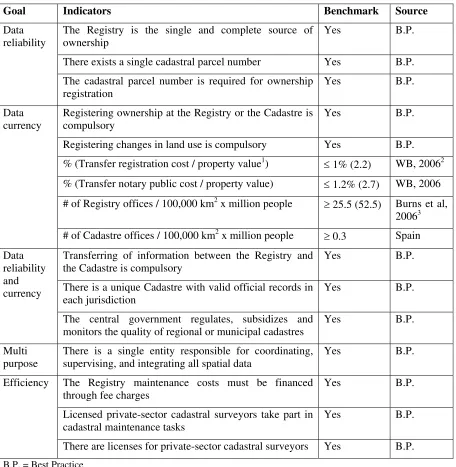
Table 1. The evaluation of the Land Information System structure
Goal Indicators Benchmark Source
The Registry is the single and complete source of ownership
Yes B.P.
There exists a single cadastral parcel number Yes B.P.
Data reliability
The cadastral parcel number is required for ownership registration
Yes B.P.
Registering ownership at the Registry or the Cadastre is compulsory
Yes B.P.
Registering changes in land use is compulsory Yes B.P.
% (Transfer registration cost / property value1) ≤ 1% (2.2) WB, 20062
% (Transfer notary public cost / property value) ≤ 1.2% (2.7) WB, 2006
# of Registry offices / 100,000 km2 x million people ≥ 25.5 (52.5) Burns et al, 20063 Data
currency
# of Cadastre offices / 100,000 km2 x million people ≥ 0.3 Spain
Transferring of information between the Registry and the Cadastre is compulsory
Yes B.P.
There is a unique Cadastre with valid official records in each jurisdiction
Yes B.P.
Data reliability and currency
The central government regulates, subsidizes and monitors the quality of regional or municipal cadastres
Yes B.P.
Multi purpose
There is a single entity responsible for coordinating, supervising, and integrating all spatial data
Yes B.P.
The Registry maintenance costs must be financed through fee charges
Yes B.P.
Licensed private-sector cadastral surveyors take part in cadastral maintenance tasks
Yes B.P.
Efficiency
There are licenses for private-sector cadastral surveyors Yes B.P.
B.P. = Best Practice
Numbers in parenthesis indicate standard deviation 1. Excluding notaries’ costs and taxes
2. It includes data for every OECD country
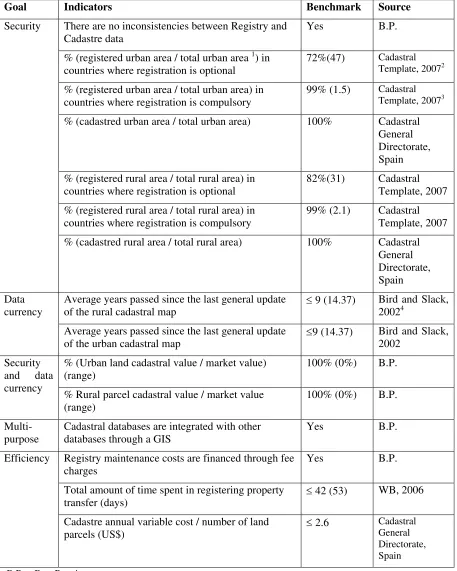
Table 2. The evaluation of Land Information System outputs
Goal Indicators Benchmark Source
There are no inconsistencies between Registry and Cadastre data
Yes B.P.
% (registered urban area / total urban area 1) in countries where registration is optional
72%(47) Cadastral
Template, 20072
% (registered urban area / total urban area) in countries where registration is compulsory
99% (1.5) Cadastral
Template, 20073
% (cadastred urban area / total urban area) 100% Cadastral
General Directorate, Spain
% (registered rural area / total rural area) in countries where registration is optional
82%(31) Cadastral Template, 2007
% (registered rural area / total rural area) in countries where registration is compulsory
99% (2.1) Cadastral
Template, 2007 Security
% (cadastred rural area / total rural area) 100% Cadastral
General Directorate, Spain
Average years passed since the last general update of the rural cadastral map
≤ 9 (14.37) Bird and Slack, 20024
Data currency
Average years passed since the last general update of the urban cadastral map
≤9 (14.37) Bird and Slack,
2002
% (Urban land cadastral value / market value) (range)
100% (0%) B.P.
Security and data currency
% Rural parcel cadastral value / market value (range)
100% (0%) B.P.
Multi-purpose
Cadastral databases are integrated with other databases through a GIS
Yes B.P.
Registry maintenance costs are financed through fee charges
Yes B.P.
Total amount of time spent in registering property transfer (days)
≤ 42 (53) WB, 2006
Efficiency
Cadastre annual variable cost / number of land parcels (US$)
≤ 2.6 Cadastral
General Directorate, Spain B.P. = Best Practice
Numbers in parenthesis indicate standard deviation
1. Ratios that refer to the number of land parcels (instead of area) can also be used.
2. Data for Denmark, Hong Kong and Japan. These are the only developed countries in the sample where registration is not compulsory.
3. It includes values for Australia, Austria, Belgium, Finland, Germany, Israel, The Netherlands, New Zealand, Sweden and Switzerland.
2.2.2. Best practice in land taxes
Land taxes should considerably contribute to government revenue, enhance social equity, promote environmentally sustainable activities, and facilitate low-income groups’ access to land.
In order to analyze the principal features of land taxes and its consequences, it is necessary first to distinguish between those taxing ownership and those taxing the transfer of rights. Taxes on ownership are levied on an annual basis and, if sufficiently high, can enhance land supply (thereby decreasing prices) and land use productivity. On the contrary, taxes on transfers increase transaction costs, thereby increasing prices and diminishing land market activity.
Second, identifying whether land is used or not as habitual homestead is necessary to support social equity and to facilitate low-income groups’ access to land. If the property is used as homestead, ownership tax rates should be lower so as to guarantee access and occupancy.
Taking the previous aspects into account, we propose the following optimum benchmarks: the annual property ownership tax rate (a structural indicator) and total collection (an outcome or result indicator in this case, since the output coincides with the goal) from land that is not used as principal homestead should be high, while the tax rate and total collection from transfers should be low. Moreover, tax rates on productive activities that produce environmental damage should be higher. We will use these indications when comparing with international averages (see table 3).
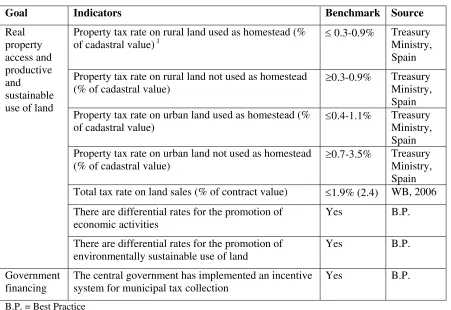
Table 3. The evaluation of the land tax structure
Goal Indicators Benchmark Source
Property tax rate on rural land used as homestead (% of cadastral value) 1
≤ 0.3-0.9% Treasury Ministry, Spain
Property tax rate on rural land not used as homestead (% of cadastral value)
≥0.3-0.9% Treasury
Ministry, Spain Property tax rate on urban land used as homestead (%
of cadastral value)
≤0.4-1.1% Treasury
Ministry, Spain Property tax rate on urban land not used as homestead
(% of cadastral value)
≥0.7-3.5% Treasury
Ministry, Spain Total tax rate on land sales (% of contract value) ≤1.9% (2.4) WB, 2006
There are differential rates for the promotion of economic activities Yes B.P. Real property access and productive and sustainable use of land
There are differential rates for the promotion of environmentally sustainable use of land
Yes B.P.
Government financing
The central government has implemented an incentive system for municipal tax collection
Yes B.P.
B.P. = Best Practice
[image:18.595.80.556.439.732.2]Numbers in parenthesis indicate standard deviation
Table 4. The evaluation of land tax outcomes
Goal Indicators Benchmark Source
Annual taxes on land property / Total land taxes ≤31.3% Treasury
Ministry, Spain Productive
use and access
Annual taxes on land not used as homestead / Total land taxes
≥11.1% Treasury
Ministry, Spain
Total government taxes / GDP 36.3% (7.6) OECD, 2004
Total taxes on land / GDP 1.9% (1.1) OECD, 2004
Total taxes on land / total government taxes 5.5% (3.5) OECD, 2004
Annual taxes on rural land / Annual taxes on land >> 2.4%2 Treasury
Ministry, Spain
Sub national taxes / total taxes 18.1 (12,4) OECD, 2004
Government financing
Annual municipality taxes on land /Total municipality revenues
36.2%(31,6) OECD, 2004
B.P. = Best Practice
Numbers in parenthesis indicate standard deviation 1. Sum of all tax rates that are applied to the same concept.
2.2.3. Best practice in land-related subsidies
There is broad consensus on that, from an economic perspective, the existence of market failures produced by positive externalities justifies the adoption of subsidies. Such positive externalities take place when the private marginal benefit of producing a given good or service is lower than the social marginal benefit. As a result, the output level of an economy will be lower than the optimum social level. The opposite logic is applied to the justification of special taxes on certain economic activities that produce negative externalities. In both cases, the subsidy or the tax should be equal to the difference between the social and the private cost so as to make them equal.
The principal shortcoming of this theoretical argument is the difficulties inherent in measuring social benefits and costs: How can we measure the social cost of pollution? Or how can we measure the social benefit of public health or technological innovation? Although many methodologies have been designed to cope with this problem - mostly in environmental economics - their practical application is expensive and highly inaccurate. The practical solution to this problem consists in subsidizing or establishing special taxes on those activities that generate the clearest externalities and in respect of which there is broad social consensus. Respecting taxes, examples include activities that produce clear environmental damage or involve health risks, such as taxes on polluting gases and on alcohol and tobacco products. Respecting subsidies, there are clear positive externalities in public infrastructures, research, education and training, public health, employment creation, and capital investment incorporating new technologies. Taking all these aspects into account we begin designing structural qualitative indicators (table 5).
In practice, however, both the allocation and amount of subsidies are often determined, not by the search of social optima, but by the political pressure exerted by interest groups and/or in order to obtain competitive advantages at international markets. This is for example the case of high agricultural subsidies adopted by many developed countries, which are being highly criticized based on the distortion of world
market prices that they produce. The problem with these subsidies comes from their
an indicator of good practice, but as to assess the potential threats to agricultural competitiveness in the analyzed developing country (table 6).
We also include an indicator that reflects the percentage of total Ministry of Agriculture spending assigned to the provision of goods and services, i.e., the total ministry budget minus the administrative expenditure. This indicator tries to reflect the resource management efficiency of the Ministry of Agriculture. Given the difficulties to find information for a significant number of developed countries, we use as a benchmark the latest data of the European Commission agricultural budget. While the Spanish information is not very helpful because most of the responsibilities have been transferred to the European Union and to the Autonomous Communities (the regional political and administrative Spanish entities), the European Commission data is representative of a highly burocratic agency that employs approximately 24,000 well paid civil servants.
Although, as it has been argued, the quantity and allocation of subsidies is often controversial, there is broad agreement on the need to design subsidies so as to provide the right incentives to efficiently use them and to introduce the least possible distortions in market prices. Moreover, we argue that it is necessary that their use and their flexibility are partial. We now explain both types of partialities.
According to the theoretical argument that justifies the use of subsidies, these have to cover just for a part of total cost to make up for the difference between social and private benefits. Furthermore, a partial amount is an incentive for the beneficiary to take on costs and risks. Only in the specific case of public goods (where there is a clear social benefit but almost null private benefits) such as rural roads and research on non-commercial issues, would the use of whole subsidies be justified on an economic basis. By partial flexibility we refer to subsidies that allow the beneficiary to select the productive activity (in order to not distort market prices) while requiring the compliance with a set of criteria that guarantee that the positive externality is indeed produced. As examples we cite the compulsory use of environmentally sustainable techniques, and formal labour contracts in order to be eligible for the subsidy.
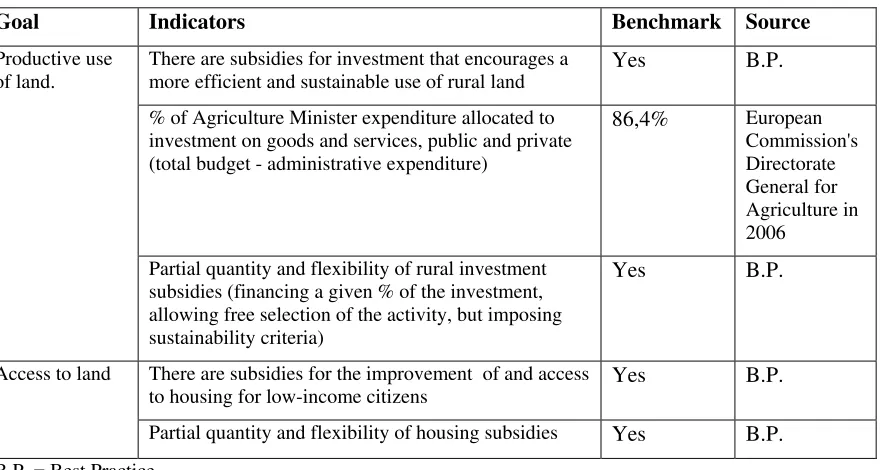
Table 5. The evaluation of the structure of land-related subsidies
Goal Indicators Benchmark Source
There are subsidies for investment that encourages a more efficient and sustainable use of rural land
Yes B.P.
% of Agriculture Minister expenditure allocated to investment on goods and services, public and private (total budget - administrative expenditure)
86,4% European
Commission's Directorate General for Agriculture in 2006 Productive use of land.
Partial quantity and flexibility of rural investment subsidies (financing a given % of the investment, allowing free selection of the activity, but imposing sustainability criteria)
Yes B.P.
There are subsidies for the improvement of and access to housing for low-income citizens
Yes B.P.
Access to land
Partial quantity and flexibility of housing subsidies Yes B.P.
[image:21.595.76.534.372.468.2]B.P. = Best Practice
Table 6. The evaluation of the outputs from land-related subsidies
Goal Indicators Benchmark Source
Productive use Annual agricultural and livestock subsidies / total production area ($US/Ha) 1
1,587 (2,924) OECD and FAO, 2003
Access Annual housing subsidies (US$)/ (urban population x Gini)2
194.0 Housing
Ministry, Spain Numbers in parenthesis indicate standard deviation
1. This indicator does not attempt to represent best practice. It is used to show difficulties arising from low public support directed towards developing countries’ agricultural producers, in a context of free global trade.
2. This indicator uses easily collectable data. The purpose is to proxy the funds granted by the government per each urban inhabitant who finds problems accessing housing. We use the Gini coefficient, an index of income inequality, and assume that the larger the coefficient (higher inequality) the larger the proportion of households that will have access to housing problems.
2.2.4. Best practice in land use and land market regulations
Land use and market regulations should enhance low-income households’ access to land, as well as the efficient and environmentally sustainable use of such resource.
In the specific case of land rental markets, governments frequently protect the lessee by establishing or restricting the length of the contracts and the rent. Even tough there is no obvious consensus on these type of regulations, we will use the following criteria: (1) the initial rent must be set freely between the lessor and the lessee; (2) the minimum length of the contract should not be longer than a year; and (3) it can be established that the annual rent increase cannot be higher than inflation. We will then consider that government measures that do not comply with these criteria are not optimum because they are too rigid and can have a negative impact on market supply, thereby increasing prices (table 7).
Regarding land sale markets, we argue that they must be completely free, including the sale of land previously purchased through public programs. Restrictions on the sale or rent of land acquired through public programs harm the beneficiaries of such programs (which loose flexibility to adapt to future conditions) and limit the market supply of land, thereby increasing prices.
Land use regulations can be classified into three different types. First, there is a set of rules that apply everywhere and that regulate certain practices. Examples are the use of certain pesticides, and construction and waste disposal rules. Secondly, there are especially restrictive rules that apply to the use of specific areas and buildings throughout the whole national territory, such as protected parks and buildings that are considered historical or cultural landmarks. Thirdly, there are land use plans, which are generally developed by sub national governments, and which include land use regulations and public investment plans, differentiated by zone.
While land use legislation is far from being a new phenomenon, it has been recently extensively developed due to increasing environmental awareness. The main problem in developing countries is not so much the regulation per se, but the difficulty in its enforcement (Farvacque and McAuslan, 1992). It is for this reason that our study focuses on the evaluation of how rules and land use plans are to be implemented.
practice that an agency from a higher territorial order inspects proper enforcement of rules and plans of lower territorial order agencies (see tables 7 and 8).
Table 7. The evaluation of the land regulatory structure
Goal Indicators Benchmark Source
There are no legal restrictions to rural land sale Yes B.P.
There are no legal restrictions to urban land sale Yes B.P.
There are no legal restrictions to rural land leasing Yes B.P.
Productive use and access to land
There are no legal restrictions to urban land leasing Yes B.P.
The government establishes obligations and rules for the elaboration of municipal or regional land use plans
Yes B.P.
The central or regional government supervises municipal or regional land use plans
Yes B.P.
The central or regional government inspects the compliance of real land use versus general rules and municipal or regional land use plans
Yes B.P.
Sustainable land use
The central or regional government subsidizes the elaboration of municipal or regional land use plans
Yes B.P.
B.P. = Best Practice
Table 8. The evaluation of land regulation outputs
Goal Indicators Benchmark Source
% of urban municipalities with land use plans 100% B.P.
% of urban municipalities with participative land use plans 100% B.P.
% of urban municipalities’ investment expenditure allocated to activities included in land use plans
100% B.P.
% of rural municipalities with land use plans 100% B.P.
% of rural municipalities with participative land use plans 100% B.P.
Productive and sustainable use of land
% of rural municipalities’ investment expenditure allocated to activities included in land use plans
100% B.P.
B.P. Best Practice
3. An application to the land administration systems of Peru and Honduras
[image:23.595.81.522.434.594.2]Both countries share the same shortcoming: a bottleneck created by the institutional design of the Registry and Cadastre systems. Even though Honduras and Peru have undertaken important projects and institutional reforms in both systems, it is still very costly to register land, and information regarding to ownership, value and use of land is neither current nor reliable. The consequences are thin land formal markets, high inability to enforce regulation, and high land tax evasion.
Registration of ownership involves high costs: granting a public deed before a notary public, paying land-related taxes and registration fees, and, in the case of Peru, paying for surveying when the area is not appropriately mapped at the Cadastre. This, in turn, implies that the vast majority of owners do not have incentives to register or obtain a title, and, as an alternative, many of them apply for public documents that are cheaper and easier to obtain(examples include private sale contracts authorized by a local judge and ownership certificates issued by the local government). Governments of both Honduras and Peru have tried to solve this problem by implementing land titling projects, but they appear to be ineffective and inefficient. Ineffective because after implementating a titling project, when a new transfer is made the title will be void if the new owner fails to register. Inefficient because establishing legal rights (titling) is a highly demanding and expensive process, requiring extensive legal and publicity work to asure definitive ownership.
several big titling projects Peru has 30% urban titled parcels and 45% titled rural parcels, while Honduras has 15% urban titled parcels and 21% titled rural parcels.
Respecting the Cadastre, both Honduras and Peru have implemented coordination systems between agencies that develop cadastral maps as wells as a vast number of pilot projects for the elaboration of local cadastral maps. However, the outcome of these measures has been unsatisfactory. The three most urgent tasks are the following: (1) to eliminate the overlapping between agencies by assigning specific responsibilities to each of them; (2) to achieve full cadastral coverage (Peru has cadastral maps for just 30% of urban land parcels and 45% of rural ones; Honduras does not even have data on the percentage of urban land parcels and it only has cadastral maps for 31% of the total rural area; while developed countries have universal cadastral coverage); and (3) to design permanent incentives and tools that enable the updating of information (neither Honduras nor Peru have data on the latest cadastre general updating).
Due to the difficulties that arise from the integration and coordination of many (houndreds in Honduras, and thousands in the case of Peru) municipal agencies and to the vast budget and human capital differences between them, it is strongly recommended that they create a single national Cadastre. In the case of Peru, which is a big country immersed in an ongoing process of decentralization, they could also opt for regional cadastre agencies. In this latter case, they should still have a national cadastre agency in charge of regulating, subsidizing, monitoring, and integrating the regional cadastres.
Achieving universal and up-to-date cadastral coverage (tasks two and three above) is not expensive and demanding when conducted through satellite technologies. These are less precise than using field surveys or photogrammetry, but can be sufficiently accurate to calculate areas, while enabling the public administration to locate new construction sites and changes in land use. It is much more important to achieve universal and up-to-date cadastral coverage than to obtain extreme accuracy.
As mentioned above, one of the main implications of having low cadastral coverage is the difficulties in collecting land taxes. While land taxes contribute on average to 5.5% of total tax collection in developed countries, Peru and Honduras only collect around 2.5% from land taxes.
majority of their budget to administrative procedures (72% of the total budget in Peru and 91% in Honduras, compared to 14% of the European Commission's Directorate-General for Agriculture and Rural Development). The Peruvian and Honduran agricultural producers suffer from a large competitive disadvantage due to the fact that they are immerse in the process of opening up their economies through free trade agreements, while developed countries highly subsidize both private and public goods in rural areas - mostly through public investment in infrastructure and agricultural subsidies. For example, agricultural producers at the OECD receive on average US$ 1,587 per hectare and year, while Peruvian farmers receive US$ 30 and Honduran farmers US$ 10. This disadvantage reduces productive investment incentives with potentially devastating consequences on land use. Based on our analysis, we recommend increasing public investment towards productive activities in rural areas, both in public and private goods. In the latter case, it would be crucial to correctly design private subsidies, as described above. We also recommend the design of specific import tariffs against highly subsidized products from other countries, something that is currently allowed by the World Trade Organization.
Finally, both Honduras and Peru are experiencing a "boom" in participative land use planning processes at all administrative territorial levels. While this is certainly not harmful per se, both countries still lack the necessary administrative tools to endow budgets and to monitor the implementation of the resulting plans. Consequently, administrative expenditures increase, and there is a high risk that citizens get even more disappointed after consultation processes that do not materialize in real investments. It would therefore be appropriate to decrease the overlapping of so many different plans, to increase the national budget allocated to subsidizing the remaining plans, and guarantee that there is a regional or central government entity that monitors the implementation of the plans at lower administrative levels.
4. Final Remarks
taxes; (2) to encourage the productive and sustainable use of land, and (3) to promote access to land for low-income households.
We are aware that some of the best practice qualitative benchmarks are suitable to criticism, while some of the international averages used as quantitative benchmarks might not be seen as appropriate for comparison. However, we believe that presenting and arguing benchmarks is a necessary step towards advancing a research agenda that is useful to land administration policy-makers.
The methodology was applied to Honduras and Peru in order to refine our draft instruments, while evaluating the systems of both countries. In this sense, the preliminary methodology was modified to incorporate changes as we encountered difficulties in obtaining data or we found relevant additional information. We have sought to develop a methodology that covers the complexity of the administration system and that could be easily and inexpensively implemented in developing countries.
Regarding the evaluation of the Honduran and Peruvian land administration systems, we came up with seven recommendations that we also believe can be applicable to other countries:
1. Simplify the land registration process and reduce its cost. In the short run, the change could run into opposition from the notary publics or the Finance Ministry, since they would get lower fees and taxes per registration. However, in the long run, the increase in the number of registrations could result in higher fee and tax collection for both the notaries and the Finance Ministry.
2. Suppress cadastral overlapping so as to create a single cadastre with reliable records within its jurisdiction. To ensure its reliability, it is preferable to create a single Cadastre at the national level (or at the regional level in countries with federal government systems).
3. Use satellite technologies to achieve universal and up-to-date cadastral coverage at a low cost.
4. Reduce tax rates on real property transfers, and increase annual ownership tax rates on properties that are not used as homestead. These measures would encourage the development of land markets and facilitate access to land for low-income groups. Expanding the tax base through a universal and up-to-date Cadastre and proper control of tax evasion are also the cornerstones to increase land tax collection. 5. Significantly increase the percentage of public expenditure allocated to financing
Special care must be taken in the design of subsidies for private investments, considering the following guidelines: (1) guarantee that only a part of the investment is financed; (2) prevent specific sector biases that distort market activity; (3) establish a transparent and technical selection process; and (4) use technical requirements (related, for example, to the use of sustainable production technologies, human capital development and creation of formal jobs) on how to use the subsidies. If the government cannot enforce these guidelines, it is probably desirable to prioritize investment in public goods such as communication, irrigation, and market place infrastructures, since such infrastructure is less prone, by definition, to cooptation by particular private groups.
6. Compromise public funds to finance the execution of investment proposals resulting from participative land use planning processes. The implementation of such projects should be controlled by public entities at a higher territorial level, and made publicly available to allow for citizen monitoring.
The results from the case studies were presented in September and October 2007 before land administration experts in Tegucigalpa (Honduras), Lima (Peru) and Washington D.C. (United States), generating heated debates about two issues that we would like to highlight to finish the article. One of these topics obviously was the appropriateness of land titling projects. Our vision is that we have to carefully distinguish between countries that make title registration compulsory and voluntary. In the latter case, which applies for the majority of Latin America, it makes more sense to make a strong effort to attain universal cadastral coverage, and facilitate (make cheaper and easier) registration of title, than to try to reach universal title coverage via special titling projects. First, if people do not voluntarily title their land it means that benefits derived from registering property (security and transferability of ownership) are lower than costs. Second, obtaining universal information on administrative ownership is much easier and cheaper than obtaining universal information on legal ownership (something that actually does not make much sense when titling is voluntary). And third, the benefits from universal cadastral coverage would facilitate land tax collection, land use planning, voluntary land titling, and access to land projects.
which has exactly the same reasoning. We believe that the reason for rejection of subsidies comes from many years of scepticism, especially in Latin America, towards the viability of developing countries’ governments to correctly intervene on market failures. Or in other words, to the (neoliberal) view that government failures in developing countries tend to be worse than the market failures they try to resolve. We believe that, instead of just decreasing the size of the state, it is necessary to advance in getting a better functioning state, the now so common drive towards improving governance. This article can be seen as a proposal to move ahead on the agenda of improving governance in land - or real property - public administration systems.
5. Acknowledgements
The authors gratefully acknowledge the support of the “Fondo General de
Cooperación de España” for funding this research project, and the Interamerican
Development Bank for its management. The authors also wish to thank Eduardo
Zegarra and Alvaro Espinoza within the Grupo de Análisis para el Desarrollo (Peru),
and Mayra Falck, Beatriz Ordoñez, Ismalia Acosta and Lincoln Villanueva within the
Escuela Agricola Panamericana (Honduras) for their assistance in conducting the case
studies. Institutional support from the Universidad Politecnica de Madrid, and research
assistance from Margarita Vega are appreciated. However, the views expressed in this
article are those of the authors.
6. References
Bird, R., Slack, E., 2002. Land and Property Taxation: A Review. Paper presented at the
World Bank Land Workshop, April 3-6, Budapest, Hungary.
Burns, T., Grant, C., Nettle, K., Brits, A.M., Dalrymple, K., 2006. Land Administration Reform: Indicators of Success and Future Challenges. Land Equity International Pty Ltd, Wollongong, Australia. URL: <http://www.landequity.com.au/> (Last accessed: 15/04/2007).
Dale, P., McLaughlin, J., 1999. Land Administration. Oxford University Press, New York.
Deininger, K., Zegarra, E., Lavadenz, I., 2003. Determinants and Impacts of Rural Land Market Activity: Evidence from Nicaragua. World Development 31(8), 1385-1404.
Farvacque, C., McAuslan, P., 1992. Reforming Urban Land Policies and Institutions in Developing Countries. World Bank, Washington D.C.
Feder, G., 1993. The Economics of Land Titling in Thailand. In: Hoff, K., Braverman, A., Stiglitz, J. (Eds.), The Economics of Rural Organization: Theory, Practice and Concepts. World Bank, Washington, D.C.
Elisabeth K., 2000. Social Capital and Natural Capital: a Comparative Analysis of Land Tenure and Natural Resource Management in Guatemala. Land Economics 76 (1),114-32.
Migot-Adholla, S., Hazell, P., Blarel B., Place F., 1993. Indigenous Land Rights Systems in Sub-Saharan Africa: a Constraint on Productivity? In: Hoff, K., Braverman, A., Stiglitz, J. (Eds.), The Economics of Rural Organization: Theory, Practice and Concepts. World Bank, Washington, D.C.
Douglas N., 1990. Institutions, Institutional Change and Economic Performance. Cambridge University Press, Cambridge.
OECD. 2003. Agriculture and Fisheries Statistics. URL: <http://www.oecd.org> (Last accessed: 15/01/2007).
OECD. 2004. Accrual Reporting in Revenue Statistics 1965-2003. OECD, Ginebra. Otsuka, K., Quisumbing A., 2001. Land Rights and Natural Resource Management in
the Transition to Individual Ownership: Case Studies from Ghana and Indonesia. In: de Janvry, A., Gordillo, G., Platteau, J.P., Sadoulet, E. (Eds.), Access to Land, Rural Poverty and Public Action. Oxford University Press, New York.
Thomas P., Kikuyu P., 1994. Land Tenure Reform in East Africa: Good, Bad or Unimportant? Journal of African Economies 3(1), 1-28.
Rajabifard, A., Williamson, I., Steudler, D., Binns, A., King, M., 2007. Assessing the Worldwide Comparison of Cadastral Systems. Land Use Policy 24(1), 275-288. United Nations Economic Commission for Europe (UN-ECE), 1996. Land
Administration Guidelines, with Special Reference to Countries in Transition. United Nations, New York and Ginebra.
World Bank, 2003. Land Policies for Growth and Poverty Reduction. A World Bank Policy Research Report. World Bank, Washington, D.C.