http://dx.doi.org/10.4236/jemaa.2014.64008
How to cite this paper: Sallabi, A.K., et al. (2014) Method of Images to Study the Charge Distribution in Cases of Potentials
Deviating from Coulomb’s Law. Journal of Electromagnetic Analysis and Applications, 6, 51-56. http://dx.doi.org/10.4236/jemaa.2014.64008
Method of Images to Study the Charge
Distribution in Cases of Potentials
Deviating from Coulomb’s Law
Abdulwahab K. Sallabi
*, Jamal A. Khaliel, Ali Sulaiman Mohamed
Department of Physics, Faculty of Science, Misurata University, Misurata, Libya Email: *[email protected]
Received 8 November 2013; revised 6 December 2013; accepted 5 January 2014
Copyright © 2014 by authors and Scientific Research Publishing Inc.
This work is licensed under the Creative Commons Attribution International License (CC BY).
http://creativecommons.org/licenses/by/4.0/
Abstract
The method of images is used to study the charge distribution for cases where Coulomb’s law de-viates from the inverse square law. This method shows that in these cases some of the charge goes to the surface, while the remainder charge distributed over the volume of the conductor. In accord with the experimental work, we show that the charge distribution will depend on the photon rest mass and is very sensitive to it; a very small value of the rest of mass of the photon will create deviation from Coulomb’s law.
Keywords
Coulomb; Method of Images; Charge Distribution
1. Introduction
One of the foundations of electrostatics is Coulomb’s law. Major electromagnetic laws are built upon this law. As a direct consequence of this law (or its equivalent, Gauss’s law), any excess charge placed on a conductor must lie entirely on its surface. According to Coulomb’s law, excess charges given to a conductor will move away from each other and distribute themselves about the conductor in such a manner as to reduce the total amount of repulsive forces within the conductor and that both the charge and the field inside the conductor will vanish [1]-[6].
Testing this law has been a subject for many experiments over the past two and a half centuries [1] [2]. Any deviation from inverse square law would suggest a finite range for electromagnetic force, implying a nonzero photon rest mass. Rest mass of the photon provides indirect test of the deviations from exactness of Coulomb’s
law. If the photon mass is zero, Coulomb’s inverse-square law is the foundational law in electrostatics. Experi-ments measure deviations in the exponent of inverse-square law and photon rest mass are increasingly exact. The most recent ion interferometry experiment measures the value of the exponent to be a few times 10−22 and detect a photon rest mass at the level of 9 × 10−50 grams [1]. Detection of any deviation from Coulomb’s law would have far-reaching implications. Maxwell’s equations and much of the standard model would have to be modified. The notion that absolute electrostatic potential is arbitrary would have to be abandoned, along with many other tenets of classical electromagnetism [1].
In an interesting papers, Spencer [3] and Griffiths and Uvanovic [4] studied distribution of excess charge within a conductor for laws rather than inverse square law such as Yukawa’s law or power law. In these two cases they found that some of the charge goes to the surface, and the remainder distributes itself uniformly over the volume of the conductor.
In this paper we introduce the method of images to study the distribution of charges in cases where the poten-tial is depending on the photon rest of mass. And give a theoretical extension work to the experimental results that detect a photon rest mass at the level of 9 × 10−50 grams and as a result a deviating from Coulomb’s Law. This paper is also important to understand physics of molecules and electron transport through a single molecule which offers a highly promising new technology for the production of electronic chip.
2. Method and Results
2.1. Method of Images for Yukawa Potential and Grounded Spherical Conductor
The reaction field of a point charge due to surrounding medium can be represented by the method of image charge. The method of images allows us to solve certain differential form of electric potential problem without specifically solving a differential equation of this problem.
The potential Φ
( )
x everywhere outside a conducting sphere can be calculated by using method of images. As illustrated Figure1 we consider conducting sphere with radius R=a. For convenience, place the sphere at the origin. We assume a point charge q outside the sphere and defined by position vector y. By symmetry, the image charge lie on the line connecting the charge and the origin of the sphere and will be located inside the sphere at position vector y. If the sphere is grounded then the potential everywhere on the sphere equal zero. Now we are able to calculate the magnitude and the position vector y′ of an image charge q′ that is required to make the potential equal zero on the surface of the grounded sphere. Total Yukawa potential [4] Φ( )
x due to the assumed charge q and its image charge q′ at any point P is given by Equation (1).( )
qexp(
−k −)
q′exp(
−k − ′)
Φ = +
′
− −
x y x y
x
x y x y (1)
If the sphere is grounded, then the potential at the surface of the sphere vanishes Φ
(
x =a)
=0, thus:Figure 1. Two-dimensional schematic il- lustration of a conducting sphere of radius
a with a point charge q outside and image charge q′ inside.
x
q
q′
y′
θ y
(
)
ˆ ˆ
ˆ ˆ exp
exp
0
ˆ ˆ ˆ ˆ
a
q k n n
q ka n n
a a
a
a n n n n
a ′ ′ ′ ′ − − − − ′
Φ = = + =
′ ′ ′ − − ′ y y y x y y y (2)
where ˆn and ˆn′ are unit vectors in the direction of x and y respectively. To satisfy the boundary condi-tion Φ
(
x =a)
=0 at R=a, we must have:(
)
2 , exp a y y aq q k k
y
′ =
′= − − x− +y x−y′
(3)
More generally, the potential in the neighborhood of an uncharged grounded conducting sphere is given by Equation (4):
( )
(
)
1 1exp a
q k
y
Φ = − − − ′
− −
x x y
x y x y (4)
Let
(
)
(
)
1
2 2 2
1
2 2 2
2 cos
2 cos
x y xy
x y xy
ρ θ ρ θ = − = + − ′= − ′ = + ′ − ′ x y x y (5)
Substitute Equation (5) in Equation (4) and then differentiate to get the actual induced charge density on the surface of the grounded uncharged conducting sphere:
( )
14π x x a σ = ∂Φ = ∂ x Let
( )
(
)
( )
( )
(
)
3 4 2 2 2 22 2 cos
2 cos 2 cos a y a a a y y
a y ay
θ θ
θ
Ω = −
Λ = + −
Γ = + −
Then we get:
( )
( )
( )
( )
( )
( )
( )
( )
( )
( )
2 1 2 1 21 1 1 3 3
2 2 2 2 2
2 cos 1 1 2 5 exp 2 1 2 exp a a a qk k y a q k y y θ σ −
− Ω − Γ − Ω
= × − + − Γ × +
Γ Γ Α Γ Α
(6)
Table 1. Total induced surface charge normalized to −q on grounded conducting sphere and a=1.0.
Potential
Parameters
k a y q′ Total surface charge Total volume charge
Coulomb 0 2.0 0.50000q 0.5 0.0
Yukawa 0.008 2.0 0.49697q 0.4932 0.0037
Yukawa 0.5 2.0 0.34592q 0.2267 0.1192
Yukawa 1.0 2.0 0.23931q 0.1087 0.1306
2.2. Method of Images for Yukawa Potential and Insulated Charged Spherical Conductor
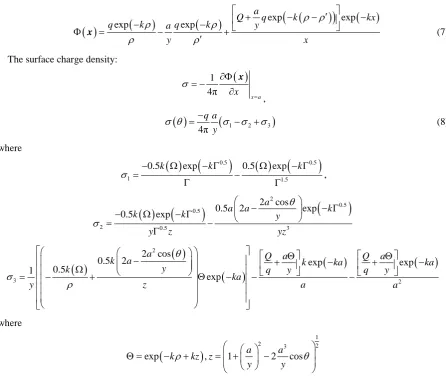
We can generalize Equation (4) for an insulated conducting sphere. Consider insulated charged sphere with total charge Q in the presence of a point charge q. The potential Φ( )
x everywhere outside the sphere is super-position of Equation (4) Yukawa potential of a point charge(
Q q− ′)
at the center of the conducting sphere, charge q and image charge q′ is given Equation (7):( )
exp(
)
exp(
)
exp(
(
)
)
exp(
)
aQ q k kx
q k aq k y
y x
ρ ρ
ρ ρ
ρ ρ
+ − − ′ −
− −
Φ = − +
′
x (7)
The surface charge density:
( )
14π x x a σ
=
∂Φ = −
∂ x
,
( )
(
1 2 3)
4πq a y
σ θ =− σ σ− +σ (8)
where
( )
(
0.5)
( )
(
0.5)
1 1.5
0.5k exp k 0.5 exp k
σ =− Ω − Γ − Ω − Γ
Γ Γ ,
( )
(
)
(
)
2
0.5 0.5
2 0.5 3
2 cos
0.5 2 exp
0.5 exp
a
a a k
k k y
y z yz
θ
σ
− − Γ
− Ω − Γ
= −
Γ
( )
( )
(
)
(
)
(
)
2
3 2
2 cos
0.5 2 exp exp
0.5 1
exp
a Q a Q a
k a k ka ka
y
k q y q y
ka
y z a a
θ
σ
ρ
Θ Θ
−
+ − + −
Ω
= − + Θ − − −
where
(
)
1
2 3 2
exp k kz ,z 1 a 2a cos
y y
ρ
θ
Θ = − + = + −
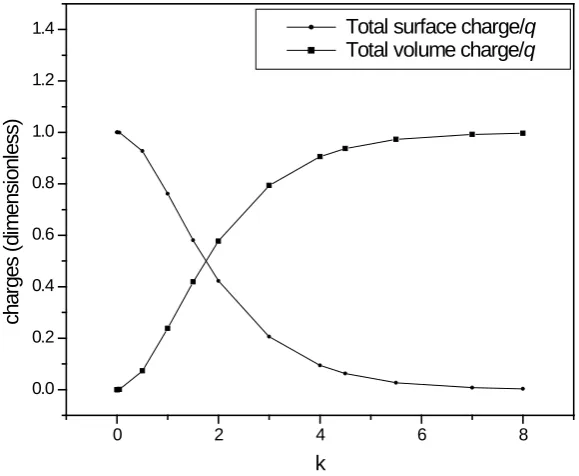
of k different from zero
(
k>0)
, we found that portion of the total charge is distributed inside the volume of the sphere. In Figure 4, the magnitude of the total surface charge normalized to q and the total volume charge normalized to q for insulated charged sphere with total charge Q, are displayed for(
Q q= −1,y a=2)
as a function of k. Note that the charged conducting sphere is insulated in this case and has a unit radius a.3. Conclusion
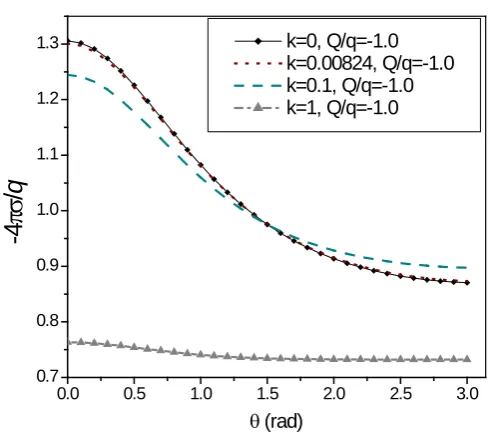
[image:5.595.196.431.191.398.2]In accord with the experimental work we show that the charge distribution greatly depends on the photon rest
Figure 2. The surface charge density normalized to 4π 2
q a
−
for conducting insulated charged sphere has unit radius and 2
a y= is plotted as a function of angle θ.
Figure 3. The surface charge density normalized to 2 / 4
q πa
− for
conducting insulated charged sphere has unit radius and a y=4 is plotted as a function of angle θ.
0.0 0.5 1.0 1.5 2.0 2.5 3.0 0.5
1.0 1.5 2.0 2.5 3.0 3.5
-4
πσ
/
q
θ (rad)
k=0, Q/q=-1.0 k=0.00824, Q/q=-1.0 k=0.1, Q/q=-1.0 k=1, Q/q=-1.0
0.0 0.5 1.0 1.5 2.0 2.5 3.0 0.7
0.8 0.9 1.0 1.1 1.2 1.3
-4
πσ
/
q
θ (rad)
[image:5.595.190.437.448.668.2]Figure 4.The magnitude of the total surface charge normalized to q and the total volume charge normalized to q, are displayed for
(
Q q= −1,y a=2)
as a function of k. Note that the charged conducting sphere has a unit radius.mass and is very sensitive to it; a very small value of the rest of mass will create deviation from Coulomb’s law. We have studied the distribution of charges on grounded spherical conductor and insulated charged spherical conductor by using the method of images. It is proven that using the image charge to study the distribution of charges on conductors is effective. Our results show that the charge distribution is depending greatly on k. When k=0, all the charges reside on the surface of the conducting sphere. But if k has values different from zero part of the charges will reside on the surface of the conducting sphere while the rest of the charges will be distributed inside the volume of the sphere. These results are consistent with the previous calculation [3] [4].
References
[1] Neyenhuis, B., Christensen, D. and Durfee, D.S. (2007) Testing Nonclassical Theories of Electromagnetism with Ion Interferometry. Physical Review Letters, 99, 200401. http://dx.doi.org/10.1103/PhysRevLett.99.200401
[2] Tu, L.-C. and Lou, J. (2004) Experimental Tests of Coulomb’s Law and the Photon Rest Mass. Metrologia, 41, S136- S146.
[3] Spencer, R.L. (1990) If Coulomb’s Law Were Not Inverse Square: The Charge Distribution Inside a Solid Conducting Sphere. American Journal of Physics, 58, 385-390. http://dx.doi.org/10.1119/1.16179
[4] Griffiths, D.J. and Uvanovic, D.Z. (2001) The Charge Distribution on a Conductor for Non-Coulombic Potentials.
American Journal of Physics, 69, 435-440. http://dx.doi.org/10.1119/1.1339279
[5] Jackson, J.D. (1975) Classical Electrodynamics. 2nd Edition, Wiley, New York.
[6] Griffiths, D.J. (1999) Introduction to Electrodynamics. 3rd Edition, Prentice-Hall, Upper Saddle River.
0 2 4 6 8
0.0 0.2 0.4 0.6 0.8 1.0 1.2 1.4
char
ges
(
di
m
ens
ionl
es
s)
k
Total surface charge/q