Structural Pattern Analysis in Telecom Social Networks
Pushpa Ravikumar, Ph.D.
Adichunchanagiri Institute of TechnologyChikmagalur Karnataka, India
ABSTRACT
The social network perspective emphasizes multiple levels of analysis. Differences among Customers are traced to the constraints and opportunities that arise from how they are embedded in networks, the structure and behavior of networks grounded in, and enacted by local interactions among customers. This paper addresses the local connections of customers in which it deals with social behavior of the whole population, as well as for understanding each individual. However this paper explains the structural patterns of Telecom social network in the form of network connection analysis and network distance analysis. A social network connection involves Demographics, density, reachability and connectivity of customers who are embedded in the network. Network distance analysis describes the walks, geodesic distance and flow between the customers. Populations with high density respond differently to challenges from the environment than those with low density, populations with greater diversity in individual densities may be more likely to develop stable social differentiation and stratification.
General Terms
Data Mining, Social Network Analysis
Keywords
Reachability, Demography, Connectivity, Geodesic, Density, Walks Reachability.
1.
INTRODUCTION
A social network consists of a set of customers and one or more types of relations between them, Such as information exchange or economic relationship. The Customer is a social entity. It could be a person or any other entity for which a relationship with another entity could be defined [1]. The relationship between a pair of Customers is called a tie, link or pair. Each link may be directed or undirected, binary (present or absent) or weighted (a set of values, usually with higher value implying stronger relationship).Links could also be of particular types, e.g., friendship, kinship. All links of the same type can be grouped together as a relation. A dyad consists of a pair or Customers and the ties between them. A triad is a subset of three Customers and the ties among them. Relationship among larger subsets of Customers includes the subgroups or a group.
Social network encompasses a set of customers and all the relations that could be defined on them. Usually depending on the number of Customer type's n, a social network may be identified as being an n-mode network. A Social network analysis focuses on relations and ties in studying of customer's behavior and attitudes. Thus the position of the Customers within a network and strength of ties between them become critically important. Social position can be evaluated by finding the centrality of a node identified through a number of connections among network members. Such measures are used to characterize degrees of influence, prominence and
importance of certain members. Ties strengths mostly involve closeness of bond.
Differences among individuals in how connected they are can be extremely consequential for understanding their attributes and behavior. More connections often mean that individuals are exposed to more and more diverse, information. Highly connected individuals may be more influential, and may be more influenced by others. Differences among whole populations in how connected they are can be quite consequential as well. The information spreads more quickly where there are high rates of connection. In between the individual and the whole population, there is another level of analysis called composition. Some populations may be composed of individuals who are all pretty much alike in the extent to which they are connected. Other populations may display sharp differences, with small elite of central and highly connected persons, and larger masses of persons with fewer connections. Differences in connections can tell us a good bit about the stratification order of social groups. The second major set of approaches in basic network analysis is the distance between Customers (or, conversely how close they are to one another). Some Customers may be able to reach most other members of the population with little effort: they tell their friends, who tell their friends, and everyone knows. Other Customers may have difficulty being heard. They may tell people, but the people they tell are not well connected, and the message doesn't go far. Thinking about it the other way around, if all of my friends have one another as friends, my network is fairly limited even though I may have quite a few friends. But, if my friends have many non-overlapping connections, the range of my connection is expanded.
If individuals differ in their closeness to other Customers, then the possibility of stratification along this dimension arises. Indeed, one major difference among social classes is not so much in the number of connections that Customers have, but in whether these connections overlap and constrain or extent outward and provide opportunity. Populations as a whole, then, can also differ in how close Customers are to other Customers, on the average. Such differences may help us to understand diffusion, homogeneity, solidarity, and other differences in macro properties of social groups.
2.
LITERATURE SURVEY
In this section, related literature about various churn prediction techniques and scope of Telecom customer’s Demographic analysis with respect to Telecommunication industry will be reviewed and discussed.
2.1
Churn Prediction Techniques
customer segmentation analysis. The customer churn analysis is based on client information data, billing data and customer care data. According to the way theme of data warehouse are organized [8]. The segmentation of customers has been done based on Euclidean distance calculation such as dividing the different entities with similar features for the aim that maximizes the difference between the groups and minimizes the differences within the groups. Limitations of this work were that, it considers the weak relationship between the customers and fails to find the hidden communities within the large data sets of telecom customers.
Hong Feng Lai [3] proposed a framework to extract implicit social network to interpret various features of social networks. To express the implicit social network, they propose rough set and frame logic to represent implicit relationship between objects by RST/FL framework. In their paper they discussed the transformation technique in which they transform the rough set data model into a logical specification language, F-logic. RST/F L framework finds the implicit social network to extract and express the social structure and relationship in customer database. In real social networks, there are various types of relations. Each relation can be taken as relation network. This paper discusses formal analysis to verify the properties of social networks.
2.2
Customer Demographics Analysis
To compete with other telecom providers, it is important to understand the behavior of the customers and predict their needs. In order to realize this, Parthan Kasarapu M. Saravanan Prasad Garigipati [4] explore the customers details based on their mobile usage behavior into social patterns (segments) and target the suitable segments for advertising.
In their approach, the usage data of the customers in association with their browsing behavior is used to form the segments considered to be an important addition. From the analysis of their usage rates with respect to a certain domain, the operator can drill down to the sub domain level interests and target them with specific customized services. This can be done by performing latent semantic analysis using Gibbs sampling algorithm and K-means clustering on the description of their accessed web pages with their usage and spend data.
The traditional method involves forming web communities using link based approach. Their method based on identifying social communities could produce an alternative approach for the mobile operators. The usage rates within a certain cluster, and the customers’ interest towards a specific domain can help to determine their extent of willingness to spend in specific areas. This approach produces better results than the traditional methods by enabling the telecom providers to target a specific group of consumers. In this method, authors predict behavior of the telecom customers based on the information they have on each customer. Essentially, customer segmentation has to be done to separate out groups which are highly intra-similar with less inter-similar Characteristics. The segmentation has been done on customer usage and spends data with their browsing behavior, but this technique fails to identify the hidden segments or hidden Communities within a large customer data base.
Aarthi.S, Bharanidharan.S Saravanan and Anand.V [5], explain the method of predicting the customer demographics in a mobile social network. This network made of individuals connected based on their communication behavior using mobile phones can be called as a Mobile Social Network.
people across mobile social networks are being performed extensively in an attempt to understand the intriguing patterns of human behavior. Such analyses can help in arriving at useful inferences for improving the accuracy of targeted advertisements. This paper makes one such attempt to extract the demographics (i.e. gender and economic status) of a person based on his/her connectivity in his/her respective social network(s) and mobile phone usage over a period of time.
3.
METHEDOLOGIES
The term network has different meaning in different disciplines. In the data mining disciplines social network is defined as a set of Customers (or agents, or nodes, or points, or vertices) and one or more relationships (or links, or edges, or ties) between pairs of Customers. Network that represent a single type of relation among the Customers are called simplex, while those that represent more than one kind of relation are called multiplex. Multiplex relations are analyzed using different networks, one for each relation type [6].
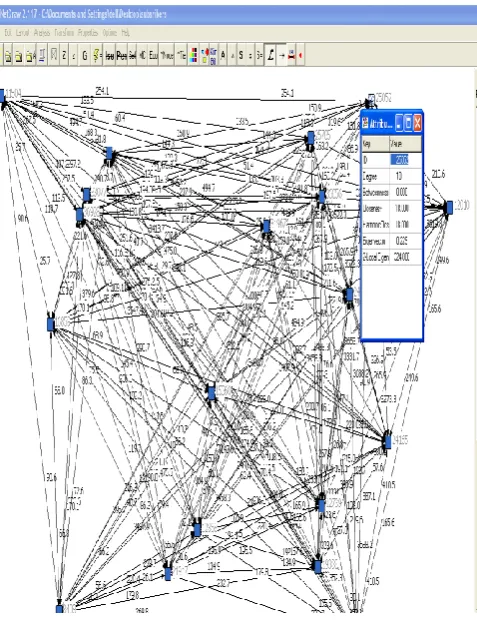
Each tie or relation may be directed, or undirected that represents co-occurrence, co-presence, or a bonded-tie between the pair of Customers. The Multi-Relational Social Network constructed for Telecom data by considering the multiple relations as friendship, age and frequency of call, volume of call as ties between the customers is given below Fig. 1.
Figure 1: Multi-relational Telecom Social Network
[image:2.595.321.560.360.671.2](customer that receive ties, but don't send them), or both. The number and kinds of ties that customer have are the basis for similarity or dissimilarity to other customers and hence to possible differentiation and stratification.
The number and kinds of ties that Customers have are keys to determining how much their embeddedness in the network constrains their behavior, and the range of opportunities, influence, and power that they have. This analysis is categorized as
Basic demographics Density
Reachability Connectivity
3.1 Basic Demographic Analysis
[image:3.595.55.290.417.750.2]The size of a network is defined by number of nodes or by number of edges of the network. In any network there are (k * k-1) unique ordered pairs of nodes (that is AB is different from BA, and leaving aside self-ties), where k is the number of nodes [7]. So, in resulting sample network of 50 Customers, with directed data, there are 2450 logically possible relationships. If we had undirected, or symmetric ties, the number 1225, since the relationship AB would be the same as BA. The number of logically possible relationships then grows exponentially as the number of customer increases linearly. It follows from this that the range of logically possible social structures increases (or, by one definition, "complexity" increases) exponentially with size.
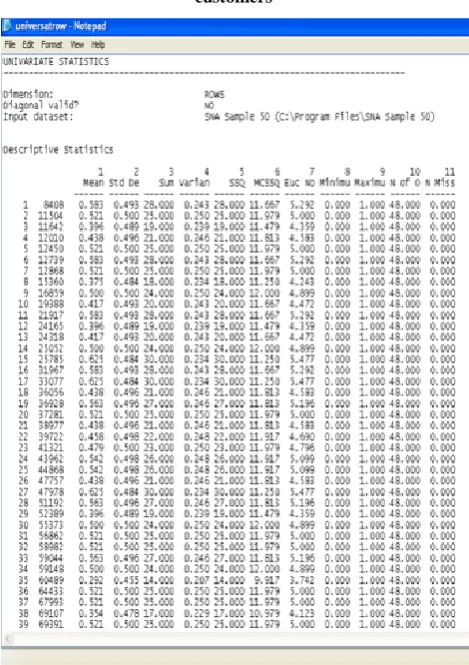
Table 1: The Out-degree statistics for Telecom customers
Statistics on the rows describes the role that, each customer plays as a source of ties (in a directed graph). The sum of the connections from the customer to others is called the out-degree. In this context, customer 1(Subscription-ID 8408) calls to 28 customers. Therefore customer 1 has out-degree value 28. Degree of points is important because depicts how many connections a customer has and in turn indicates the influential factor of a customer. Customer 15 and 17 has the highest out-degree measures with respect to connectivity analysis, therefore these customers influences more number of customers in a network. The meaning of the mean and standard deviation of Customer's out-degree reflect the strength of a tie between nodes. These statistics would have the easy interpretations as the sum of the strengths, the average strength, and variation in strength. The sum of each column in the adjacency matrix is the in-degree of the point. That is, how many other customers send information or ties to particular customers is considered for analysis. Customers that receive information from many sources may be prestigious (other customers want to be known by the customer, so they send information). The in-degree statistics for the Telecom customers are given in Table .2.
Table 2: The in-degree statistics for Telecom customers
3.2 Network Density Analysis
Table 3: The Density measures of Telecom Social Network
3.3 Network Reachability Analysis
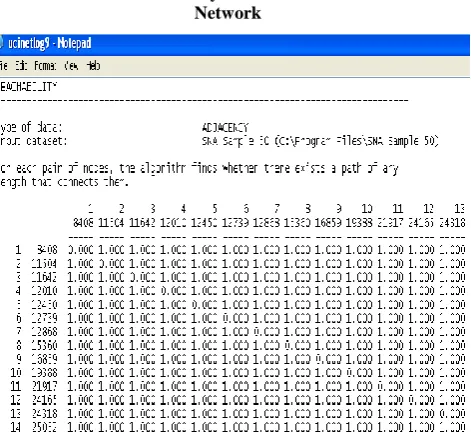
[image:4.595.333.569.96.365.2]A Customer is reachable by another if there exists any set of connections by which can be traceable from the source to the target customer, regardless of how many others fall between them. If the data are asymmetric or directed, it is possible that customer A can reach customer B, but that customer B cannot reach customer A. With symmetric or undirected data, of course, each pair of Customers either is or is not reachable to one another. If some customers in a network cannot reach others, there is the potential of a division of the network. Network Reachability analysis is given in Table 4.
Table 4: The Reachability measures of Telecom Social Network
3.4 Network Connectivity Analysis
Adjacency matrix of a customer communication relationship deals with whether there is a direct connection from one customer to another (or between two customers for un-directed data). Reachability focus on whether two customers are connected or not, by way of either a direct or indirect pathways of any length. Point Connectivity computes the local point connectivity between all pairs of nodes in a network. The local (point) connectivity of two non-adjacent vertices is the number of vertices that need to be deleted so that no path connects them, this is equal to the maximum number of vertex disjoint paths connecting them. If there are many different pathways that connect two Customers, they have high connectivity in the sense that there are multiple ways for a signal to reach from one to the other. Table 5 shows the point connectivity for social network.
Table 5: The Connectivity measures of Telecom Social Network
4.
RESULTS AND DISCUSSIONS
The network connection analysis described in methodology section explains the properties of the network with respect to adjacencies of the customers who are direct connected from one customer to the next. But the way that customers are embedded in networks is more complex than this. To explain the importance of distance analysis consider the two customers, call them A and B, might each have five friends. But suppose that none of customer A's friends have any friends except A. Customer B's five friends, in contrast, each have five friends. The information available to B and B's potential for influence is far greater than A's. That is, sometimes being a friend of a friend may be quite consequential. To capture this aspect of how individuals are embedded in networks, one main approach is to examine the distance that a customer is from others. The three measures of distance analysis are walks, geodesic distance and flow.
4.1 Walks in Telecom Networks
[image:4.595.58.294.338.559.2]Table 6: The Walk analysis of Telecom customers in a network
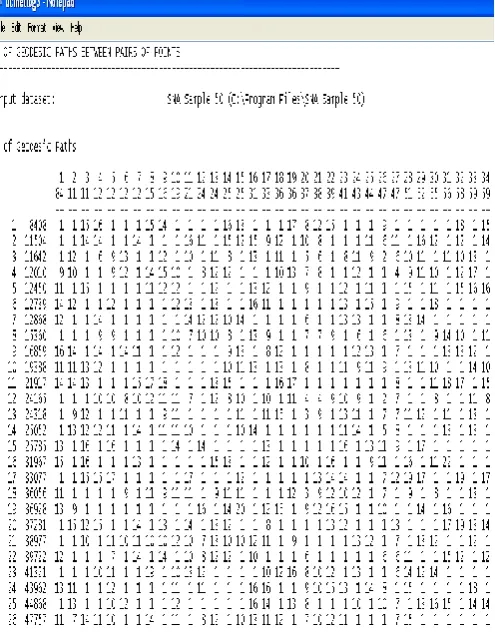
4.2 Geodesic Distance Analysis
Geodesic distance is the number of relations in the shortest possible walk from one customer to another. It is also possible to define the distance between two Customers where the links are valued the distance between two Customers is defined as the strength of the weakest path between them. The distance between two Customers is defined as the sum of the costs along the shortest pathway. The Table 7 shows the geodesic measures of social network of telecom customers.
Table 7: The Geodesic measures of Telecom network
4.3 Network Flow Analysis
The flow measures in a valued or binary network the value of each edge (1 or 0 for binary networks) can represent a capacity of flow of information from source to destination node in a network. It is computed by using the below formulae.
Let c(x) denotes the capacity of each edge of a network N.
A flow in N between two nodes s and t is a function f such that 0 ≤ f(x) ≤ c(x) for every edge x and for every node z ≠ s or t, (yz) = (zw).
So that for each node, except s and t, the total amount of flow into the node equals the total flow leaving the node.
The total flow leaving s is the same as that going into t, this value is called the value of the flow.
The maximum flow is simply the maximum value possible between two vertices.
Table 8: The Network flow measures of Telecom customers
5.
CONCLUSIONS
This paper focus the basic network analysis with respect to connection and distance between customers and a whole community of customers (Populations). There is a great deal of information about both individuals and the Population in a single adjacency matrix. The basic network analysis focuses on the immediate neighborhood of each customer, dyads and triads in which they are involved. The degree of the customer, deals with the extent to which customer may be constrained by, or constrain others. Connectivity measures deals with the extent to which customer can reach others in the network, in turn useful in describing customer’s social structure. In looking at the connections of customers, factors such as reciprocity, reachability, density and transitivity in relations can be regarded as important indicators of the stability and institutionalization of customer’s positions in social networks.
6.
REFERENCES
[1] Shaun Doyle, “Social network analysis in the Telco sector Marketing applications”, Journal of Database Marketing & Customer Strategy Management (2008) 15, pp130-134.doi: 10.1057/dbm.2008.8
[2] Chung fang Zhao, Yingliang Wu, HaijunGao “Study on Knowledge Acquisition of the Telecom Customer’ Consuming Behavior Based on Data Mining”, 2008 IEEE.
[3] Hong Feng Lai, “Identify implicit social network by RST/FL framework”, 2009, Advances in Social Network Analysis and Mining (IEEE Computer Society), pp.362- 363, DOI 10.1109/ASONAM.2009.62.
[4] Parthan Kasarapu M. Saravanan Prasad Garigipati, “Exploring Social Patterns in Mobile Data”, Second International Conference on Advances in Databases, Knowledge, and Data Applications, 2010, pp.62-68.
[5] Aarthi.S&Bharanidharan.SSaravanan.M&Anand.V,” Predicting Customer Demographics in A Mobile Social Networks” , 2011 International Conference on Advances in Social Networks Analysis and Mining (IEEE), pp553-554.
[6] Victor Ströele, Geraldo Zimbrão, Jano M. Souza,” Evaluating Knowledge Flow in Multi relational Scientific Social Networks “, Proceedings of the 2011 15th International Conference on Computer Supported Cooperative Work in Design, 2011 (IEEE), pp516-523.
[7] Hially Rodrigues de S´a and Ricardo B. C. Prudˆencio, “Supervised Link Prediction in Weighted Networks”, Proceedings of International Joint Conference on Neural Networks, San Jose, California, USA, July 31 August 5, 2011,pp 2281-2288.
[8] Namhyoung Kim ,“A New Ensemble Model for Efficient Churn Prediction in Mobile Telecommunication”, in 45th