Sparks, A and Marchant, D and Ellison, P and Bridge, CA and McNaughton, L and Mick-lewright, D (2017) Information acquisition differences of experienced and novice time trial cyclists. Medicine and Science in Sports and Exercise, 49 (9). pp. 1884-1898. ISSN 1530-0315 DOI: https://doi.org/10.1249/MSS.0000000000001304
Link to Leeds Beckett Repository record: http://eprints.leedsbeckett.ac.uk/4445/
Document Version: Article
The aim of the Leeds Beckett Repository is to provide open access to our research, as required by funder policies and permitted by publishers and copyright law.
The Leeds Beckett repository holds a wide range of publications, each of which has been checked for copyright and the relevant embargo period has been applied by the Research Services team.
We operate on a standard take-down policy. If you are the author or publisher of an output and you would like it removed from the repository, please contact us and we will investigate on a case-by-case basis.
Running Title: Eye-tracking Cycling Time-Trials
Information acquisition differences between experienced and novice time trial cyclists 1
2
1MANHAL BOYA, 2TOM FOULSHAM, 1FLORENTINA HETTINGA, 1DAVID PARRY, 4EMILY 3
WILLIAMS, 5HOLLIE JONES, 3ANDREW SPARKS, 3DAVID MARCHANT, 3PAUL ELLISON P, 4
3CRAIG BRIDGE, 3LARS MCNAUGHTON & 1DOMINIC MICKLEWRIGHT. 5
6
1Sport, Performance & Fatigue Research Unit, University of Essex, UK; 2Department of Psychology, 7
University of Essex, UK; 3Sport Performance Group, Edge Hill University, UK; 4School of Sport, Leeds 8
Beckett University, UK; 5School of Psychology, University of Central Lancashire, UK 9
10 11
12 13
Address for correspondence: Dominic Micklewright PhD, School of Biological Sciences, The University 14
of Essex, Wivenhoe Park, Colchester, Essex, UK. CO4 3SQ; E-mail: [email protected]. Tel: 15
+44(0)1206-872869; Fax +44(0)1206-872592. 16
17
18 19
Disclosure of Funding & Relationships: This study was funded entirely by the University of Essex and 20
no other sources of external funding were used. None of the authors have professional relationships with 21
companies or manufacturers who will benefit from the results of this study. None of the results presented 22
Abstract 25
Purpose: To use eye-tracking technology to directly compare information acquisition behavior of 26
experienced and novice cyclists during a self-paced 10 mile (16.1 km) time-trial. Method: Two groups 27
of novice (N=10) and experienced cyclists (N=10) performed a 10-mile self-paced time-trial (TT) on two 28
separate occasions during which a number of feedback variables (speed, distance, power output, 29
cadence, heart rate, and time) were projected within their view. A large RPE scale was also presented 30
next to the projected information and participants. Participants were fitted with a head-mounted eye-31
tracker and heart rate monitor. Results: Experienced cyclists performed both time-trials quicker than 32
novices (F1,18=6.8, P=.018) during which they primarily looked at speed (9 of 10 participants) whereas 33
novices primarily looked at distance (6 of 10 participants). Experienced cyclists looked at primary 34
information for longer than novices across the whole time-trial (24.5±4.2%vs. 34.2±6.1%, t18=4.2, 35
P<0.001) and less frequently than novices during the last quarter of the time-trial (49±19 vs. 80±32, t18 =-36
2.6, P=0.009). The most common combination of primary and secondary information looked at by 37
experienced cyclists was speed and distance respectively. Looking at ten different primary-secondary 38
feedback permutations, the novices were less consistent than the experienced cyclists in their 39
information acquisition behavior. Conclusion: This study challenges the importance placed on 40
knowledge of the endpoint to pacing in previous models, especially for experienced cyclists for whom 41
distance feedback was looked at secondary to, but in conjunction with, information about speed. Novice 42
cyclists have a greater dependence upon distance feedback, which they look at for shorter and more 43
frequent periods of time than the experienced cyclists. Experienced cyclists are more selective and 44
consistent in attention to feedback during time-trial cycling. 45
Keywords: Performance; Pacing; Cycling; Vision; Cognition; Decision 46
Introduction 48
(Paragraph 1) It is important for athletes to employ their available energy effectively to perform 49
optimally and avoid fatigue during exercise, so that “all energy stores are used before finishing a race, 50
but not so much that a meaningful slowdown occurs.” (8,18,29) Pacing strategy is an essential aspect of 51
competitive prolonged athletic performance and refers to the variation of speed during an event by 52
regulating the rate of energy expenditure (18–21,28). Where completion time is the measure of success, 53
pacing strategy has an influence over success in events lasting longer than 60 seconds (1). 54
(Paragraph 2) Several factors are known to influence the pacing strategy that an athlete adopts 55
including the duration of the event (8), presence of a competitor (7,57), environmental conditions (41), 56
previous experience (35), perceptions of exertion (49), and the availability and veracity of performance 57
feedback information (14,36). Previous models of pacing place a lot of emphasis on an athlete’s 58
awareness of changes to the internal physiological state of their body, experienced as perceived exertion, 59
in relation to their progress towards the endpoint as informed through various forms of feedback. 60
According to Teleoanticipation Theory (50) and later on the Central Governor Model (40), a ‘central 61
governor’ anticipates exercise and presets a pacing strategy based on the end-point or duration of 62
exercise. In a more recent manifestation of Central Governor Model, more complex information-63
processing mechanisms have been proposed in which rate of change of perceived exertion is evaluated in 64
the light of expected duration or distance of an event and modified through appropriate alternations in 65
pace (48). The Psychobiological Model similarly supports the notion of effort-related decisions about 66
pace in the context of event duration, but argues that such decisions are entirely conscious and that 67
subconscious processes, such as those proposed by the Central Governor Model, are inapposite (34). The 68
linear relationships found between RPE and the proportion of completed event, are such that the RPE 69
(Paragraph 3) In an attempt to factor for varying uncertainty about pace during endurance events, a 71
model has been specified whereby risk is expressed as the proportion of the remaining task multiplied by 72
their momentary RPE, a variable the authors refer to as hazard score (9). An appealing feature of the 73
hazard score model is that the further an athlete progresses, the lower hazard score becomes, thus 74
explaining how athletes are sometimes able to risk performing very intense spurts of energy towards the 75
end of an event when the risk of not-completing as a consequence of doing so is relatively low. An 76
alternative model proposed that pacing decisions are based upon the estimated time that present power 77
output can be maintained, as judged against the duration or length of the task (23). More recent 78
suggestions of how pace is regulated have drawn on the decision-making literature (42) and the 79
interdependence of perception and action in attempting to account for pacing behavior in 80
environmentally complex situations (45). 81
(Paragraph 4) Whatever theory of pacing is subscribed to, all emphasize knowledge of proximity to the 82
endpoint as a key determinant of pacing strategy. However, the importance placed on endpoint 83
knowledge in pacing models is based on experimental evidence that was collected using limited indirect 84
observation methods where participants have been deceived about, or deprived of, progression or 85
performance feedback information (30). A number of studies have used false feedback about distance or 86
time to understand the importance of feedback and the use of knowledge during exercise. Studies have 87
found that deceiving athletes about the duration of exercise, by providing false or no knowledge about 88
the exercise endpoint, leads to increased RPE and a different pacing strategy caused by an incorrect 89
allocation of physiological resources (3,12). Experience of using blind, true and false performance 90
feedback has also been found to provoke different types of learnt pacing strategies (38). 91
(Paragraph 5) Feedback deception and blinding experimental methods have been the dominant 92
significance and role of particular types of performance information are made based upon what happens 94
to pace if that information is altered or removed. The underlying logic is that if, after altering or 95
removing a particular source of information pacing or performance worsens, then it can be inferred that 96
that information source has an important contributory role. It has been this approach that has led to the 97
emphasis placed on knowledge of the endpoint in various pacing models. 98
(Paragraph 6) There are several limitations to this information-knockout approach. The first is the focus 99
on singular sources of information and the lack of investigative sophistication in understanding how 100
athletes interpret various sources of information in conjunction with each other. For example, the 101
importance athletes place on speed or power information to make pacing decisions could potentially vary 102
according to how much time or distance has elapsed, or according to environmental conditions or 103
competitor behavior. A further, but related, limitation is that knockout and deception studies have not 104
investigated within-trial changes in the emphasis placed on certain types of feedback. For example, 105
potentially an athlete may be more concerned with average speed in the first half of a race and then 106
become more interested in elapsed time or distance towards the end of an event. The final limitation is 107
the inability to understand individual differences in feedback preferences, which could vary according to 108
past experience or the outcome measure by which they appraise their achievement success. A threat to 109
the validity of previous pacing models is the reliance on limited deception and blinding methods, which 110
necessitated indirect interpretation regarding the importance of endpoint awareness as a determinant of 111
athletic pace. It is this point that the present study intended to redress. 112
(Paragraph 7) A more direct method of measuring what information athletes seek and use during self-113
paced exercise will greatly improve our understanding of pacing decisions and, to our knowledge, this 114
have never been achieved. In one study the frequency with which children looked at elapsed time during 115
more often towards the end of the run (6). While the methods of measuring information acquisition in 117
this study were quite basic, eye-tracking technology does provide a more sophisticated method of 118
directly measuring what information athletes look at during self-paced exercise. Unlike previous 119
deception and information-knockout studies, the precision with which information acquisition behavior 120
can be measured using eye-tracking technology is able to overcome the limitations of deception studies 121
discussed earlier. Importantly, eye-tracking enables detailed information to be gathered about how 122
athletes acquire information in dynamic and conjunctive ways during an exercise trial, as well as how 123
they learn to use information differently with experience to pace themselves. 124
(Paragraph 8) The use of eye-tracking technology in sport is a powerful method (11) that has enabled 125
researchers to develop better insights about perceptual-cognitive mechanisms of sport performance (24, 126
33). Mobile eye-tracking technology has proven especially versatile in allowing researchers to collect 127
data in many different sports domains where performance is dependent upon the ability perceive and 128
process complex information in often fast moving environments. In such situations, the visual is the 129
dominant mode of sensory feedback in the perceptual-action coupling (32), a system in which attention 130
to external cues enables the kind of adaptive movements required for the successful performance of 131
motor tasks such as catching or striking a ball. In the context of cycling, eye-tracking has provided 132
useful insights about the role of visual behaviour in balance and steering (51, 53) but has not been used 133
to understand information pick-up as part of the perceptual-action processes in regulating pace (45). 134
Eye-tracking technology has also provided considerable insights about differences in perceptual-135
cognitive mechanisms between expert and novice performers (24, 55), and this approach has great 136
potential in developing a better understanding of information acquisition and decision-making during 137
self-paced cycling. Generally, previous research has suggested that experts across many sports domains 138
a relevance to pacing theory because it raises the question of whether differences exist between expert 140
and novice cyclists about what information feedback they consider to be task relevant, and whether 141
differences exist in how frequently they refer to such information and for how long. 142
(Paragraph 9) While we acknowledge that the use of eye-tracking technology is fairly common-place in 143
sport domains and expertise research, the present study used eye-tracking technology in an original way 144
to better understand information acquisition and pacing behaviour in cyclists. The purpose was, for the 145
first time, to directly measure what information cyclists look at while performing a time-trial, and to 146
compare the information-acquisition strategies of novice and experienced cyclists. We hypothesized that 147
experienced cyclists would look at fewer sources of information, and would seek out information less 148
frequently compared to novices. 149
Methods 150
Participants 151
(Paragraph 10) Experienced (n=10) and novice male cyclists (n=10) were recruited for this study from 152
the University of Essex and local cycling clubs. Mean ± 1SD age, stature and body mass for the 153
experienced cyclists was 38.6 ± 11.3 years, 176.6 ± 6.9 cm and 74 ± 9.4 kg for the experienced cyclists, 154
and for the novice cyclists was 36.1 ± 9.9 years, 178.5 ± 6.7 cm and 80.2 ± 8.7 kg. The experienced 155
cyclists were recruited from local cycling clubs and had participated in competitive 16.1 km time-trials 156
for an average of 14.1 ± 13 years. During the 6 months preceding the study, the experienced cyclists had 157
on average trained each week on 4.7 ± 1.1 occasions for a total of 8.5 ± 2.1 hours. The novice cyclists 158
were recruited from the University of Essex staff and students and, although they could all ride a bicycle, 159
they had never trained for, or participated in competitive cycling events of any kind. In an attempt to 160
control for fitness, only physically active individuals were recruited to the novice group who had on 161
sports that did not involve cycling. Each participant provided written informed consent to take part in 163
this study, which was approved by the University of Essex ethics committee. 164
Design 165
(Paragraph 11) A two-way mixed experimental design (experience-by-segment) was used in which we 166
compared pace, performance and visual information acquisition between novice and experienced cyclists 167
(between-subjects experience factor) during a 16.1 km cycling time-trial every 4 km (within-subjects 168
segment factor). All participants performed a 16.1 km familiarization time trial (TTFAM) and then had a 169
recovery period of 5 to 10 days before completing the 16.1 km experimental time-trial (TTEXP). During 170
each time-trial completion time (s), speed (km.hr-1), power output (W), distance (km), pedaling cadence 171
(r.min-1) and heart rate (b.min-1) was measured. RPE was recorded every 4 km. Participants wore a 172
monocular eye-tracking device for familiarization purposes during TTFAM and then to measure the type, 173
duration and frequency of information they looked at during TTEXP. 174
Procedure 175
(Paragraph 12) Before each time-trial participants were asked to refrain from ingesting caffeine for at 176
least 6 hours, alcohol for 24 hours and food for 2 hours prior to testing. Participants were also asked not 177
to train or engage in heavy physical work for 24 hours before testing. On the first laboratory attendance 178
each participant had their body mass and stature measured and was briefed as to the requirements of the 179
trial but not the purpose of the study. Participants also completed a short training history questionnaire. 180
After all tests had been completed, participants were debriefed about the purpose of the study. 181
Cycling Ergometry and Video Simulation 182
(Paragraph 13) All cycling tests were performed on a Velotron (3D) Racer Mate ergometer with 183
RealVideo simulation software (Racermate, Seattle). The 16.1 km time-trial duration was selected as this 184
accustomed. All cycling tests were performed at the same time of day ± one hour to control for circadian 186
variation in outcome measures. Prior to each time-trial, participants performed a standardized 5-minute 187
self-paced warm-up. Participants were instructed to complete the time-trial in the fastest possible time. 188
They were not provided with any information acquisition or pacing guidance. 189
(Paragraph 14) During each time-trial, a RealVideo simulated cycling course was projected onto a wall 190
in front of and slightly offset to the right of the cycling. The projected video footage was coupled in a 191
multiplicative way to the cyclists’ actual power output such that any alteration in speed was instantly 192
represented on the screen. Notwithstanding minor projector repositioning variances, the projected screen 193
size was 2.1 m wide by 1.5 m high with the bottom border of the projection running 1 m above and 194
parallel to the floor. The cycle ergometer was positioned such that the handlebar stem riser was 3 m 195
perpendicular to the plane of the screen which itself was offset to the right of the natural forward field of 196
vision of the cyclists with a vector displacement of 8 at 3.03 m for the left border of the projection and 197
40 at 3.91 m for the right border (visual arc 32). Offsetting the screen in this way required participants 198
to rotate their neck to look at the projected information, thus adding confidence that the eye-tracking 199
measurements constituted deliberate attempts to acquire information, rather than information glances just 200
because it happened to fall naturally within participants forward field of vision. 201
(Paragraph 15) Incorporated into the projection beneath the simulated time-trial video, were five fields 202
of real-time feedback information which, presented from left to right, were speed (km.hr-1), elapsed 203
distance (km), power output (W), pedaling cadence (r.min-1) and heart rate (b.min-1). The row of five 204
feedback information fields were 0.375 m above and parallel to the bottom border of the projection or 205
1.375 m above the floor. The vector displacement of the center of each information field from the 206
handlebar stem riser was speed (9.5, 3.04 m), elapsed distance (18.1, 3.16 m), power output (26.0, 207
displayed above the heart rate field (3.0, 0.2 m). The block size of individual characters within each 209
field was 4.5 cm high by 2.9 cm wide. Angular separation of the information fields was at its most acute 210
3 (elapsed time – heart rate) and at its least acute 8.6 (elapsed distance - speed), well beyond the 211
manufacturer-defined eye-tracker spatial resolution of 0.1˚ and gaze position accuracy within the nearest 212
degree. The size and separation of the projected information blocks therefore facilitated clear 213
differentiation in eye-tracker measurements as later described. An A0 sized RPE scale was also 214
displayed to the left of the projector screen. 215
Psychophysiological Measures 216
(Paragraph 16) Heart rate (HR) was recorded during both cycling time-trials every (120) milliseconds 217
using a chest strap Polar Accurex Plus heart rate monitor (Polar Electro. Kempele, Finland) connected 218
via wireless to the Velotron software. Average HR was calculated every 4 km. Participants were asked to 219
provide an overall rating of perceived exertion every 4 km using the Borg 6-10 RPE scale (5). All 220
subjects were familiarised with the RPE scale, which was administered in accordance with published 221
standardised instructions (4). 222
Eye-Tracking and Video Analysis 223
(Paragraph 17) Participants were fitted with a SensoMotoric Instruments SMI iViewX head-mounted 224
monocular eye-tracking device (HED). The system consists of two cameras mounted on a cycling 225
helmet, one that records the eye position of the participant, and a 3.6 mm wide-angle forward-looking 226
camera that records the scene the participant is looking at. Eye position was recorded at 50 Hz, which 227
was then down-sampled to 25 frames per second for the resulting scene videos. The eye-tracker was 228
calibrated using the participant’s left eye in accordance with the manufacturer’s instructions by asking 229
participants to fixate a series of markers spanning the area of the display. Calibration accuracy was 230
screen and information display. The equipment has a manufacturer-defined spatial resolution of 0.1˚ and 232
tests demonstrated that gaze position was accurate to within the nearest degree. The system tracks eye 233
movements using pupil and corneal reflex so that each participant’s point of regard can be superimposed 234
onto the recorded scene, thus enabling timed measurements to be made of eye fixations. 235
(Paragraph 18) The eye-tracking videos for TTEXP were subsequently reviewed and manually coded by 236
the first author. Manual coding of eye-tracking data remains the state-of-the-art in active tasks, (52) and 237
within-coder comparisons indicated that gaze location could be determined unambiguously. Reliability 238
of similar methods have shown very good inter-rater reliability (22). Due to the relatively low sampling 239
rate of the eye-tracker, saccades could not be automatically detected, but fixations were only coded when 240
data was within the same region for at least 3 frames ( 100 ms). Eye gaze was coded by recording the 241
start and end frame of each entry into a new region of interest. This allowed us to determine the periods 242
of time spent inspecting each of then eye fixation times were manually recorded in milliseconds against 243
nine predetermined categories. Six of the categories related to information feedback that were speed, 244
elapsed distance, power output, cadence, heart rate and elapsed time. Eye fixation times were also 245
recorded for the rating of perceived exertion and the video simulation of the time-trial course that was 246
projected onto the wall. A final category was created to capture all other objects of regard not 247
corresponding to the other eight categories, for example, when participants looked at the laboratory floor 248
or at laboratory equipment. Fixations of less than 3 frames, blinks and other periods of data loss (e.g. 249
when participants looked at extreme angles) were also included in the ‘other’ coding category. This 250
procedure allowed detailed coding of point of regard for the whole length of the time trial. 251
Data Processing and Statistical Analysis 252
(Paragraph 19) Total gaze time and gaze frequency for each of the nine categories (speed, elapsed 253
a participant-by-participant basis for the whole time-trial and for each 4 km segment. Gaze frequency, 255
defined as the number of separate eye fixations for each category, and total gaze time, defined as the 256
accumulated time of all eye fixations for each category, were calculated for each participant across the 257
whole time-trial and for each segment. Total gaze times were then used to determine what information 258
source that each participant looked at for longest accumulated average time (primary), second longest 259
accumulated average time (secondary), third longest accumulated average time (tertiary) and so on until 260
quaternary (4th), quinary (5th), senary (6th), septenary (7th), octonary (8th) and nonary (9th) had all been 261
established. To normalize absolute total gaze times for inter-participant differences in time-trial 262
performance, primary to nonary fixation data were all converted from absolute time (ms) to percentage 263
of time-trial completion time. 264
(Paragraph 20) Time-trial average cycling speed (performance) interactions between experienced and 265
novice cyclists, and between the first and second time-trials was analysed using two-way mixed 266
ANOVAs. Three-way mixed ANOVAs were used to analyse group-by-trial-by-segment interactions in 267
average cycling speed (pace) as well as relative fixation time and gaze frequency for the primary, 268
secondary and tertiary visual categories. 269
(Paragraph 21) For both performance, pace and visual data, significant interactions were followed up 270
using planned post-hoc comparisons between segments using paired-samples t tests for within-group 271
comparisons and independent sample t tests for between-group comparisons. Paired-samples t tests were 272
also used to compare within group comparison and RPE values. All results are expressed as mean (SD) 273
and effect sizes as partial eta squared. 274
Results 275
(Paragraph 22) Two-way mixed ANOVAs revealed the following experience and trial factor outcomes. 277
Average cycling speed: No group-by-trial interaction (F1,18=2.7, P=.082, ηp2=.16) but there was a group 278
main effect (F1,18=6.8, P=.018, ηp2=.27) and a trial main effect (F1,18=11.2, P=.004, ηp2=.38). Completion 279
time: No group-by-trial interaction (F1,18=2.7, P=.082, ηp2=.16) but there was a group main effect 280
(F1,18=6.8, P=.018, ηp2=.27) and a trial main effect (F1,18=11.2, P=.004, ηp2=.38). Average power output: 281
No group-by-trial interaction (F1,18=0.6, P=.440, ηp2=.03) but there was a group main effect (F1,18=10.8, 282
P=.004, ηp2=.38) and a trial main effect (F1,18=11.6, P=.003, ηp2=.39). Average pedaling cadence: No 283
group-by-trial interaction (F1,18=0.1, P=.740, ηp2<.01) or trial main effect (F1,18=3.6, P=.07, ηp2=.17) but 284
there was a group main effect (F1,18=12.7, P=.002, ηp2=.414). Average heart rate: No group-by-trial 285
interaction (F1,18=0.3, P=.086, ηp2<.01), no group main effect (F1,18<0.1, P=.945, ηp2<.01) and no trial 286
main effect (F1,18=0.2, P=.646, ηp2=.01). Average RPE: No group-by-trial interaction ( F1,18<0.1, P=.929, 287
ηp2<.01), no group main effect (F1,18=0.4, P=.518, ηp2=.02) and no trial main effect (F1,18=0.9, P=.361, 288
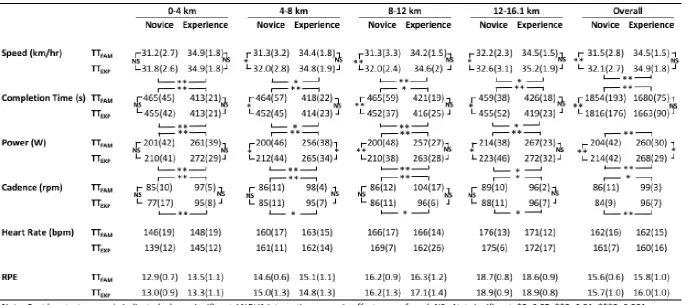
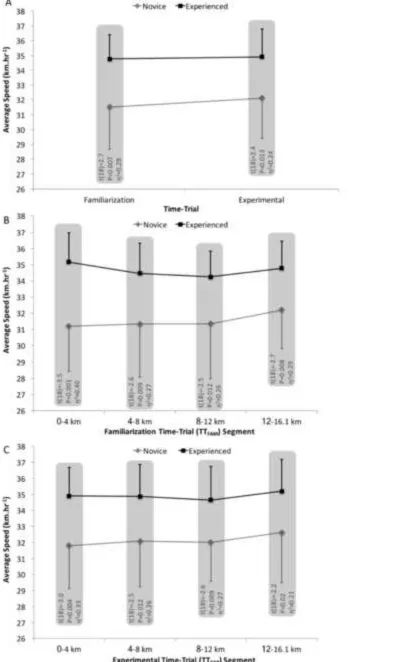
ηp2=.05). Group and trial differences in performance, heart rate and RPE variables are presented in 289
Figure 1A, with post-hoc statistical outcomes indicated for significant differences between novice and 290
experienced cyclists (independent samples t-tests) and between familiarization and experimental time-291
trials (paired samples t-tests). 292
Segment Comparisons of Performance, Heart Rate and RPE 293
(Paragraph 23) There were no group-by-trial-by-segment interactions or two-way interactions for 294
speed, completion time, power, cadence, heart rate or RPE. Trial main effects were found for speed 295
(F1,18=12.9, P=0.002, ηp2=.42), completion time (F1,18=12.9, P=0.002, ηp2=.42) and power (F1,18=11.5, 296
P=0.003, ηp2=.39). Segment main effects were found for speed (F3,54=4.3, P=0.009, ηp2=.19), completion 297
time (F3,54=4.3, P=0.009, ηp2=.19), power (F3,54=6.9, P=0.001, ηp2=.28), heart rate (F3,54=101, P<0.001, 298
P=0.012, ηp2=.31), completion time (F1,18=7.9, P=0.012, ηp2=.31), power (F1,18=10.8, P=0.004, ηp2=.38) 300
and cadence (F1,18=12.7, P=0.002, ηp2=.414). Post hoc independent samples t-tests found experienced 301
cyclists were faster than novices during every time-trial segment, in both TTFAM and TTEXP. Group and 302
segment differences in pace with post-hoc outcomes are presented in Figure 1B for TTFAM and in Figure 303
1C for TTEXP. Mean and standard deviation data for speed, completion time, power, cadence, heart rate 304
and RPE are given in Table 1 for each group, time-trial and segment along with post hoc statistical test 305
outcomes. 306
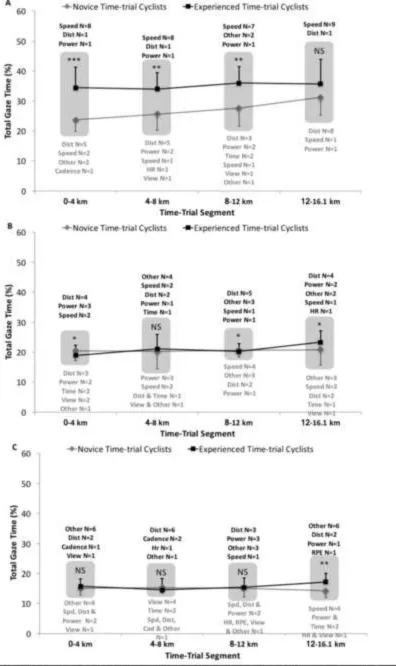
Whole Time-Trial Eye-Tracking Outcomes: Total Gaze Duration and Gaze Frequency 307
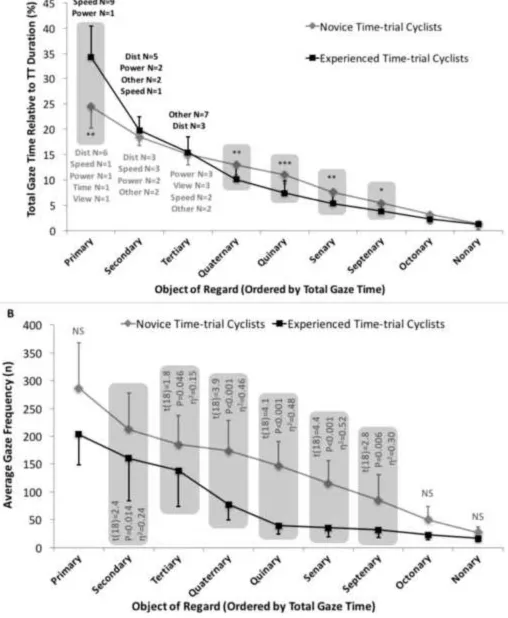
(Paragraph 24) Novice and Experienced mean total gaze duration data for primary through to nonary 308
points of regard were calculated over the full 16.1 km for TTEXP and are presented in Figure 2A. A two-309
way mixed ANOVA found a group-by-point of regard interaction for total gaze duration (% time-trial 310
duration), F8,144=10.9, P<0.001, ηp2=.38. Independent-samples post-hoc t-tests revealed that experienced 311
cyclists looked at primary points of regard for longer than novices during TTEXP (34.2 ± 6.1% vs. 312
24.5±4.2%, t18=-4.2, P<0.001, η2=0.49). Other experienced vs. novice post-hoc outcomes for total gaze 313
time are represented in Figure 2A. 314
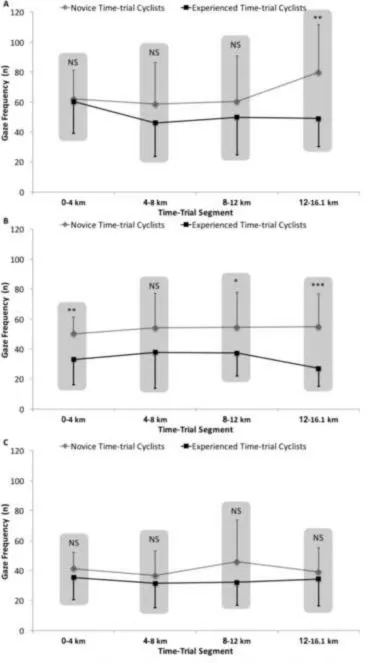
(Paragraph 25) The frequency of which novice and experienced participants looked at primary through 315
to nonary points of regard was counted overall for TTEXP and is presented in Figure 2B. A two-way 316
mixed ANOVA found a group-by-point of regard interaction for gaze frequency, F8,144=2.2, P=0.03, 317
ηp2=0.11. Independent-samples post-hoc t-tests revealed that experienced cyclists looked at information 318
less frequently than novices (Figure 2B). 319
Time-Trial Segment Eye-Tracking Outcomes: Total Gaze Duration and Frequency 320
(Paragraph 26) Segment changes in gaze duration and gaze frequency were analysed using two-way 321
total gaze duration for the primary point of regard (F1,18=16, P<0.001, ηP2=0.47) and the secondary point 323
of regard (F1,18=6.7, P=0.02, ηP2=0.27) but not the tertiary point of regard. No segment main effects or 324
segment-by-group interactions were found for primary, secondary or tertiary points of regard (Figures 325
3A-C). For gaze frequency of the primary point of regard a segment-by-group interaction was found 326
(F3,54=3.4, P=0.02, ηP2=0.16) and a segment main effect (F3,54=2.8, P=0.05, ηP2=0.13) but not a group 327
main effect. For gaze frequency of the secondary point of regard only a group main effect was found 328
(F1,18=8.9, P=0.008, ηP2=0.33) with no segment main effect or segment-by-group main effect. There 329
were no gaze frequency interactions or main effects for the tertiary point of regard (Figures 4A-C). 330
(Paragraph 27) Group-by-trial-by-segment analysis for quaternary through to nonary points of regard 331
are excluded from this article for the sake of brevity, owing to the large amount of statistical data. We 332
also believe that the analysis of gaze data beyond the three most looked at points of regard are unlikely 333
to yield significant insights about systematic perceptual patterns, pacing and performance. 334
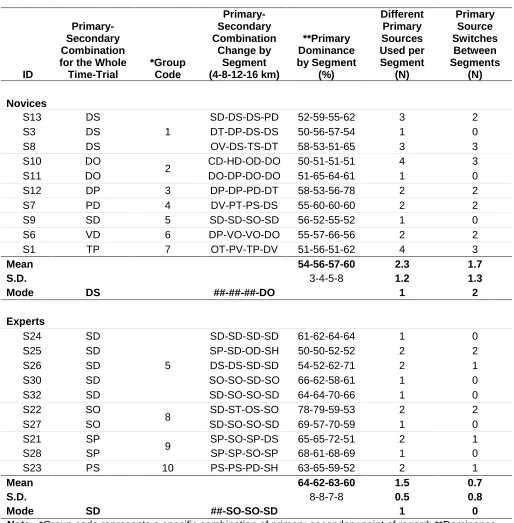
Primary-Secondary Point of Regard Combinations 335
(Paragraph 28) Data is presented in Table 2 shows the combination of primary and secondary points of 336
regard that participants looked at across the entire experimental time-trial and on a segment-by-segment 337
basis. Individual participant data is present in an attempt to convey the complex, yet in some instances 338
similar, patterns of information that participants looked at during the time-trial. Seven primary-339
secondary point of regard combinations were observed for the novice group during TTEXP, whereas the 340
experienced cyclists exhibited only three primary-secondary point of regard combinations. 341
(Paragraph 29) Mann-Whitney non-parametric comparisons were made between novices and 342
experienced cyclists in the number of primary points of regard they looked at in each segment and the 343
number of times they switched what they primarily looked at between segments. Results showed a lower 344
(1.7±0.8vs. 2.8±0.9, U=19.5, Z=-2.41, P=0.008). From segment to segment, the number of times 346
participants switched to a different primary point of regard was lower among the experienced cyclists 347
compared to novices (1.3±1.4vs. 2.3±0.9, U=31, Z=-1.53, P=0.064). Primary point of regard and switch 348
data is given in Table 2. 349
(Paragraph 30) A two-way mixed ANOVA found a group-by-segment interaction for the percent 350
dominance of the primary point of regard in the primary-secondary combination, F3,54=4.4, P=0.05, 351
ηp2=.20, a group main effect, F1,18=9.4, P=0.007, ηp2=.34, but no segment main effect, F3,54=0.4, P=0.52, 352
ηp2=.02. Independent-samples post-hoc t-tests revealed that dominance of the primary point of regard in 353
the primary-secondary combination was greater among experienced cyclists compared to novices for the 354
0-4 km segment (63.8±7.8% vs. 53.6±3.2%, t18=-3.8, P<0.001, η2=0.45), the 4-8 km segment 355
(61.7±8.0% vs. 56.2±4.3%, t18=-1.9, P=0.036, η2=0.17), the 8-12 km segment (63.4±6.5% vs. 356
56.6±5.3%, t18=-2.6, P=0.01, η2=0.27) but not the final 12-16.1 km segment (59.8±7.6% vs. 60.1±7.8%, 357
t18=0.1, P=0.93, η2<0.01). Group-by-trial-by-segment primary dominance values are given in Table 2. 358
Discussion 359
(Paragraph 31) This study was the first to make direct measurements of information-acquisition 360
behavior among time-trial cyclists and constitutes a significant step forward in our understanding of 361
endurance exercise pacing mechanisms. It seems that patterns of information acquisition during a self-362
paced cycling time trials are very complex and that pacing behavior is not necessarily universally 363
informed by the integration of endpoint awareness and perceived exertion, as previous models have 364
argued (9,15,20,23,40,46,48,50). This is because we observed that, firstly, cyclists refer to different 365
types of information according to their experience, with experienced cyclists primarily looking at speed 366
and novices primarily looking at distance (Fig 2A). Secondly, experienced cyclists appear to be more 367
information, which they look at for longer (Fig 2A) and less frequently (Fig 2B). Thirdly, novices 369
increased the duration (Fig 3A) and frequency (Fig 4A) of looking at their primary information source 370
during the final segment of the time-trial but experienced cyclists were more constant throughout the 371
trials. Finally, with only four different combinations of primary and secondary information used by the 372
experienced cyclists, there was better commonality in what information they looked at compared to the 373
novices who used seven primary-secondary information combinations (Table 2). Our finding that 374
experienced cyclists refer to task-relevant information less often is consistent with a meta-analysis of 375
eye-tracking studies of expert performers (24), yet our findings that experienced cyclists fixate for longer 376
than novices is not consistent with the meta-analysis (24). This maybe because, as acknowledged by the 377
authors of the meta-analysis, the type of sport task may moderate expert-novice differences in visual 378
behavior compared to other domains (24). Experienced cyclists also tended to stick to a primary 379
information source throughout the time-trial, whereas novices switched the type of information they 380
primarily looked at between segments much more often (Table 2). We are not suggesting that endpoint 381
awareness is not important in pacing regulation, clearly it is given how often it featured as either a 382
primary or secondary point of regard in our findings (Table 2). Our argument is that previous pacing 383
models are deficient in accounting for variations in information acquisition that we have found 384
attributable to individual preference, expertise or event segment. It seems that in simulated time-trial 385
cycling experienced cyclists look at speed more than distance, whereas distance feedback appears to be 386
what novices seek out more. 387
(Paragraph 32) An important finding of this study was that experienced and novice cyclists differed in 388
the types of information they looked at during the experimental time trial. The majority of the 389
experienced cyclists (9 of 10 participants) tended to look at speed most across the whole time trial. In 390
novices (4 of 10 participants) chose to primarily look at other information too. In addition to experienced 392
cyclists being more consistent in what information they look at, of note is that they looked at primary 393
information for longer and less frequently. 394
(Paragraph 33) While the eye-tracking data we have collected reveals a lot about how time-trial cyclists 395
acquire information, it does not tell us anything about how the information is integrated and processed, 396
or the decisions they have made. For this, other process-tracing methods such as think aloud protocols, 397
may usefully compliment eye-tracking in the study of decision-making and pacing. This is because that, 398
while eye-tracking technology provides a powerful method for measure information acquisition 399
processes, it reveals nothing about how that information is subsequently processed. Although longer eye 400
fixation times have been linked to greater depth of processing (16,26,43,44), rather than assuming this to 401
be the case in future pacing studies, it would be preferable to use eye-tracking in conjunction with think 402
aloud protocols to directly capture information processes. Nevertheless, the results of the present study 403
so highlight differences in information acquisition between novice and experienced time-trial cyclists 404
that bring to question the common information-processing mechanisms put forward by previous pacing 405
models (9,15,18,23,31,34,40,42,45,50). In particular, the assumption in previous pacing models that the 406
integration of endpoint awareness with perceived exertion is the primary and universal driver of pacing 407
decisions, regardless of athletic experience or individual feedback preferences. It may be that decision-408
making among experienced cyclists was different to novices and indeed different between individuals 409
which resulted in a need to seek out more varied sources of information. This is consistent with the idea 410
that individuals use information in an adaptive way according to the perceived demands of a situation or 411
problem (25). Thus, it could be that distance information is still important to experienced cyclists but, 412
owing to their previous experience, they are able to process and integrate such information much more 413
were experienced at performing the 16.1 km time-trial format, it is also quite likely that their need to 415
refer to distance information was less than novices unaccustomed to cycling such a distance. The extent 416
to which information acquisition differences between experienced and novice cyclists are attributable to 417
distance familiarity, is something that could be tested by using the same experimental protocol but with 418
an unfamiliar time trial distance. While it is well established that experience influences pacing strategy 419
(19,35,38), our findings further show that information acquisition strategies accompanying pacing 420
behavior also vary with previous experience. 421
(Paragraph 34) As expected the experienced cyclists completed both time-trials faster than the novices, 422
with both groups exhibiting a mostly constant pace throughout. Owing to imperfect fitness matching 423
between the novice and experienced cyclists, we cannot conclude that that time-trial performance 424
differences between the groups was exclusively due to experience differences. While in future studies 425
greater effort should be made to measure associations between moment-by-moment change in gaze and 426
pacing time-series data (37), in this study we have limited our analysis to detecting concomitant changes 427
in gaze and pace at a segment-by-segment level. What our data clearly shows is that, whatever type of 428
information is preferred as the primary reference, the experienced cyclists looked at it for longer than the 429
novices but less frequently. As previously discussed, this is broadly consistent with previous expertise 430
literature (24). During the second time-trial the experienced cyclists increased the relative amount of 431
time they spent looking at the primary information source from 30 to 35% showing that they became 432
more selective in what information they referred to. The shallower curves presented in Figure 2A also 433
shows that novices tended to distribute their attention across a number of different information sources, 434
spending more time looking at quaternary to octonary sources of information compared to the 435
experienced cyclists. The notion that experienced cyclists are more selective in what feedback they look 436
the first three segments, the experienced cyclists on average spent between 5-10% longer than novices 438
looking at the primary point of regard. It was only in the last segment of the time-trials from 12-16.1 km, 439
that the novices increase both the amount of time and the frequency with which they look at the primary 440
information source close to that of the experienced cyclists. The increased information acquisition 441
behavior towards the end of the time-trial is consistent with the behavior observed in children during a 442
self-paced running task (6), further supporting the idea that feedback-dependency is more strongly 443
associated with proximity to the end-point among inexperienced athletes compared to experienced 444
athletes. 445
(Paragraph 35) The data from our study indicates greater consistency in experienced cyclists’ approach 446
to information acquisition both in terms in inter- and intra-participant behavior. Inter-participant 447
consistency is evident in the data showing that 9 of 10 experienced cyclists chose to primarily look at 448
speed. Even when combinations of information sources are considered, experienced cyclists consistency 449
chose either speed-distance (5/10), speed-other (2/10) or speed-power (2/10) as the combination of 450
primary and secondary points of regard. In fact, the experienced cyclists only exhibited four different 451
primary-secondary information combinations, whereas seven different primary-secondary combinations 452
were observed among the novices (Table 2). 453
(Paragraph 36) Greater intra-participant consistency among the experienced cyclists is apparent owing 454
to the fact that on a segment-by-segment basis, the modal primary-secondary combinations were speed-455
distance and speed other, but for the novices it was often not possible to specify a modal combination 456
because the primary-secondary permutations were so varied. On average novices used 2.3 different 457
primary information sources across the four segments compared to 1.5 for the experienced cyclists. 458
Novices also tended to switch primary information sources between segments more frequently than the 459
(Paragraph 37) The primary-secondary combination data presented in Table 2 is also interesting 461
because it highlights that distance is still an important reference source to experienced cyclists, but only 462
secondary to and in combination with speed. In contrast, distance feedback appears to be the most 463
dominant type of information they refer to in combination with many other types of secondary 464
information. A lot of emphasis has been placed the role of the endpoint in influencing pacing 465
(2,3,9,15,19,31,34,40,46,50) support for which being found in a number of studies where deception or 466
blinding methods have been used (3,12,30,38). However, our study shows that the importance placed on 467
knowledge of the end-point may be overstated in most pacing models and that, knowledge of the 468
endpoint may in fact be a secondary to information about speed in informing the actions of experienced 469
cyclists. Another interesting outcome of this study is that perceived exertion did not feature in the 470
primary-secondary information acquisition combinations for any of the participants (Table 2), and that, 471
whether experienced or novice cyclists, all looked at least three other sources of information in 472
preference to the 6-20 RPE scale (Fig 2). That does not mean perceived exertion is not an important 473
factor in pacing decisions as predicted by many of the previous models. It does however, highlight to 474
methodological complexities of investigating pacing decisions in terms of the acquisition and utilization 475
of external referents, which can be easily observed using methods like eye-tracking, and the integration 476
of internal bodily referents such as perceived exertion, which cannot be directly observed. This particular 477
problem warrants innovative research using process-tracing methods of the kind described in much more 478
detail elsewhere (37). 479
(Paragraph 38) This eye-tracking study has produced some important new data not entirely consistent 480
with previous models of pacing about the attention to, and use of, feedback information. Nevertheless, 481
there are a number of limitations associated with the laboratory-based nature of this experiment and the 482
cycle ergometer under conditions where certain demands on the visual system were absent, for example 484
those associated with balancing, navigating, negotiating hazards and avoiding collisions as reported 485
elsewhere (51, 53). Furthermore, differences between laboratory and real-world visual behavior have 486
been reported in several studies, the most notable findings being more centralized fixations in the real 487
world (17), a tendancy to fixate on closer objects in the laboratory (17), and earlier longer object 488
fixations in the realworld (10). Therefore, it cannot be assumed that, during road-based time-trials, the 489
capacity to attend to performance information will be the same as reported in this experiment since it 490
will compete with, or be interrupted by, other demands placed on the visual system. In the future, with 491
careful configuration of mobile eye-tracking technology, it may be possible to measure the attention to 492
performance information in field-based studies with associated improvements in ecological validity. 493
(Paragraph 39) Another limitation of this study relates to the link between visual information, decision-494
making processes and pacing behavior. While there is some evidence that what individuals look at is 495
associated with their choices (16,26,43,44), it is unclear whether visual attention influences choice or 496
simply reflects a choice that has been made (44). In our study the issue is further complicated by the 497
difficulties of quantifying a pacing choice, since the method of detecting a meaningful change in pace 498
from either speed or power time-series data is mathematically complex (41). Even if it were possible to 499
precisely identify moments where a decision had been made to increase or decrease pace, decisions to 500
maintain pace would clearly be impossible to detect, as they would not be indirectly reflected in time-501
series data. In this study, conclusions about the link between visual attention and pacing decisions, are 502
deduced from the associated changes in vision and pace observed at a segment-by-segment level. In 503
future, greater precision about the association between visual attention to performance information and 504
pace could be investigated by setting up experiments were cyclists are presented with pacing dilemma 505
(Paragraph 40) Finally, with regards to information acquisition and decision-making during endurance 507
sport, further consideration is needed regarding fatigue related constraints on visual behavior as 508
predicted in Newell’s model (39) because they are often overlooked (56). A relationship between fatigue 509
and declining visual attention was found in one interesting study where increased levels of exertion 510
among biathletes was associated with reduced visual behavior before making a rifle shot (54). Saccadic 511
eye-movements are so fast and energetically efficient (47) that they are less likely to be responsible for 512
such effects compared to high-order cognitive processes such as attention allocation mechanisms which 513
have themselves been found to become fatigued as characterized by reduced capability to suppress 514
irrelevant external cues (13). Such factors are likely to impact information acquisition and decision-515
making during endurance sport and warrant further investigation. 516
Conclusions 517
(Paragraph 41) Although perhaps counterintuitive, this study challenges the degree of importance 518
placed on knowledge of the endpoint to pacing in previous models. This is especially true for 519
experienced cyclists for whom distance feedback was looked at secondary to, but in conjunction with 520
information about speed. Novice cyclists appear to have a greater dependence upon distance feedback, 521
which they look at for shorter and more frequent periods of time than the experienced cyclists. 522
Experienced cyclists are more selective in the information they refer to during a time-trial and they are 523
also more consistent in the combination of primary and secondary information they use, and more 524
consistent between various phases of a time-trial. The difference in information acquisition behavior 525
observed in this study may reflect differences in motivational regulators, with experienced cyclists 526
perhaps focusing more strongly on performing at the fastest speed and novices focusing on completion 527
(Paragraph 42) This study is the first to directly measure cyclists’ information acquisition behavior 529
during a time-trial and the data shows that the information athletes attend to and use during self-paced 530
endurance tasks is much more complex than previously assumed and not necessarily dominated by 531
knowledge of the endpoint. The limitations associated with this study are that it cannot be assumed 532
information acquisition would be the same during a road-based time-trial. There are also improvements 533
to the analysis of time-series performance data that are needed to reveal hidden moments where a 534
decision to alter pace has been made so that corresponding gaze behavior can be interrogated with 535
greater precision. Nevertheless, this study has produced some exciting new insights about the 536
information acquisition strategies of experienced and novice cyclists, as well as a new method for 537
investigating visual attention and decision-making during paced exercise. 538
539
540 541
Acknowledgements 542
(Paragraph number 43) This study was funded entirely by the University of Essex and no other sources 543
of external funding were used. None of the authors have professional relationships with companies or 544
manufacturers who will benefit from the results of this study. The results of the study are presented 545
clearly, honestly, and without fabrication, falsification, or inappropriate data manipulation. None of the 546
References 548
1. Albertus Y, Tucker R, Gibson ASC, Lambert EV, Hampson DB, Noakes TD. Effect of Distance 549
Feedback on Pacing Strategy and Perceived Exertion during Cycling. Med Sci Sports Exerc 550
2005;37(3):461–8. 551
2. Ansley L, Robson PJ, St Clair Gibson A, Noakes TD. Anticipatory pacing strategies during 552
supramaximal exercise lasting longer than 30 s. Med Sci Sports Exerc 2004;36(2):309–14. 553
3. Billaut F, Bishop DJ, Schaerz S, Noakes TD. Influence of knowledge of sprint number on pacing 554
during repeated-sprint exercise. Med Sci Sports Exerc 2011;43(4):665–72. 555
4. Borg G. Borg’s perceived exertion and pain scales. Champaign (IL): Human Kinetics. 1998. p. 44– 556
9. 557
5. Borg G. Perceived exertion as an indicator of somatic stress. Scand J Rehabil Med 1970;2(2):92–8. 558
6. Chinnasamy C, St Clair Gibson A, Micklewright D. Effect of spatial and temporal cues on athletic 559
pacing in schoolchildren. Med Sci Sports Exerc 2013;45(2):395–402. 560
7. Corbett J, Barwood MJ, Ouzounoglou A, Thelwell R, Dicks M. Influence of competition on 561
performance and pacing during cycling exercise. Med Sci Sports Exerc 2012;44(3):509–15. 562
8. DeKoning JJ, Bobbert MF, Foster C. Determination of optimal pacing strategy in track cycling 563
with an energy flow model. J Sci Med Sport 1999;2(3):266–77. 564
9. DeKoning JJ, Foster C, Bakkum A, et al. Regulation of pacing strategy during athletic competition. 565
PLoS One 2011;6(1):e15863. 566
10. Dicks M, Button C, Davids K. Examination of gaze behaviors under in situ and video simulation 567
task constraints reveals differences in information pickup for perception and action. Attention 568
11. Discombe RM, Cotterill ST. Eye tracking in sport: A guide for new and aspiring researchers. Sport 570
Exerc Psychol Rev 2015;11:49-58. 571
12. Eston R, Stansfield R, Westoby P, Parfitt G. Effect of deception and expected exercise duration on 572
psychological and physiological variables during treadmill running and cycling. Psychophysiology 573
2012;49(4):462–9. 574
13. Faber LG, Maurits NM, Lorist MM. Mental fatigue affects visual selective attention. PloS one 575
2012;7(10):e48073. 576
14. Faulkner J, Arnold T, Eston R. Effect of accurate and inaccurate distance feedback on performance 577
markers and pacing strategies during running. Scand J Med Sci Sports 2011;21(6):e176-83. 578
15. Faulkner J, Parfitt G, Eston R. The rating of perceived exertion during competitive running scales 579
with time. Psychophysiology 2008;45(6):977–85. 580
16. Fiedler S, Glöckner A. The dynamics of decision making in risky choice: An eye-tracking analysis. 581
Front Psychol 2012;3(10):1-18. 582
17. Foulsham T, Walker E, Kingstone A. The where, what and when of gaze allocation in the lab and 583
the natural environment. Vision Res 2011;51(17):1920-31. 584
18. Foster C, De Koning JJ, Hettinga F, et al. Pattern of energy expenditure during simulated 585
competition. Med Sci Sports Exerc 2003;35(5):826–31. 586
19. Foster C, Hendrickson KJ, Peyer K, et al. Pattern of developing the performance template. Br J 587
Sports Med 2009;43(10):765–9. 588
20. Foster C, Schrager M, Snyder AC, Thompson NN. Pacing strategy and athletic performance. Sport 589
Med 1994;17(2):77–85. 590
21. Foster C, Snyder AC, Thompson NN, Green MA, Foley M, Schrager M. Effect of pacing strategy 591
22. Foulsham T, Walker E, Kingstone A. The where, what and when of gaze allocation in the lab and 593
the natural environment. Vision Res 2011;51(17):1920-31. 594
23. Garcin M, Coquart J, Salleron J, Voy N, Matran R. Self-regulation of exercise intensity by 595
estimated time limit scale. Eur J Appl Physiol 2012;112(6):2303–12. 596
24. Gegenfurtner A, Lehtinen E, Säljö R. Expertise differences in the comprehension of visualizations: 597
A meta-analysis of eye-tracking research in professional domains. Educ Psychol Rev 598
2011;23(4):523-52. 599
25. Hutchinson JM, Gigerenzer G. Simple heuristics and rules of thumb: Where psychologists and 600
behavioural biologists might meet. Behav Processes 2005;69(2):97-124. 601
26. Glaholt MG, Reingold EM. The time course of gaze bias in visual decision tasks. Vis cogn 602
2009;17:1228–43. 603
27. Haider H, Frensch PA. Eye movement during skill acquisition: More evidence for the information-604
reduction hypothesis. J Exp Psychol Learn 1999;25(1):172-90. 605
28. Hettinga F, De Koning JJ, Broersen F, Van Geffen P, Foster C. Pacing Strategy and the Occurrence 606
of Fatigue in 4000-m Cycling Time Trials. Med Sci Sport Exerc 2006;38(8):1484–91. 607
29. Hettinga FJ, De Koning JJ, Meijer E, Teunissen L, Foster C. Biodynamics. Effect of pacing 608
strategy on energy expenditure during a 1500-m cycling time trial. Med Sci Sports Exerc 609
2007;39(12):2212–8. 610
30. Jones HS, Williams EL, Bridge C, et al. Physiological and Psychological Effects of Deception on 611
Pacing Strategy and Performance: A Review. Sport Med 2013;43(12):1243–57. 612
31. Joseph T, Johnson B, Battista R, et al. Perception of fatigue during simulated competition. Med Sci 613
32. Le Runigo C, Benguigui N, Bardy BG. Perception–action coupling and expertise in interceptive 615
actions. Hum Movement Sci 2005;24(3):429-45. 616
33. Mann DT, Williams AM, Ward P, Janelle CM. Perceptual-cognitive expertise in sport: A meta-617
analysis. J Sport Exerc Psychol 2007;29(4):457-78. 618
34. Marcora SM. Do we really need a central governor to explain brain regulation of exercise 619
performance? Eur J Appl Physiol 2008;104(5):929–31. 620
35. Mauger AR, Jones AM, Williams CA. Influence of feedback and prior experience on pacing during 621
a 4-km cycle time trial. Med Sci Sports Exerc 2009;41(2):451–8. 622
36. Mauger AR, Jones AM, Williams CA. The effect of non-contingent and accurate performance 623
feedback on pacing and time trial performance in 4-km track cycling. Br J Sports Med 624
2009;45(3):225–9. 625
37. Micklewright D, Kegerreis S, Raglin J, Hettinga F. Will the conscious-subconscious pacing 626
quagmire help elucidate the mechanisms of self-paced exercise? New opportunities in dual process 627
theory and process tracing methods. Sports MedIn press (Accepted October 2016). 628
38. Micklewright D, Papadopoulou E, Swart J, Noakes T. Previous experience influences pacing 629
during 20 km time trial cycling. Br J Sports Med 2010;44(13):952–60. 630
39. Newell KM. Coordination, control and skill. In: Goodman D, Wilberg RB, Franks IM, editors. 631
Differing Perspectives in Motor Learning, Memory, and Control. Amsterdam: Elsevier Science 632
Publishing; 1985. p. 295-317. 633
40. Noakes TD, St Clair Gibson A, Lambert E V. From catastrophe to complexity: a novel model of 634
integrative central neural regulation of effort and fatigue during exercise in humans: summary and 635
41. Passfield L, Dietz K, Hopker J, Jobson S. Objective time-binning in exposure variation analysis 637
IMA J Manag 2013;24(3):269–82. 638
42. Renfree A, Martin L, Micklewright D, St Clair Gibson A. Application of decision-making theory 639
to the regulation of muscular work rate during self-paced competitive endurance activity. Sport 640
Med 2014;44(2):147–58. 641
43. Shi S, Wedel M, Pieters F. Information acquisition during online decision making: A model-based 642
exploration using eye-tracking data. Manage Sci 2013;59(5):1009–26. 643
44. Shimojo S, Simion C, Shimojo E, Scheier C. Gaze bias both reflects and influences preference. Nat 644
Neurosci 2003;6(12):1317–22. 645
45. Smits BLM, Pepping GJ, Hettinga FJ. Pacing and decision making in sport and exercise: The roles 646
of perception and action in the regulation of exercise intensity. Sport Med 2014;44(6):763–75. 647
46. St Clair Gibson A, Lambert E V, Rauch LHG, et al. The role of information processing between 648
the brain and peripheral physiological systems in pacing and perception of effort. Sport Med 649
2006;36(8):705–22. 650
47. Thiele A, Henning P, Kubischik M, Hoffman KP. Neural mechanisms of saccadic suppression. 651
Science 2002;295(5564):2460-2. 652
48. Tucker R. The anticipatory regulation of performance: the physiological basis for pacing strategies 653
and the development of a perception-based model for exercise performance. Br J Sports Med 654
2009;43(6):392–400. 655
49. Ulmer HV. Perceived exertion as a part of a feedback system and its interaction with tactical 656
behaviour in endurance sports. In: Borg G, Ottoson G, editors. The perception of exertion in 657
50. Ulmer H, Schneider A, Neumahr S, Freitag W. Precision of time and velocity estimation as a base 659
of teleoanticipation. Eur J Physiol 1996;431(48):1–5. 660
51. Vansteenkiste P, Cardon G, D’Hondt E, Philippaerts R, Lenoir M. The visual control of bicycle 661
steering: The effects of speed and path width. Accident Anal Prev. 2013;51:222-7. 662
52. Vansteenkiste P, Cardon G, Philippaerts R, Lenoir M. Measuring dwell time percentage from head-663
mounted eye-tracking data–comparison of a frame-by-frame and a fixation-by-fixation analysis. 664
Ergonomics 2015;58(5):712-21. 665
53. Vansteenkiste P, Zeuwts L, Cardon G, Philippaerts R, Lenoir M. The implications of low quality 666
bicycle paths on gaze behavior of cyclists: A field test. Transport Res F Tr Psychol. 2014;23:81-7. 667
54. Vickers JN, Williams AM, Rodrigues ST, Hillis F, Coyne G. Eye movements of elite biathlon 668
shooters during rested and fatigued states. J Sport Exerc Psychol 1999;21:S116. 669
55. Williams AM, Ericsson KA. Perceptual-cognitive expertise in sport: Some considerations when 670
applying the expert performance approach. Human Mov Sci 2005;24(3):283-307. 671
56. Williams AM, Janelle CM, Davids K. Constraints on the search for visual information in sport. Int 672
J Sport Exerc Psychol 2004;2(3):301-18. 673
57. Williams EL, Jones HS, Andy Sparks S, Marchant DC, Midgley AW, Mc Naughton LR. 674
Competitor presence reduces internal attentional focus and improves 16.1km cycling time trial 675
Figure Legends
Figure 1. Overall time-trial performance (A) and time-trial pacing by segment for familiarization (B)
and time-trial 1 (C).
Figure 2. Novice and Experienced total gaze duration data (A) and average gaze frequency (B) for
primary (most looked at) through to nonary (least looked at) information sources calculated over the full 16.1 km distance for time-trial 1 (A) The type of information looked at with the corresponding number
of subjects is presented alongside the data points in 2A for primary to tertiary sources but not included for quaternary to nonary sources. * denotes P<0.05; ** denotes P<0.01; *** denotes P<0.001.
Figure 3. Experienced versus novice segment-by-segment time-trial 1 total gaze duration data for primary (A), secondary (B) and tertiary information sources (C). * Denotes P<0.05; ** denotes P<0.01;
*** denotes P<0.001; NS denotes not significant.
Figure 4. Experienced versus novice segment-by-segment time-trial 1 average gaze frequency for
Table 2. Individual gaze combinations of primary and secondary information sources.
ID
Primary-Secondary Combination for the Whole
Time-Trial *Group Code Primary-Secondary Combination Change by Segment (4-8-12-16 km) **Primary Dominance by Segment (%) Different Primary Sources Used per Segment (N) Primary Source Switches Between Segments (N) Novices
S13 DS
1
SD-DS-DS-PD 52-59-55-62 3 2
S3 DS DT-DP-DS-DS 50-56-57-54 1 0
S8 DS OV-DS-TS-DT 58-53-51-65 3 3
S10 DO
2 CD-HD-OD-DO 50-51-51-51 4 3
S11 DO DO-DP-DO-DO 51-65-64-61 1 0
S12 DP 3 DP-DP-PD-DT 58-53-56-78 2 2
S7 PD 4 DV-PT-PS-DS 55-60-60-60 2 2
S9 SD 5 SD-SD-SO-SD 56-52-55-52 1 0
S6 VD 6 DP-VO-VO-DO 55-57-66-56 2 2
S1 TP 7 OT-PV-TP-DV 51-56-51-62 4 3
Mean 54-56-57-60 2.3 1.7
S.D. 3-4-5-8 1.2 1.3
Mode DS ##-##-##-DO 1 2
Experts
S24 SD
5
SD-SD-SD-SD 61-62-64-64 1 0
S25 SD SP-SD-OD-SH 50-50-52-52 2 2
S26 SD DS-DS-SD-SD 54-52-62-71 2 1
S30 SD SO-SO-SD-SO 66-62-58-61 1 0
S32 SD SD-SO-SO-SD 64-64-70-66 1 0
S22 SO
8 SD-ST-OS-SO 78-79-59-53 2 2
S27 SO SD-SO-SO-SD 69-57-70-59 1 0
S21 SP
9 SP-SO-SP-DS 65-65-72-51 2 1
S28 SP SP-SP-SO-SP 68-61-68-69 1 0
S23 PS 10 PS-PS-PD-SH 63-65-59-52 2 1
Mean 64-62-63-60 1.5 0.7
S.D. 8-8-7-8 0.5 0.8
Mode SD ##-SO-SO-SD 1 0