ANALYSIS OF WORKING CAPITAL AND PROFITABILITY: AN
EVIDENT STUDY OF SELECTED FMCG COMPANIES IN INDIA
Punit kumar kanujiya
Research Scholar, Department of Commerce, University of Lucknow.
ABSTRACT
In this research paper shows the relationship between working capital management
determinants on profitability. Working capital management (WCM) is one of the
pre-conditions for the financial management of any organization or companies. This research
paper the author’s aims maintaining an adequate amount of readily available cash
resources in the business for carrying out the daily operations of the company. Profitability
is the depended variables whereas determinants of working capital are independent
variables such as average collection period, inventory turnover in days, average payment
period were used to assess working capital management, and return on total assets. In this
study has considered sample of the size of five FMCG companies in India over a five year
period from 2013 to 2017. The analysis done by using OLS Regression show whether there
is a significant relationship between these variables.
Keywords: Profitability, Return on assets, Working Capital, debtor’s turnover ratio, FMCG companies
International Research Journal of Management and Commerce ISSN: (2348-9766) Impact Factor- 5.564, Volume 5, Issue 3, March 2018 Website- www.aarf.asia, Email : [email protected] , [email protected]
INTRODUCTION
Working capital management is the most importance work or function of finance, takes care
of the financing activities, liquidity position and profitability position of the Firm or any
company. In the present scenario of the competitive market short-term assets and liabilities
are most important components of total assets and essential to be analysed very carefully at
the side of long-term assets and liabilities. Management of this short-term assets and
liabilities are subject to Research cautiously from the time because working capital
management plays the most importance role for the company’s profitability and risk as well
as its value. Working capital is known as a short term assets which company uses it in per
day activities. It means the working capital is known as an Emblem or indicator for
determining the liquidity which is well-defined as adequacy of cash for doing company’s
obligations”. Generally, on basis of daily uses all short term assets are included in working
capital. In the area of financial management, working capital management is a very delicate
field. Working capital management is also very most important for the firm’s or company
success; so companies are trying to maintain optimal levels of working capital. Any
Company is assuming methods for handling proper level in various components of working
capital i.e., cash receivables, inventory and payables etc. similar to the other business
sectors, efficient management of working capital is equally important for the Fast Moving
Goods Consumer goods (FMCG) as well. Profitability of the firm’s or any company can be
defined as the last or final measure of the economic success achieved by a company in
relation to the capital invested in it. This economic success is determined by the magnitude
of the net profit accounting. To achieve an appropriate return over the amount of risk
accepted by the shareholders, is the main objective of companies operating in capitalist
economies. After all, profit is the propulsive element of any investments in different
projects. The assessment of profitability is usually done through the ROI (Return on
Investment = (Net Profit/Sales) X (Sales/Capital Employed) which is the ultimate measure
of economic success. Current position of FMCG companies is the fourth largest industry in
the economy with the revenue generation of USD 47.3 billion during 2015. The industry
deals with packaged consumer goods having a shift turnover and comparatively low cost.
The goods generally, include soaps, beauty products, oral care products, foot wears, dairy
plastic products. The rudimentary characteristic of these goods is that they are substituted
within a year. The innovative electronic items such as mobile phones, digital camera,
Laptops and MP3 players are also included in FMCGs as these are replaced more often than
other electronic items. The industry has brought a change in the life of every Indian and has
the widest reach among all sectors in India. A major part of the monthly budget of each
household is secured for FMCG products.
RELATED REVIEW OF LITERATURE:
Following reviews of literature covers research studies conducted on impact of profitability
on working capital.
Mittal et al (2010), studied the examined the trends in working capital management taking the case of the cement industry in India as their sample. He studied a sample
of two companies namely Gujarat Ambuja Cements Ltd (GAC Ltd) and Associated
Cement Companies Limited (ACC Ltd), considered the market leaders and principal
competitors. The period of study was for four years, 2006-2009. The data used was
the secondary data that was collected from the company balance sheets. The
objectives of the study were to understand the size of the working capital in the
cement industry in India and find trends in the working capital management in the
industry. The different variables studied were sales, total assets, and net profit.
Anandasayanam (2011) studied 80 Sri Lankan Listed companies for the years 2003 to 2009 and refuted the earlier results. The results of this study were based on panel data
analysis and also took into consideration variables like growth, size of company and
debt-equity ratio as control variables. The results showed that working capital management
had a significantly negative impact on the profitability of the companies. Moreover, the
study disclosed that the influence of other variables like growth, size and financial
structure should not be ignored. The author suggested the companies to keep their
conversion period minimum in order to maximize profits.
Bhunia, Khan (2011) analysed the association of liquidity management, in other words, working capital management and profitability of steel companies in the private sector in
India. The main objectives of the authors were to study the overall efficiency of
sample of 230 steel companies in the private sector in the Indian industry and studied
them over a period of eight years i.e. 2002-2010. The dependent variable is defined as the
profitability of the sample firms. The independent variables used were the following
Current Ratio (CR), Liquid Ratio (LR), Absolute Liquid Ratio (ALR), Debt-Equity Ratio
(DER), Interest Coverage Ratio (ICR), Inventory Turnover Ratio (ITR), Debtors
Turnover Ratio (DTR), and Creditors Turnover Ratio (CTR). After doing multiple
regression analysis, Correlation analysis and Descriptive statistics, the authors concluded
that liquidity and solvency position in terms of debt is very satisfactory and relatively
efficient liquidity management is found but liquidity position has no impact on
profitability.
Bhagchi, Kamrui (2012) studied the effect of working capital management on profitability on the FMCG sector in India. The study was conducted on a sample of ten
FMCG firms over a period of ten years 2000-01 to 2009-10. The main objective of the
authors was to understand the impact of working capital management on profitability and
to see the impact of various components of working capital management on profitability.
After conducting normality tests, Pearson’s Correlation and panel data regression, the
authors concluded that there was a significant negative relation between working capital
management and firm profitability.
Panigrahi (2012) based on the case study on the cement company in India, i.e. ACC Ltd. during 1900-00 to 2009-10 found that there existed a moderate relationship between
working capital management and profitability as few working capital variables had a
positive impact on profitability while the others had negative. It was concluded that even
though there was some influence of working capital management on the profitability, it
was highly insignificant.
Bamal et al (2013) made a comparative analysis of chemical and pharmaceutical industries in India from 2002 to 2011 to understand the relationship between working
capital management and profitability. The findings depicted that the working capital
management variables had a strong positive association with the profitability variables of
the chemical industry than that of the pharmaceutical industry. The working capital
variables had positive but insignificant influence on the profitability position of the
Lastly, the research works by Mawutor (2014) and Kodithuwakku (2015) on manufacturing companies of Ghana (2006-2010) and manufacturing companies listed on
Columbia Stock exchange (2008-2012) respectively presented a similar view. The results
showed that the working capital management had significantly negative influence on the
profitability. Further, it was also shown in the analysis that the variables like growth, the
size of the company and debt-equity ratio also had a strong influence on the profitability
apart from the working capital management.
STATEMENT OF PROBLEM:
In this research paper the author shows analysis of working capital and profitability of
selected large and small FMCG Company. In this study profitability is a dependent variable
whereas determinants of working capital are independent variables such as inventory
turnover ratio, debtors turnover ratio, current ratio, and profitability measure return on
assets.
Significant and need of study: The present study helps especially for the creditors, investors and other stake holders to known that the short term liquidity position of the
company and profitability relationship in select FMCG companies in India.
OBJECTIVE OF THE STUDY:
In this research paper the author’s study aims at analysing the working capital management
of FMCG (fast moving consumer goods) companies in India. The main objectives are:
1. To study the working capital and profitability position of the select large and small
companies of the FMCG industry.
2. To study examine the impact of working capital management on profitability of the
select large and small companies of the FMCG industry.
RESEARCH METHODOLOGY: Sample size:
In this study sample size is three large size company (on the basis income) companies under
of working capital on profitability of FMCG sector in India. Hindustan Unilever Limited (HUL),
India Tobacco Company (ITC), Britannia Ltd. Procter & Gamble Company (P&G), NIRMA,
Parle agro Pvt Ltd.
SAMPLING METHOD:
In this study five leading companies were selected on the basis of sales turnover.
Data selection:
The present study analyses the financial data of select 3 large FMCG companies. Hindustan
Unilever Limited (HUL), ITC Ltd., Britannia, and 3 small FMCG companies Nirma, P&G,
Emami, The financial data of the companies are collected for a period of 5 years from
FY2012-13 to FY2016-17 from PROWESS software of the CMIE Database which has been
suitably rearranged, classified and tabulated according to the requirements of the study. In
addition, the Economic Survey of India of different years, research publications, various
books, journals, newspapers, related websites, Publications of Bombay stock exchange
(BSE) and National Stock exchange (NSE) of India have been viewed for collecting the
required data.
Variable select for the study are given bellow:
Categories variable formula
Dependent variable Return on Assets Profit after tax/ total assets
Independent variable Current Ratio (CR) Current Assets/ Current Liabilities
Inventory turnover ratio(ITR) Sales / average Inventory
Debtors turnover ratio(DTR) Net credit sales / average debtors
Period of the study:
Tolls used for analysis:
The data has been analysed essentially using ratio analysis. Linear Regression is used to identify
relationship between the variables and state hypothesis, statistically significant at a confidence
level of 95%.
Hypothesis of study:
In this research paper the researcher starts the study with the following broader hypotheses.
1. Null hypothesis (2) Alternative hypothesis
2. (1)Null Hypothesis: There is no significant relationship between Working capital and
profitability Large and small size of the firm.
3. Alternative Hypothesis: There is significant relationship between Working capital and profitability Large and small size of the firm.
Analysis:
This paper test the linearity and normality of time series data used in study regression models
present below was used to test on the relationship between the variables of study.
Y = β0 + β1X1 + ε
Y = Return on Assets (Dependent)
β0 = Intercept (constant) β1= effect of Independent variable
X1= Average Current Ratio (Independent) β2= effect of Independent variable
X2= Average Debtors Ratio (Independent) β3= effect of Independent variable
X3= Average Inventory Ratio (Independent) ε = Error term
The confidence level for the present study has been taken as 95%.
R shows the correlation between independent and dependent variable. R square show the
variation and we can predict the variation in profit. Adjusted R square to closely reflect the
goodness of fit of the model. The higher R square is better for the model. T test used to test the
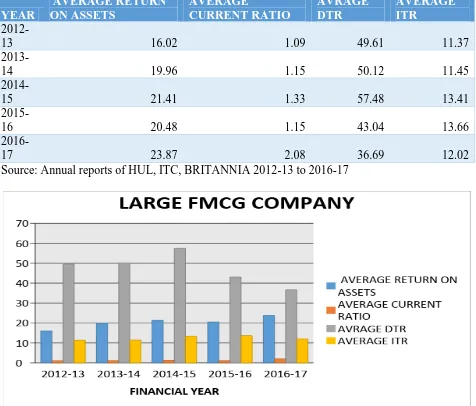
Large company of FMCG industry- (HUL, ITC, BRITANNIA)
YEAR
AVERAGE RETURN ON ASSETS
AVERAGE
CURRENT RATIO
AVRAGE DTR
AVERAGE ITR
2012-13 16.02 1.09 49.61 11.37
2013-14 19.96 1.15 50.12 11.45
2014-15 21.41 1.33 57.48 13.41
2015-16 20.48 1.15 43.04 13.66
2016-17 23.87 2.08 36.69 12.02
[image:8.612.71.547.85.491.2]Source: Annual reports of HUL, ITC, BRITANNIA 2012-13 to 2016-17
Fig 1: Source: Annual reports of HUL, ITC, BRITANNIA 2012-13 to 2016-17
Hypothesis testing
Table 1-Model Summary
Model R R Square Adjusted R Square Std. Error of the Estimate 1 .901a .812 .246 2.47197
In this table R shows the high correlation between Independent and Dependent variable but
this relation is negative (-0.901). R square show the AITR, ACR, ADTR, predicts 81.2%
variation in Return on Assets of large FMCG companies.
Table 2-ANOVAa
Model Sum of Squares df Mean Square F Sig.
1
Regression 26.321 3 8.774 1.436 .535b Residual 6.111 1 6.111
Total 32.432 4
a. Dependent Variable: AVERAGE RETURN ON ASSETS
b. Predictors: (Constant), AVERAGE ITR, AVERAGE CURRENT RATIO, AVRAGE DTR
The regression result shows the significant level (p value) of F statistics. Show that Influence of
R on Return on Assets in Large size of the FMCG industry. The result of ANOVA is 1.436 at 1/3
degree of freedom and 5% Level of significant revelling that Return on Assets Influence current
ratio, inventory turnover ratio, debtors turnover ratio, in select large FMCG sector. The table
indicates the regression models predict dependent variable significantly because P value 0.535 is
more than 0.05. So our Null Hypothesis is accepted and alternate Hypothesis is rejected.
Table 3-Coefficientsa
Model Unstandardized Coefficients Standardized Coefficients t Sig. B Std. Error Beta
1
(Constant) -2.596 18.889 -.137 .913 AVERAGE CURRENT
RATIO 5.953 3.889 .862 1.531 .368
AVRAGE DTR .027 .205 .075 .133 .916 AVERAGE ITR 1.095 1.146 .418 .955 .515
a. Dependent Variable: AVERAGE RETURN ON ASSETS
The coefficient table provides the necessary information to predict Return on Assets from current
ratio, inventory turnover ratio, debtors turnover ratio,, as well as determine whether current ratio,
inventory turnover ratio, debtors turnover ratio, contribute statistically significantly to the model.
Average Return on Assets = -2.596 – 5.953, .027, 1.095, (Average current ratio, Average
The beta coefficients in the regression show that Net Average current ratio, Average inventory
turnover ratio, Average debtors turnover ratio has positive relationship with Return on Assets in
these FMCG Companies provided by coefficient value of -0.862, .075, .418. The findings show
Return on Assets is statistically significant with p-value less than 0.05.
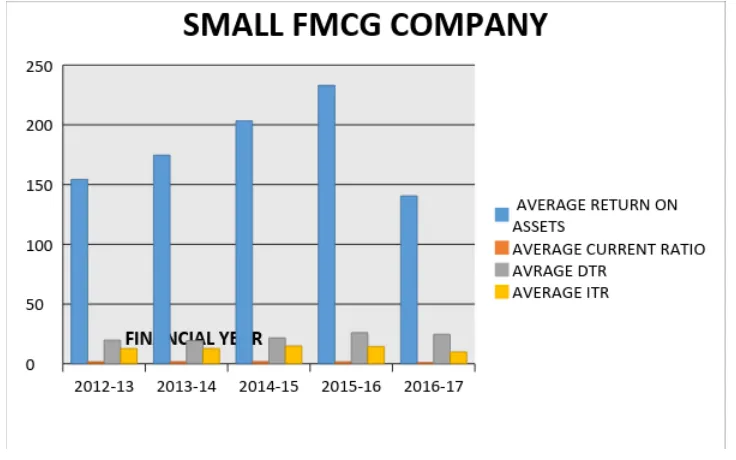
Small company of FMCG industry- (P&G, EMAMI, PARLE AGRO)
YEAR AVERAGE RETURN
ON ASSETS
AVERAGE
CURRENT RATIO
AVRAGE DTR
AVERAGE ITR
2012-13
154.3 1.65 19.85 12.77
2013-14
174.58 1.77 19.45 12.8
2014-15
203.31 1.82 21.71 14.92
2015-16
233.06 1.64 26.08 14.57
2016-17
140.51 0.92 24.69 9.86
[image:10.612.124.492.369.599.2]Source: Annual reports of P&G, EMAMI, PARLE AGRO 2012-13 to 2016-17
Hypothesis testing
Table – 4 Model Summary
Model R R Square Adjusted R Square Std. Error of the Estimate
1 .994a .987 .949 8.44654
a. Predictors: (Constant), AVERAGE ITR, AVRAGE DTR, AVERAGE CURRENT RATIO
In this table R shows the high correlation between Independent and Dependent variable but
this relation is negative (-0.994). R square show the AITR, ACR, ADTR, predicts 98.7%
[image:11.612.80.535.265.370.2]variation in Return on Assets of large FMCG companies.
Table -5 ANOVAa
Model Sum of Squares df Mean Square F Sig.
1
Regression 5530.067 3 1843.356 25.838 .143b Residual 71.344 1 71.344
Total 5601.411 4
a. Dependent Variable: AVERAGE RETURN ON ASSETS
b. Predictors: (Constant), AVERAGE ITR, AVRAGE DTR, AVERAGE CURRENT RATIO
The regression result shows the significant level (p value) of F statistics. Show that Influence of
R on Return on Assets in Large size of the FMCG industry. The result of ANOVA is 25.838 at
1/3 degree of freedom and 5% Level of significant revelling that Return on Assets Influence
current ratio, inventory turnover ratio, debtors turnover ratio, in select large FMCG sector. The
table indicates the regression models predict dependent variable significantly because P value
[image:11.612.73.546.535.671.2]0.143 is more than 0.05. So our Null Hypothesis is accepted and alternate Hypothesis is rejected.
Table- 6 Coefficientsa
Model Unstandardized
Coefficients
Standardized Coefficients
t Sig.
B Std. Error Beta
1
(Constant) -270.670 73.164 -3.699 .168 AVERAGE CURRENT RATIO 130.498 70.699 1.276 1.846 .316
The coefficient table provides the necessary information to predict Return on Assets from current
ratio, inventory turnover ratio, debtors turnover ratio,, as well as determine whether current ratio,
inventory turnover ratio, debtors turnover ratio, contribute statistically significantly to the model.
Average Return on Assets = -270.670 – 130.498, 13.121, -3.473, (Average current ratio, Average
inventory turnover ratio, Average debtors turnover ratio) + ε
The beta coefficients in the regression show that Net Average current ratio, Average inventory
turnover ratio, Average debtors turnover ratio has positive relationship with Return on Assets in
these FMCG Companies provided by coefficient value of -1.276, 1.029, -.186. The findings
show Return on Assets is statistically significant with p-value less than 0.05.
Null Hypothesis There is no significant relationship between Working capital and profitability of Large and small size of the FMCG companies.
rejected
Alternative Hypothesis
There is significant relationship between Working capital and profitability of Large and small size of the FMCG companies.
accepted
CONCLUSION:
The FMCG Industry is one of the prominent Industries of the Indian Manufacturing sector.
The study aims to analysis of working capital management and profitability of the selected
large and small FMCG Company for the period of 2012-13 to 2016-17. The result of the
study both Income size company profitability highly correlated with their working capital so
working capital impact on its profitability but this impact is higher in large income size
company and other hand minimum impact of working capital on small income size company
because large size company is required high working capital for daily needs than small
income size company. In small income size companies receivable management is good than
large income group. All other factor in large income size companies affective like debt and
equity government security investment opportunities and fund availability excess of market
REFERENCE:
1. Anandasayanam, S. (2011), Working Capital Management and Corporate Profitability:
Evidence from Panel Data Analysis of Selected Quoted Companies in Sri Lanka,
International Conference University of Sairam (2011), pp. 1-10.
2. Bamal, S. et al (2013), Relationship between Working Capital Management and
Profitability: A Comparison of Chemical and Pharmaceutical Industries, Journal of
Accounting and Finance, Vol. 27(1) (October-March 2013), pp. 59-69.
3. Bagchi, B., & Khamrui, K. (2012). Relationship between working capital
management and profitability: a study of selected FMCG companies in India.
Business and Economics Journal, 2012, 1-11.
4. Bhunia, A., & Khan, I. U. (2011). Liquidity management efficiency of Indian Steel
Companies (a Case Study). Far East Journal of Psychology and Business, 3(1),
3-13.
5. C.Srinivas Yadav and Sai Shiva Kumar S.B (2014) “Impact of profitability on the
determinants of working capital: An evident study of large steel manufacturing
companies in India’’Sri sathya sai Institute of higher Learning, Brindavan campus,
Kadugodi, Bangalore, 560067.
6. Kodithuwakku, S. (2015),Impact of Working Capital Management on Profitability of
Manufacturing Companies of Colombo Stock Exchange (CSE) in Sri Lanka,
Proceedings of 12th International conference on Business Management (7-8 December,
2015), pp. 1-13.
7. Malhotra, S. (2013), Working Capital Trends and Liquidity Analysis of FMCG Sector in
India, IOSR Journal of Business and Management, Vol. 9, and No. 4 (Mar-April 2013).
8. Mittal, S., Joshi, N., & Shrimali, K. Empirics on Working Capital Management; A
Case of Indian Cement Industry.
9. Panigrahi, A.K. (2012), Impact of Working Capital Management on Profitability –
A Case Study of ACC Ltd., Asian J. Management, Vol. 3(4), pp. 210–218.
10. Reeti Gaur and Dr. Rajinder Kaur (2017) “Impact of working capital management on firm profitability in India’’ Punjabi University, Patiala, Punjab,
11. Saini, A. and Saini, R. D. (2010), Analysis of Liquidity Management and Trade-Off
between Liquidity, Risk and Profitability: An Empirically Study, the Journal of
Accounting and Finance, Vol. 24, No. 2 (April-Sept. 2010), pp. 29-42.