A Monthly Double-Blind Peer Reviewed Refereed Open Access International e-Journal - Included in the International Serial Directories. GE- International Journal of Management Research (GE-IJMR)
Website: www.aarf.asia. Email: editoraarf@gmail.com , editor@aarf.asia
Page 35
AGRICULTURAL LENDING OF COMMERCIAL AND
COOPERATIVE BANKS: A COMPARATIVE STUDY IN THE STATE
OF JAMMU AND KASHMIR
Haris Manzoor
,
MBA Agri-business,Institute of Agri-business Management,
S. K. Rajasthan Agricultural University, Bikaner, India.
ABSTRACT
The agricultural lending of commercial and cooperative banks has been compared in terms
of the distribution and quantum of credit across different categories of farmers. The
agricultural lending of commercial and cooperative farmers was compared in terms of their
lending for different crop loans and investment loans. Per hectare and per borrower loan
was calculated to study the coverage and quantum of credit across different categories of
farmers. Effective cost of credit was calculated for both commercial and cooperative banks to
determine the more affordable source of credit for the farmers. Several constraints faced by
famers in acquiring agricultural credit were identified and studied using factor analysis.
Introduction
Agriculture is a dominant sector of Indian economy and credit plays an important role in increasing agricultural production. Availability and access to adequate, timely and low cost credit from institutional sources is of great importance especially to small and marginal farmers. Credit, as one of the critical non-land inputs, has two-dimensions from the viewpoint
of its contribution to the augmentation of agricultural growth viz., availability of credit (the quantum) and the distribution of credit.
A Monthly Double-Blind Peer Reviewed Refereed Open Access International e-Journal - Included in the International Serial Directories. GE- International Journal of Management Research (GE-IJMR)
Website: www.aarf.asia. Email: editoraarf@gmail.com , editor@aarf.asia
Page 36
an all out effort was required on the part of banks to reorient their policies in order to surmount the obstacles in the way of achievement of 18 per cent share to agricultural sector. Commercial banks are the major delivery channel, taking almost 75 percent share in the ground level credit. The co-operative banks’ share is around 15 percent, while that of RRBs is around 10 percent. The continuous loss in the share of co-operative banks over the years is pertinent as conventionally, small and marginal farmers are their major clients. In their interest, it is essential that the co-operative banks stabilize. (Kataria and Chahal, 2005)
Cooperative banks played essential role in the realization of the agricultural and in local development. They serve both rural and urban population, and are main banks in India supporting development of agriculture and rural areas. Their key role is to give credits financing various rural based entrepreneurships (Soni and Saluja, 2012).
The co-operative sector suffers from non-viability of primary units, overdues, lack of
professionalism and high administrative and operational costs. Co-operative structure in
many states is at the verge of collapse. High incidence of overdues has made many of these
co-operatives week and ineffective recycling of funds suffered considerably (Priya, 2006).
Under this background, many previous studies have attempted to analyse the distribution of credit. Studies have also been carried out on the technical efficiencies of both co-operative
and commercial banks. The credit policy of the commercial and co-operative banks has some variations. Effective cost of credit from commercial and cooperative banks was also compared. Constraints faced by farmers in acquiring credit from both these sources were assessed and recommendations were given for efficient credit delivery for famers.
Methodology
For the study undertaken in 2014-15, the primary data for the financial year 2013-14 were collected from 100 borrower farmers out of which 50 borrowers were selected from commercial banks and 50 borrowers from cooperative banks. The survey method was used to collect data from the borrower farmers. Schedules were used to collect information from the borrower farmers. Secondary data were collected from web portals, magazines, journals and government websites.
A Monthly Double-Blind Peer Reviewed Refereed Open Access International e-Journal - Included in the International Serial Directories. GE- International Journal of Management Research (GE-IJMR)
Website: www.aarf.asia. Email: editoraarf@gmail.com , editor@aarf.asia
Page 37
cultivated in the district. It is therefore one of the highly credit-intensive districts and has access to both commercial and co-operative banks. A multi-stage random sampling procedure was followed for selecting the sample of borrower farmers. In the first stage, one block out of the total 12 blocks of Baramulla district was selected randomly. In the second stage, all the commercial and co-operative banks located in the block were selected and borrower lists were taken from these banks. In the third stage five most credit intensive villages were selected separately for commercial and cooperative banks based on the frequency of borrowers. 10 borrower farmers from each village were selected randomly from the borrowers list.
The specific objectives of the study were:
To study the distribution and quantum of credit from commercial and cooperative
banks across different categories of farmers
To calculate and compare the effective cost of credit from commercial and
cooperative banks
To study the constraints faced by farmers in availing agricultural credit from
commercial and co-operative banks
Analytical Framework
Distribution and Quantum of Credit
The coverage and quantum of credit from commercial and cooperative banks across different categories of farmers was assessed for the last one year. Data collected from commercial, cooperative banks and farmers was interpreted through tabular analysis and percentages to study the credit distribution.
Effective Cost of Credit
The effective cost of credit is interest payment plus transaction cost plus opportunity cost. The transaction cost may vary from borrower to borrower depending on the distance of the relevant branch office of bank from their respective homes; cost of transportation and costs incurred in terms of passbook, other stationary, revenue stamp, loss of wages, food, service charges to intermediaries etc.
ECC= FC+TC+OP Where;
A Monthly Double-Blind Peer Reviewed Refereed Open Access International e-Journal - Included in the International Serial Directories. GE- International Journal of Management Research (GE-IJMR)
Website: www.aarf.asia. Email: editoraarf@gmail.com , editor@aarf.asia
Page 38
OC= Opportunity cost Factor Analysis
Major constraints faced by farmers in availing agricultural credit from commercial and cooperative banks include accessibility, adequacy, timely availability, transaction cost, complicated procedure, size of land holding and repayment period, low service speed, lack of infrastructure, bribe, collateral, no previous experience, low reputation among community members. These constraints were analyzed by applying factor analysis. Factor analysis helped to identify the relative importance of the problems faced by farmers. More important factors were extracted and the banks should improve on these factors for customer satisfaction. In factor analysis, Bartlett test of sphericity and Kaiser-Meyer-Olkin (KMO) test were applied to determine the appropriateness of factor analysis. Eigen values were calculated to determine the total variance explained by each factor.
Results and Discussion Distribution of Credit
The distribution of agricultural credit was analysed as follows:
Table 1: Distribution of sample borrower farmers
To study the credit distribution, the sample farmers were categorized into different groups based on the land holding size, i.e. marginal (<1 ha), small (1-2 ha), semi-medium (2-4 ha), medium (4-10 ha) and large farmers (>10 ha). The categorical distribution of farmers gives a clear picture of the selected sample. The distribution of farmers is given in Table 1 as under: S.
No
Farmers’ category
Commercial banks Cooperative banks Total
No. Percentage No. Percentage No. Percentage
1 Marginal 10 20 14 28 24 24
2 Small 11 22 16 32 27 27
3 Semi-Medium
24 48 17 34 41 41
4 Medium 4 8 3 6 7 7
5 Large 1 2 0 0 1 1
A Monthly Double-Blind Peer Reviewed Refereed Open Access International e-Journal - Included in the International Serial Directories. GE- International Journal of Management Research (GE-IJMR)
Website: www.aarf.asia. Email: editoraarf@gmail.com , editor@aarf.asia
Page 39
Out of the total sample of 100 borrower farmers, 41 percent fall under the semi-medium category and 27 percent in small category. Medium and large category involves only 7 percent and 1 percent respectively.
Farmers’ category-wise distribution of agricultural credit
The distribution of agricultural credit to farmers in the selected block by the commercial and
co-operative banks has been depicted in terms of crop loan in Table 2 and in terms of
investment loan in Table 3. 76 farmer respondents were the borrowers of crop loan, whereas
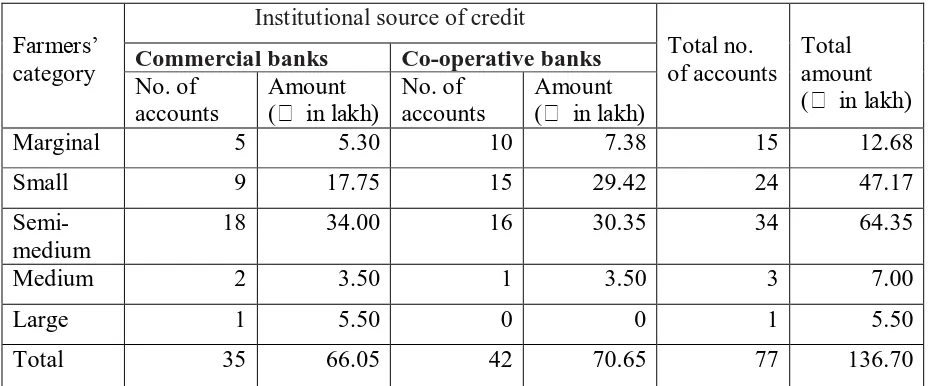
33 farmers borrowed investment loan. The total crop loan availed by the borrowers amounted
to ₹ 66.05 lakh from commercial banks and ₹ 70.65 lakh from co-operative banks. In crop
loan, the number of accounts was highest for semi-medium farmers, followed by small
farmers. The total amount sanctioned was also higher for the semi-medium farmers, followed
by small farmers.
Table 2: Farmers’ category-wise distribution of crop loan from commercial and
cooperative banks
Farmers’ category
Institutional source of credit
Total no. of accounts
Total amount (₹ in lakh)
Commercial banks Co-operative banks
No. of accounts
Amount (₹ in lakh)
No. of accounts
Amount (₹ in lakh)
Marginal 5 5.30 10 7.38 15 12.68
Small 9 17.75 15 29.42 24 47.17
Semi-medium
18 34.00 16 30.35 34 64.35
Medium 2 3.50 1 3.50 3 7.00
Large 1 5.50 0 0 1 5.50
Total 35 66.05 42 70.65 77 136.70
Among the 35 crop loan borrowers of commercial banks, the number of accounts and loaned
amount were both higher for the semi-medium category of farmers. Out of 42, crop loan
borrowers of co-operative banks, the semi-medium farmers availed higher amount of loan. It
was also noted that the amount of crop loan sanctioned by the cooperative banks was higher
than by the commercial banks. It showed better access of farmers to cooperative banks.
The investment loan is given by the commercial and co-operative banks to improve the farm
infrastructural facilities. Amongst 33 farmers who borrowed investment loan, 22 borrowed
[image:5.595.71.535.385.578.2]A Monthly Double-Blind Peer Reviewed Refereed Open Access International e-Journal - Included in the International Serial Directories. GE- International Journal of Management Research (GE-IJMR)
Website: www.aarf.asia. Email: editoraarf@gmail.com , editor@aarf.asia
Page 40
categories of borrowers of investment loan, semi-medium farmers were the major
beneficiaries followed by medium farmers.
Table 3: Farmers’ category-wise distribution of investment loan from commercial and cooperative banks
Farmers’ category
Institutional source of credit
Total no. of accounts
Total amount (₹ in lakh)
Commercial banks Co-operative banks
No. of accounts
Amount (₹ in lakh)
No. of accounts
Amount (₹ in lakh)
Marginal 5 5.40 4 4.80 9 10.20
Small 4 5.60 1 1.90 5 7.50
Semi-medium
9 24.05 5 12.10 14 36.15
Medium 3 7.80 1 10.00 4 17.80
Large 1 4.5 0 0 1 4.50
Total 22 47.35 11 28.80 33 76.15
Crop-wise distribution of crop loan
The crop-wise distribution of loan among various categories of farmers by commercial and
co-operative banks has been shown in Table 4 and Table 5. The analysis has revealed that
both commercial and co-operative banks disbursed 87.44 percent of total crop loan amount to
apple. It was due to the fact that the cultivation of apple dominates in the cropping pattern.
The scale of finance fixed by the lead banks for apple crop is also higher and thereby it could
avail higher amount of loan. Pear and Walnut followed in the share of crop loan amount
contributing 4.88 percent and 4.07 percent of total crop loan amount, respectively. Table 4: Farmers’ category-wise distribution of crop loan for different crops by Commercial banks
Category of farmers
Commercial banks
Apple Pear Walnut Paddy Maize
No. of a/c Amt. (in lakh ₹) No. of a/c Amt. (in lakh ₹) No. of a/c Amt. (in lakh ₹) No. of a/c Amt. (in lakh ₹) No. of a/c Amt. (in lakh ₹)
Marginal 3 3.90 0 0 1 0.80 1 0.60 0 0
Small 7 16.45 1 0.80 0 0 1 0.50 0 0
Semi-medium
A Monthly Double-Blind Peer Reviewed Refereed Open Access International e-Journal - Included in the International Serial Directories. GE- International Journal of Management Research (GE-IJMR)
Website: www.aarf.asia. Email: editoraarf@gmail.com , editor@aarf.asia
Page 41
Medium 2 3.50 0 0 0 0 0 0 0 0
Large 1 5.50 0 0 0 0 0 0 0 0
Total 26 59.35 3 3.00 2 1.30 2 1.10 2 1.30
Table 5: Farmers’ category-wise distribution of crop loan for different crops by Cooperative banks
Category of farmers
Cooperative banks
Apple Pear Walnut Paddy Maize
No. of a/c
Amt. (₹)
No. of a/c
Amt. (₹)
No. of a/c
Amt. (₹)
No. of a/c
Amt. (₹)
No. of a/c
Amt. (₹)
Marginal 5 3.80 0 0 3 2.58 1 0.50 1 0.50
Small 13 27.42 1 1.30 0 0 1 0.70 0 0
Semi-medium
12 26.50 2 2.75 0 0 1 0.50 1 0.60
Medium 1 3.50 0 0 0 0 0 0 0 0
Large 0 0 0 0 0 0 0 0 0 0
[image:7.595.66.531.219.447.2]Total 31 61.22 3 4.05 3 2.58 3 1.70 2 1.10
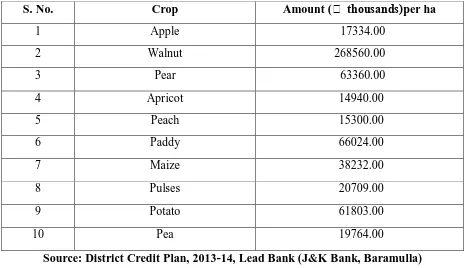
Table 6:Crop-wise credit plan of Baramulla district for the year 2013-14
S. No. Crop Amount (₹ thousands) per ha
1 Apple 17334.00
2 Walnut 268560.00
3 Pear 63360.00
4 Apricot 14940.00
5 Peach 15300.00
6 Paddy 66024.00
7 Maize 38232.00
8 Pulses 20709.00
9 Potato 61803.00
10 Pea 19764.00
[image:7.595.65.532.487.755.2]A Monthly Double-Blind Peer Reviewed Refereed Open Access International e-Journal - Included in the International Serial Directories. GE- International Journal of Management Research (GE-IJMR)
Website: www.aarf.asia. Email: editoraarf@gmail.com , editor@aarf.asia
[image:8.595.66.531.502.763.2]Page 42
Table 6 shows the crop-wise credit allotment plan of Baramulla district for the year 2013-14. It is shown in terms of credit amount per hectare of crop cultivation. The perusal of the table interprets that Apple is the crop having highest credit allotment (₹268560.00) followed by Paddy (₹66024.00).
Coverage and quantum of credit
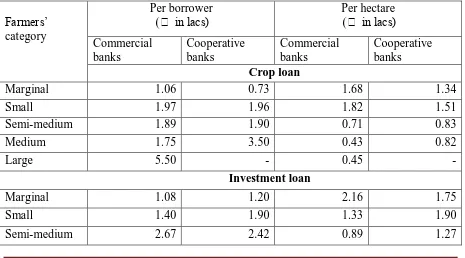
To find the coverage and quantum of credit, distribution of loan in terms of per account and
per hectare were computed for all the categories of farmers and the values have been shown
in Table 7 for both crop and investment loans. A perusal of Table 7 revealed that per
borrower crop loan disbursement had a positive relationship with farm size except
semi-medium and semi-medium categories in commercial banks. In co-operative banks there is also a
positive relationship between crop loan amount and land size except semi-medium farmer
category. It was because the loans were given by the banks to the farmers on the basis of
scale of finance for different crops and also the size of operational landholdings. The crop
loan per hectare from both commercial and cooperative banks also declined with the size of
landholding.
The amount of investment loan per borrower distributed by the commercial bank was found
to be higher for semi-medium farmers’ category, in-spite of their larger number. It was due to
the fact that semi-medium farmers had availed the loan for the purchase of tractors for which
the scale of finance was higher.
Table 7: Distribution of crop loan and investment loan per borrower and per hectare
Farmers’ category
Per borrower (₹ in lacs)
Per hectare (₹ in lacs)
Commercial banks
Cooperative banks
Commercial banks
Cooperative banks Crop loan
Marginal 1.06 0.73 1.68 1.34
Small 1.97 1.96 1.82 1.51
Semi-medium 1.89 1.90 0.71 0.83
Medium 1.75 3.50 0.43 0.82
Large 5.50 - 0.45 -
Investment loan
Marginal 1.08 1.20 2.16 1.75
Small 1.40 1.90 1.33 1.90
[image:8.595.67.532.505.763.2]A Monthly Double-Blind Peer Reviewed Refereed Open Access International e-Journal - Included in the International Serial Directories. GE- International Journal of Management Research (GE-IJMR)
Website: www.aarf.asia. Email: editoraarf@gmail.com , editor@aarf.asia
Page 43
Medium 2.60 1.70 0.60 1.11
Large 4.50 - 0.37 -
On the other hand, it was also higher for semi-medium borrower farmers from the
cooperative banks. The investment loan per hectare declined as the landholding size
increased for both commercial banks and co-operative banks. It indicated less need of loan
for infrastructure development by larger farmers. The per capita investment loan was higher
for marginal farmers from both commercial and cooperative banks.
Effective Cost of Credit
Analysis of the cost of credit forms the base of effective lending. The effective cost of credit
is interest payment plus transaction cost plus opportunity cost. The effective cost of credit
may vary from source to source. Therefore it forms an important factor regarding the
selection of source of credit. Under this objective, the effective cost of credit was calculated
for commercial and cooperative banks by categorizing various costs into financial costs,
[image:9.595.65.533.464.626.2]transaction costs and opportunity costs.
Table 8: Effective cost of credit from commercial banks
Cost of Credit Different Costs Average Effective Cost (%) Total (%)
Financial Cost Interest Rate 12.305 12.305
Transaction Cost Travelling Cost 0.15 0.43
Processing Cost 0.15
Documentation Cost 0.11
Communication Cost 0.02
Opportunity Cost Loss of Wages 0.8 0.8
Total 13.53 13.53
The effective cost of credit from commercial banks worked out to be 13.53 per cent (Table
8), 0.58 per cent higher than effective cost of credit from cooperative banks i.e. 12.95 per
cent (Table 9). It indicated that the cooperative banks serve as a more affordable alternative
for agricultural credit. Farmers generally prefer cooperative banks for borrowing, may be due
A Monthly Double-Blind Peer Reviewed Refereed Open Access International e-Journal - Included in the International Serial Directories. GE- International Journal of Management Research (GE-IJMR)
Website: www.aarf.asia. Email: editoraarf@gmail.com , editor@aarf.asia
[image:10.595.66.531.106.268.2]Page 44
Table 9: Effective Cost of Credit from Cooperative Banks
Cost of Credit Different Costs Average Effective Cost (%) Total (%)
Financial Cost Interest Rate 11.74 11.74
Transaction Cost Travelling Cost 0.09 0.1
Processing Cost 0.14
Documentation Cost 0.14
Communication Cost 0.03
Opportunity Cost Loss of Wages 1.11 1.11
Total 12.95 12.95
Factor Analysis- Constraints in Availing Credit
Major constraints faced by farmers in availing agricultural credit from commercial and
cooperative banks include inaccessibility, inadequacy, timely unavailability of loan , high
transaction cost, complicated procedure, small land holding size and short repayment period,
low service speed, lack of infrastructure within the banks, bribe, collateral, no previous
experience, low reputation among community members. These constraints were analyzed by
applying factor analysis. Factor analysis helped to identify the relative importance of the
problems faced by farmers. In factor analysis, Bartlett test of sphericity and
Kaiser-Meyer-Olkin (KMO) test were applied.
The hypothesis of the factor analysis is that the constraint factors are uncorrelated to each
other.
Bartlett’s Test of Sphericity
Bartlett’s Test of Sphericity is a test statistics used to examine the hypothesis that the
variables are uncorrelated in the population. In this case the null hypothesis related to the appropriateness of the factor analysis has been rejected, (as significant level is beyond the .05 level). So the data collected were found to be appropriate for the factor analysis.
Sample Adequacy
A Monthly Double-Blind Peer Reviewed Refereed Open Access International e-Journal - Included in the International Serial Directories. GE- International Journal of Management Research (GE-IJMR)
Website: www.aarf.asia. Email: editoraarf@gmail.com , editor@aarf.asia
Page 45
Table 10: KMO and Bartlett's test
Kaiser-Meyer-Olkin Measure of Sampling Adequacy. .746
Bartlett's Test of Sphericity Approx. Chi-Square 274.584
Df 78
Sig. .000
Determining the number of factor extracted
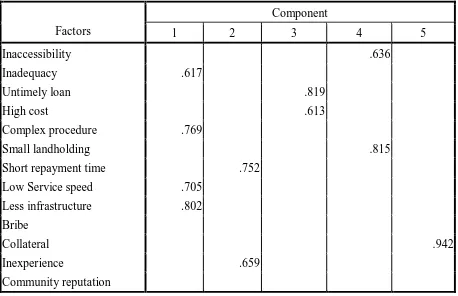
[image:11.595.70.526.495.761.2]The factors having Eigen value greater than 1 (as indicated in Table 11) were extracted. The principal component method using Varimax procedure reduced the 13 explanatory variables to 5 factors having Eigen values greater than 1. For the purpose of interpretation, each factor was composed of variables with factor loading 0.40 or higher on that factor. But the cumulative percentage of variance technique by combining all the factors was also taken into consideration. The rule of thumb is that the factors extracted should account for at least 60 percent of the variance. Here the number of the factors extracted was found to be five, and the cumulative percentage of variance explained by all these five factors accounted for more than sixty percent (63.370 percent).
Table 11: Total variance explained
Component
Initial Eigen values Rotation Sums of Squared Loadings
Total
percent of Variance
Cumulative
percent Total
percent of Variance
Cumulative percent
1 3.347 25.750 25.750 3.018 23.215 23.215
2 1.459 11.220 36.970 1.438 11.059 34.274
3 1.318 10.139 47.109 1.404 10.800 45.074
4 1.112 8.552 55.660 1.305 10.038 55.113
5 1.002 7.709 63.370 1.073 8.257 63.370
6 .997 7.666 71.035
7 .779 5.992 77.028
8 .770 5.922 82.950
9 .622 4.783 87.733
A Monthly Double-Blind Peer Reviewed Refereed Open Access International e-Journal - Included in the International Serial Directories. GE- International Journal of Management Research (GE-IJMR)
Website: www.aarf.asia. Email: editoraarf@gmail.com , editor@aarf.asia
Page 46
11 .475 3.652 95.729
12 .323 2.483 98.213
13 .232 1.787 100.000
The first factor alone explained 25.750 percent of the total variability. The second factor alone explained 11.220 percent of the total variability and the first two factors, in
[image:12.595.70.528.395.691.2]combination, explained 36.970 percent of the total variability. The third factor explained alone 10.139 percent of the total variability and the three factors, in combination, explained 47.109percent of the total variability. The fourth factor explained 8.552 percent and the fifth factor explained 7.709 percent of total variability (Table 11). Varimax rotation procedure was applied for the selected 13 attributes (Table 12). The factor loadings of the 13 variables were then observed and variables were clubbed into five factors.
Table 12: Rotated component matrix
Component
Factors 1 2 3 4 5
Inaccessibility .636
Inadequacy .617
Untimely loan .819
High cost .613
Complex procedure .769
Small landholding .815
Short repayment time .752
Low Service speed .705
Less infrastructure .802 Bribe
Collateral .942
Inexperience .659
Community reputation
A Monthly Double-Blind Peer Reviewed Refereed Open Access International e-Journal - Included in the International Serial Directories. GE- International Journal of Management Research (GE-IJMR)
Website: www.aarf.asia. Email: editoraarf@gmail.com , editor@aarf.asia
Page 47
Component 1: Operational inefficiencies (banks): Inadequate loan amount, complex loan procedure, Low service speed of banks, inadequate infrastructure within banks
Component 2: Borrowing risks: Short repayment time, inexperience of taking loan Component 3: Ineffective lending: Untimely credit, high cost of credit
Component 4: Banking coverage: Inaccessibility, small land size Component 5: Credit security: Collateral
From the above interpretation, it is concluded that not only banking inefficiencies and borrowing risk factors were important but ineffective lending, banking coverage and credit security factors were also equally important. Banks need to concentrate on improving the above parameters for effective agricultural lending.
Conclusion
Based on the findings of the study, the following conclusions are drawn:
The study showed that the majority of the farmers in the study area were semi-medium
farmers (2-4 ha) having 41 percent share followed by small farmers (1-2 ha) with 27 percent
share out of the total number of farmers. This indicates that the landholding within the study
area is very fragmented. The study has revealed that in case of crop loan, semi-medium
farmers have the higher number of accounts i.e. 34 (44.16 percent) and higher sanctioned
amount i.e. ₹64.35 lacs (47.07 percent). Semi-medium farmers have also been the major
beneficiaries of investment loan. Out of the total disbursed investment loan amount, i.e.
₹76.15 lacs, semi-medium category farmers had a share of ₹36.15 lacs (47.47 percent)
followed by medium category farmers of ₹17.8 lacs (23.37 percent).
Out of the total disbursed crop loan amount (₹136.7 lacs), cooperative banks were leading
with a share of ₹70.65 lacs (51.68 percent) and commercial banks had a share of ₹65.05 lacs
(47.58 percent). This indicates that cooperative banks are more active in crop specific lending
than commercial banks. In case of investment loan, commercial banks were at the edge with
a share of ₹47.35 lacs (62.18 percent) out of the total ₹76.15 lacs. Cooperative banks had
the share of ₹28.80 lacs (37.82 percent) out of the total amount. This indicates that the
commercial banks are more involved in long term financing for improving the infrastructural
facilities in farms.
The commercial and co-operative banks have provided higher loans for fruit crops
particularly apple, followed by pear and walnut. This is because the cultivation of apple and
A Monthly Double-Blind Peer Reviewed Refereed Open Access International e-Journal - Included in the International Serial Directories. GE- International Journal of Management Research (GE-IJMR)
Website: www.aarf.asia. Email: editoraarf@gmail.com , editor@aarf.asia
Page 48
bank for these crops is also higher. The effective cost of credit for commercial banks worked
out to be 13.53percent and for cooperative banks it was 12.95percent, 0.58percent lesser than
that of commercial banks. It indicated that the cooperative banks serve as a cheaper
alternative for agricultural credit. Farmers generally prefer cooperative banks for borrowing,
may be due to low acquisition cost of credit. The factor analysis extracted five factors out of
the total 13 problem factors and these factors were clubbed with various component
variables. It was concluded that not only operational inefficiencies of banks and borrowing
risk factors are important but ineffective lending, banking coverage and credit security factors are also equally important.
Suggestions
1. The crop loan and investment loan per borrower for marginal farmers is
comparatively lesser for both commercial and cooperative banks. The financial
institutions have neglected them, may be due to fear of repayment. As the land
holding in the study area is very fragmented. Adequate amount of loan should be
provided to the marginal farmers.
2. The crop specific lending of cooperative banks is good but they need to improve their
lending of investment loans, while commercial banks are good at lending investment
loans but need to provide more crop specific credit to improve the local agriculture
and horticulture.
3. The loan per hectare sanctioned by both commercial and co-operative banks is not in
proportion to the landholding size. Banks need to provide credit taking into
consideration the farm requirements of farmers.
4. Cooperative banks acts as more affordable source of agricultural credit, moreover
their banking penetration within the study area is much deeper than the commercial
banks. They need to focus on improving their banking service reputation by
improving the infrastructure and service speed. Cooperative banks need to specifically
target the younger generation of farmers, as they are the future customers of banking
industry. The study has indicated that the younger farmers and those having higher
landholdings prefer to take credit from commercial banks. Cooperative banks need to
improve on these attributes.
5. Cost of credit and accessibility shouldn’t be neglected while designing any credit
A Monthly Double-Blind Peer Reviewed Refereed Open Access International e-Journal - Included in the International Serial Directories. GE- International Journal of Management Research (GE-IJMR)
Website: www.aarf.asia. Email: editoraarf@gmail.com , editor@aarf.asia
Page 49
References :
Bhatt, M. and Bhat, S.A., (2013), “Financial Performance and Efficiency of Cooperative Banks in Jammu & Kashmir (India)”, Journal of Co-Operative
Accounting and Reporting, V2, N1, Summer 2013.
Chander, Ramesh and Chandel, Jai Kishan, (2010), “Financial Viability of an Apex
Cooperative Credit Institution- A Case Study of the HARCO Bank”, Asia- Pacific Business Review, 6(2): 61-70.
Das, A. & Gosh, S. (2009), “Financial Deregulation and Efficiency: An Empirical
Analysis of Indian Banking During the Post-Reform Period”, Review of Financial Economics, 15(3): 193-221.
Economic Survey, Govt of J&K (2013-14), Chapter 15: 162-179,
http://www.jandkplanning.com/images/economicsurvey2014/EconomicSurvey2014.pdf Golait, Ramesh (2007), “Current Issues in Agricultural Credit in India: An
Assessment”, A Project Report published by Reserve Bank of India Occasional
Papers, 28(1).
Kataria, P. and Chahal, S.S. (2005), “Rural credit delivery system in India: performance appraisal of scheduled commercial banks”. Indian Journal of
Agricultural Economics, 60(3): 364-366.
Katchova, A. and Barry,P. (2005), Credit risk models and agricultural lending.
American Journal of Agricultural Economics, 87: 195-206.
Kullur, M.S. (2005). “Impact of Kisan Credit Card on flow of credit and repayment
rate in a backward region”. Indian Journal of Agricultural Economics, 60(3):
396-398.
Kumar, Anjani. Singh, K. and Sinha, (2010), “Institutional Credit to Agriculture Sector in India: Status, Performance and Determinants”, Agricultural Economics
Research Review, Vol. 23 July-December 2010 pp 253-26.
Satyasai, K. (2008), “Rural Credit Delivery in India: Structural Constraints and Some Corrective Measures”, Agricultural Economics Research Review Vol. 21 (Conference
A Monthly Double-Blind Peer Reviewed Refereed Open Access International e-Journal - Included in the International Serial Directories. GE- International Journal of Management Research (GE-IJMR)
Website: www.aarf.asia. Email: editoraarf@gmail.com , editor@aarf.asia
Page 50
Singh, S., Kaur , M. and Kingara, H. (2007). “Institutional Agricultural Credit in Punjab, Growth and Inadequacies”. Indian Journal of Agricultural Economics,
62(3):367-368.
Soni, A. and Saluja, H. (2012), “Role of Cooperative Bank in Agricultural Credit: A