and Darrall-Jones, J and Stokes, K and Till, K (2017) Between-Day Reliability and Usefulness of a Fitness Testing Battery in Youth Sport Athletes: Reference Data for Practitioners. Mea-surement in Physical Education and Exercise Science, 22 (1). pp. 1-8. ISSN 1091-367X DOI: https://doi.org/10.1080/1091367X.2017.1360304
Link to Leeds Beckett Repository record: http://eprints.leedsbeckett.ac.uk/4284/
Document Version: Article
This is an Accepted Manuscript of an article published by Taylor & Francis in Measure-ment in Physical Education and Exercise Science on 23 August 2017, available online: http://www.tandfonline.com/10.1080/1091367X.2017.1360304
The aim of the Leeds Beckett Repository is to provide open access to our research, as required by funder policies and permitted by publishers and copyright law.
The Leeds Beckett repository holds a wide range of publications, each of which has been checked for copyright and the relevant embargo period has been applied by the Research Services team.
We operate on a standard take-down policy. If you are the author or publisher of an output and you would like it removed from the repository, please contact us and we will investigate on a case-by-case basis.
Between-day reliability and usefulness of a fitness testing battery in youth sport 1
athletes: Reference data for practitioners 2
Running Head: Reliability of a fitness testing battery in youth sport athletes 3
4
Thomas Sawczuk1,2, Ben Jones1,2,3,4,5, Sean Scantlebury1,2, Jonathon Weakley1,2,3, Dale 5
Read1,3, Nessan Costello1,2,4, Joshua David Darrall-Jones1,3, Keith Stokes6 and Kevin Till1,3,4 6
7
1
Institute for Sport, Physical Activity and Leisure, Leeds Beckett University, Leeds, United 8
Kingdom 9
2
Queen Ethelburga's Collegiate, Thorpe Underwood, York, United Kingdom 10
3
Yorkshire Carnegie Rugby Club, Headingley Carnegie Stadium, Leeds, United Kingdom 11
4
Leeds Rhinos Rugby Club, Headingley Carnegie Stadium, Leeds, United Kingdom 12
5
The Rugby Football League, Red Hall, Leeds, United Kingdom 13
6
University of Bath, Claverton Down, Bath, United Kingdom 14
15
Corresponding Author: 16
Thomas Sawczuk 17
Room G03, Macaulay Hall 18
Institute for Sport, Physical Activity and Leisure 19
Centre for Sports Performance 20
Leeds Beckett University, Headingley Campus 21
West Yorkshire 22
LS6 3QS 23
Phone: (0044) 7530945555 24
Abstract 26
This study aimed to evaluate the between-day reliability and usefulness of a fitness testing 27
battery in a group of youth sport athletes. Fifty-nine youth sport athletes (age = 17.3 ± 0.7 28
years) undertook a fitness testing battery including the isometric mid-thigh pull (IMTP), 29
countermovement jump (CMJ), 5-40 m sprint splits, and the 5-0-5 change of direction test on 30
two occasions separated by 7 days. Usefulness was assessed by comparing the reliability 31
(typical error; TE) to the smallest worthwhile change (SWC). The TE was 5.5% for IMTP 32
and 3.8% for CMJ. The TE values were 2.7%, 2.5%, 2.2%, 2.2% and 1.8% for the 5, 10, 20, 33
30 and 40 m sprint splits, and 4.1% (left) and 5.4% (right) for the 5-0-5 tests. SWC ranged 34
from 1.1% to 6.1%. All tests were identified as having "good" or "acceptable" reliability. The 35
IMTP and CMJ had "good" usefulness, all other tests had "marginal" usefulness. 36
37
Introduction 39
The importance of developing strength, power, speed and change of direction 40
qualities to improve athletic performance and reduce injury risk in adolescent athletes has 41
been highlighted regularly in recent years (Lloyd et al., 2016; Reilly, Williams, Nevill, & 42
Franks, 2000; Young, 2006). This, in addition to the recent National Strength and 43
Conditioning Association (NSCA) position statements indicating that resistance training is 44
beneficial for the youth athlete, has resulted in an increase in the number of adolescents 45
participating in structured strength and conditioning programmes (Faigenbaum et al., 2009; 46
Lloyd et al., 2016). A number of these programmes take place at schools or colleges where 47
adolescents are given scholarships based on their sporting prowess. A recent report by Ofsted 48
has suggested that as many as 15% of current international athletes across a range of sports 49
received a sports scholarship at some point during their school life, highlighting their 50
importance (Ofsted, 2014). As part of the scholarships, it is common for coaches to use 51
fitness testing batteries to regularly measure and monitor the physical characteristics of their 52
athletes (Pyne, Spencer, & Mujika, 2014). However, little information is available regarding 53
the between-day reliability of these tests, particularly in a school sport environment where 54
athletes of different indoor and outdoor sports regularly train and test their physical 55
capabilities together. 56
57
The between-day reliability of a test refers to its ability to produce consistent results 58
from day to day (Hopkins, 2000). In order for coaches to be confident that changes in 59
performance from a specific test are "real" and not due to the daily variation in the test, it is 60
important that the test has good between-day reliability. Although good reliability of a test is 61
necessary, in order for its results to be interpretable it is also important that it is sensitive 62
termed its "usefulness" (Hopkins, 2004) and is assessed by comparing a test's between-day 64
reliability, or typical error (TE), to the SWC. To do this, the TE is usually converted into a 65
factor of the SWC, which can be termed the "TE:SWC ratio". If the SWC is greater than a 66
test's between-day reliability (i.e. TE:SWC ratio < 1) it is considered to have good usefulness. 67
Conversely, if the SWC is smaller than its between-day reliability, (i.e. TE:SWC ratio > 1), 68
its usefulness is said to be "marginal" (Hopkins, 2004). This information can be used to 69
assess the length of time which may be required between tests in order for a clear change in 70
performance to be seen. A number of tests of strength, power, speed and change of direction 71
ability have had their between-day reliability and usefulness considered in recent times 72
(Cormack, Newton, McGulgan, & Doyle, 2008; Darrall-Jones, Jones, Roe, & Till, 2015; De 73
Witt et al., 2016; Gabbett, Kelly, & Sheppard, 2008; Haff, Ruben, Lider, Twine, & Cormie, 74
2015; Roe et al., 2016; Stewart, Turner, & Miller, 2014), however the reliability has been 75
shown to vary between sports and cohorts, so a study considering the between-day reliability 76
and usefulness of these tests in a group of school based adolescent athletes across multiple 77
sports is warranted. 78
79
A recently conceptualised and novel single measure of strength is the isometric mid-80
thigh pull (IMTP). The IMTP is designed to mimic the second pull phase of the snatch and 81
clean (Haff et al., 2005), and has shown to be strongly correlated with weightlifting 82
performance (Beckham et al., 2013). It requires little technical expertise indicating it is 83
suitable for athletes of all training ages with little familiarisation (Beckham, 2015). To date, 84
the majority of IMTP reliability studies have shown force plates to be reliable measures, with 85
intraclass correlation coefficients ranging from .92-.99 (De Witt et al., 2016; Haff et al., 86
2015), however given the high cost of the equipment, force plates are likely only available 87
cost alternative is to use a back dynamometer, the reliability of which (test-retest correlation, 89
r = .91) has only been shown in older population groups (Coldwells, Atkinson, & Reilly, 90
1994). However, this study did not provide the typical error (TE) as a coefficient of variation 91
(CV), limiting its practical use (Hopkins, 2000), so a study considering the between-day 92
reliability and usefulness of the IMTP using a back dynamometer in youth sport athletes is 93
warranted. 94
95
The countermovement jump (CMJ) has received considerable attention in recent years 96
as a measure of neuromuscular power. Although the majority of this attention has come with 97
regards to its use as a daily monitoring tool for neuromuscular power (McLean, Coutts, 98
Kelly, McGuigan, & Cormack, 2010; Roe et al., 2016), CMJ height can still be used as a 99
surrogate measure of lower body power similar to the vertical jump used in the NFL 100
Combine (McGee & Burkett, 2003). As with the IMTP, the reliability of the CMJ has been 101
shown extensively when using a force plate, with TE's ranging from 5.2-6.8% for jump 102
height and 2.9-3.6% for flight time (Cormack et al., 2008; McLean et al., 2010; Roe et al., 103
2016). However, the less expensive Optojump system for measuring CMJ height has only 104
once had its reliability confirmed (jump height TE = 2.2%) and this took place in a group of 105
older, less well trained individuals (Glatthorn et al., 2011). It is therefore important to assess 106
the between-day reliability and usefulness of the Optojump system as a measure of CMJ 107
height in youth sport athletes. 108
109
Timing gates are frequently used to measure the linear sprint ability of athletes 110
(Darrall-Jones et al., 2015; Duthie, Pyne, Ross, Livingstone, & Hooper, 2006; Young, 111
McLean, & Ardagna, 1995). Within a cohort of rugby players the reliability of timing gates 112
2015), however the movement demands of rugby are different to those of netball (Chandler, 114
Pinder, Curran, & Gabbett, 2014; Read et al., 2017), for example, thus differences in 115
reliability may exist between sports. Furthermore, Darrall-Jones and colleagues (2015) found 116
timing gates to have "marginal" usefulness, limiting the ability of the test to detect small 117
changes in performance. In addition to possessing linear speed, it is important that athletes 118
are able to move in a multi-directional manner (Sheppard & Young, 2006). As such, a test to 119
determine the change of direction ability of youth athletes, for example the 5-0-5 test (Draper 120
& Lancaster, 1985), should exist within a fitness testing battery. Previous studies have shown 121
the 5-0-5 test measured using timing gates to be reliable in adult rugby league players (TE = 122
1.9%; Gabbett et al., 2008) and school PE students measured indoors (TE = 2.8%; Stewart et 123
al., 2012). However, the 5-0-5 test is regularly assessed outdoors (Darrall-Jones, Jones, & 124
Till, 2015; Gabbett et al., 2008) and differences in the between-day reliability of a test may 125
be present in the same cohort in different conditions (i.e. indoor vs outdoor testing). Given 126
the common use of timing gates to measure sprinting ability, a study involving numerous 127
different sports, including both males and females, is required to establish the reliability and 128
usefulness of timing gates for measuring speed in a multi-sport setting. Furthermore, 129
establishing the reliability of the 5-0-5 test on an outdoor surface will provide useful 130
information for coaches working with multi-sport youth athletes and will allow the usefulness 131
of the test to be determined. 132
133
Despite a large number of sports scholarships across the globe, where general fitness 134
testing protocols may be put in place, the majority of research considering the between day 135
reliability of fitness testing protocols has taken place in individual sports (Cormack et al., 136
2008; Darrall-Jones et al., 2015; Gabbett et al., 2008). Consequently, the aim of this study 137
incorporating measures of strength, power, speed and change of direction ability in 139
scholarship youth sport athletes. 140
141
Methods 142
Participants
143
Fifty-nine youth sport athletes (39 males, 20 females, age 17.3 ± 0.7 years, height 175.0 ± 144
17.4 cm, body mass 75.5 ± 14.0 kg) were recruited for this study from a local independent 145
school in the United Kingdom. The athletes were part of the school's sport scholarship 146
programme and had all previously competed at professional academy level or above, but 147
were now club/school (n = 34), professional academy (n = 7), county/regional (n = 14) or 148
international (n = 4) standard in their respective sports. The sports represented were 149
basketball (n = 3), cricket (n = 5), football (n = 10), hockey (n = 9), netball (n = 10) and 150
rugby (n = 22). Ethics approval was granted by the University Ethics Committee and written 151
informed consent was provided by all participants and their parents prior to the study. 152
153
Research Design 154
In order to assess the between day reliability of this fitness testing battery, participants 155
completed the tests on two separate occasions over a two-week period. Participants refrained 156
from strenuous exercise in the 24 hours prior to each testing day, and training volume was 157
standardised for the duration of the study, so that participants completed the same number of 158
sessions in both weeks, in line with previous studies (Duthie et al., 2006; Stewart et al., 159
2012). These sessions consisted of strength and conditioning and technical training sessions, 160
both of which were controlled for intensity between weeks. On days one and seven, subjects 161
performed measures of strength via the IMTP and power via the CMJ. On days four and ten, 162
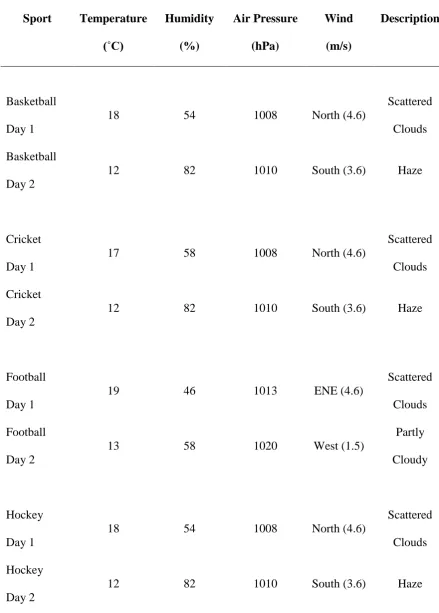
of direction ability were performed. On all testing days, the test inducing the greatest strain 164
on the neuromuscular system was performed first in order to enhance the reliability of all 165
maximal testing procedures (Harman, 2008). On days one and seven, this meant the CMJ was 166
performed first; on days four and ten, the 5-0-5 change of direction test was performed first. 167
Participants completed field based measures on either a 4G outdoor artificial grass playing 168
surface (cricket, football and rugby) or an outdoor running track (basketball, hockey and 169
netball), dependent on their sport. Ambient conditions were measured using a weather station 170
(Davis Instruments Corporation, Hayward, USA). These are shown in Table 1. A 171
standardised dynamic warm up including leg swings, lunges, squats was performed prior to 172
each testing session. Participants had been familiarised to all tests earlier in the academic 173
year. 174
175
***INSERT TABLE 1 HERE*** 176
177
Protocols 178
The IMTP was performed using a modified back dynamometer (Takei Scientific 179
Instruments Co., Niigata City, Japan). The modification increased the size of the base so that 180
participants could stand with their feet shoulder width apart rather than hip width as 181
necessitated by the original model. Participants were instructed to stand with their feet 182
shoulder width apart and knees bent at 120-135˚ in line with previous studies (Beckham et 183
al., 2013; Darrall-Jones et al., 2015). The bar was adjusted so that when they held it taut with 184
a straight back and arms, it reached the middle of their thigh. Participants were instructed to 185
pull directly upwards, keeping their feet flat on the platform and without leaning back. Two 186
warm up pulls were performed at 50% and 75% of maximum, before three all out efforts 187
189
The CMJ was performed using the Optojump system (Microgate, Bolzano, Italy). 190
Jump height was reported in centimetres. Participants began with their legs fully extended 191
and their feet at a self-selected width, with their hands on their hips. They were then 192
instructed to squat down and jump as high as they could in a fluid, countermovement motion. 193
The depth of the countermovement was self-selected. Participants were instructed to keep 194
their legs extended in flight and to land with their legs straight. Two warm up jumps were 195
completed, before three maximal efforts were executed with a 3-minute rest provided in 196
between each repetition. 197
198
Linear sprint speed was assessed via 40 m sprint with split times taken at 5, 10, 20, 199
30 and 40 m using single beam timing gates (Brower Timing Systems, IR Emit, USA). The 200
height of the timing gates was standardised at 1m in line with previous guidelines (Cronin & 201
Templeton, 2008). The sprinting direction was standardised as north-west for all sessions. 202
Participants were instructed to start 0.5 m behind the first timing gate and to start their sprints 203
at a self selected time. Three maximal efforts were performed, each separated by 3-minutes 204
rest. As part of their warm up, participants completed one practice sprint. 205
206
The 5-0-5 change of direction test was also measured using single beam timing gates 207
(Brower Timing Systems, IR Emit, USA) and was performed after the 40 m sprints, 208
following 5 minutes of rest. Participants began the test at a self selected time, sprinting 10 m 209
in a south-easterly direction (i.e. opposite to the sprints) before planting their foot beyond a 210
white line, turning 180˚ and sprinting back 5 m. The timing gates measured the time from 5 211
completed with 3-minutes rest in between each effort. One practice test was completed as 213
part of the warm up procedure. 214
215
Data Analysis 216
For all tests, the best of three efforts was taken for the between day reliability 217
analysis, in line with previous studies (Darrall-Jones et al., 2015; Gabbett et al., 2008). Data 218
were log transformed to allow the TE to be calculated as a CV (%), along with the SWC 219
using a premade Microsoft Excel spreadsheet (Hopkins, 2015). The TE is calculated as 220
follows: 221
TE = Sdiff/√2 222
where Sdiff is the standard deviation of the difference score between two trials (Hopkins, 223
2000). Back transformation of the log transformed data provided the TE as a percentage 224
relative to the mean. Similar to previous studies, a CV of 5% or less was used to categorise a 225
reliable variable (Darrall-Jones et al., 2015; Roe et al., 2016). The SWC was calculated as 0.2 226
x between-subject standard deviation, in line with the Cohen's d effect size principle, and 227
expressed as a percentage of the mean in order to compare with the CV. The usefulness of the 228
test was classified according to the Hopkins (2000) criteria: Good (CV < SWC; TE:SWC 229
ratio < 1), OK (CV = SWC; TE:SWC ratio = 1) or Marginal (CV > SWC; TE:SWC ratio > 230
1). 231
232
Results 233
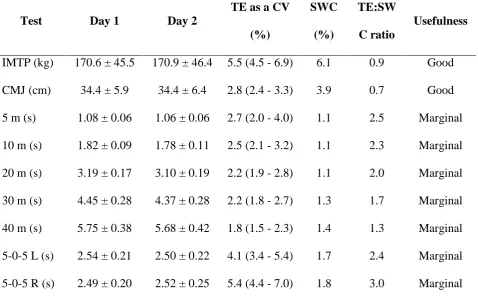
Table 2 shows the TE as a CV, SWC, TE:SWC ratio and usefulness of the tests. All 234
sprint splits had less than 5% CV and so were considered reliable tests. The CMJ also showed 235
reliability. All timing gate measured tests' usefulness was considered "marginal", whereas the 237
IMTP and CMJ tests were considered to have "good" usefulness. 238
239
***INSERT TABLE 2 HERE*** 240
241
Discussion 242
The aim of this study was to assess the between-day reliability and usefulness of a 243
fitness testing battery in a group of youth sport athletes of varying standards. The main 244
finding is that all fitness testing protocols were shown to have good (< 5% TE) or acceptable 245
(~5% TE) between-day reliability. A further finding of the study is that the strength and 246
power tests showed "good" usefulness, whereas speed and change of direction tests using the 247
timing gates showed "marginal" usefulness. As a consequence, the IMTP and CMJ tests are 248
able to detect smaller changes in performance with greater certainty than the timing gate 249
protocols. 250
251
A number of studies have considered the reliability of the IMTP using a force plate 252
(De Witt et al., 2016; Haff et al., 2015), however to these authors' knowledge the only study 253
to have considered a back dynamometer did not provide the TE of the test, and therefore did 254
not provide practically useful results (Coldwells et al., 1994). Our results confirm the 255
between-day reliability of the use of a back dynamometer to measure the IMTP strength of a 256
youth sport athlete. The TE of 5.4% is slightly greater than, but still comparable with, the 1.7 257
and 3.1% values previously reported using force plates (Haff et al., 2015; James, Roberts, 258
Haff, Kelly, & Beckman, in press). The difference in these figures is likely due to previously 259
reported values using more expensive devices with greater sampling frequencies (e.g. force 260
that little familiarisation is required to perform the test (Beckham, 2015), the ability to 262
consistently produce strength and power from this position is likely to require familiarisation 263
to and training in Olympic weightlifting techniques. The 1.4% difference in the previously 264
reported values (Haff et al., 2015; James et al., in press) provides support for this theory as 265
the study by Haff and colleagues, which used participants who regularly performed 266
"resistance training, including [Olympic] weightlifting movements" (Haff et al., 2015), 267
showed greater reliability than the "recreationally active with ≥ 6 months resistance training 268
exercise" participants used in James and colleagues' study (James et al., in press). 269
270
Our results demonstrate the reliability of the Optojump system for measuring power 271
via CMJ height in adolescent youth sport athletes. The 2.8% TE here is similar to the 2.2% 272
TE shown in an older, less trained age group by Glatthorn and colleagues (2011). Unlike the 273
back dynamometer, this is much lower than those values reported in force plate studies 274
(Cormack et al., 2008; Roe et al., 2016). It is suggested that this is because force plates 275
calculate jump height differently to the Optojump system. Force plates calculate jump height 276
using the velocity of the centre of mass at take off, whereas the Optojump system calculates 277
flight time using the breaking of an infrared beam. No equation was provided by either 278
previous study for their calculation of jump height from a force plate (Cormack et al., 2008; 279
Roe et al., 2016), however both provided between-day reliability values for the flight time of 280
the jump and our 2.8% between-day reliability value is comparable with the 3.3% (Cormack 281
et al., 2008) and 2.6% (Roe et al., 2016) measurements previously quoted. 282
283
The results of the sprints show all splits to have good between-day reliability. 284
Previous studies have either shown all sprint splits to be reliable (Darrall-Jones et al., 2015) 285
(Earp & Newton, 2012). Our results are similar to those of Darrall-Jones and colleagues 287
(2015) in that all splits were reliable, but also follow their trend of better reliability with 288
increased sprint split distance. The difference in reliability between shorter (e.g. 5 m) and 289
longer (e.g. 30 m) splits, however, was not sufficient for the shorter distances to provide a 290
value greater than the 5% threshold set for good between-day reliability. 291
292
The results of the 5-0-5 change of direction test showed acceptable levels of 293
reliability. Our values of 4.1% and 5.4% for left and right foot respectively are greater than 294
the previously reported values of 2.8% in adult rugby league players (Stewart et al., 2012) 295
and 1.9% in school physical education students, measured indoors (Gabbett et al., 2008). This 296
variation in the studies' results may be due to differences in the techniques used to measure 297
speed (e.g. single beam electronic timing gates vs the dual beam electronic timing gates used 298
by Gabbett and colleagues (2008)) and the differences between testing outdoors or on an 299
indoor running surface, as used by Stewart and colleagues (2012). Although there is little 300
difference in the ambient conditions shown in Table 1, the slight reduction in reliability is 301
likely due to the inherent variability in weather and ground conditions for outdoor field 302
testing, and thus should be a consideration for those involved in testing young athletes. This 303
is also shown by the difference in reliability between the two previous studies (Gabbett et al., 304
2008; Stewart et al., 2012). The between-day difference in sprint time was lowest in the study 305
of Stewart et al. (2014), where testing was undertaken indoors, despite the more precise 306
timing gates used by Gabbett and colleagues (2008), where testing was undertaken outdoors. 307
308
With regards to the usefulness of the tests, the IMTP and CMJ tests were identified as 309
useful tests (TE:SWC ratio < 1). However, despite showing good reliability, the sprint splits 310
ratio > 1). In order for a practitioner to assess whether a "real" change in performance has 312
occurred, it is important to plot the change in performance ± TE against the SWC. If the TE 313
remains outside the SWC, it can be postulated that a change has occurred with 75% 314
probability, however if the TE crosses the SWC, the changes are deemed unclear (Hopkins, 315
2000). Figure 1 shows a practical example of this, plotting a sample change in performance 316
for the 10 and 20 m sprint splits of a player, using the SWC and TE values reported in this 317
paper. It is due to this method of interpreting results that the usefulness of a test is important. 318
In order for the change in performance to be considered "real" with 75% confidence, it must 319
be greater than or equal to the SWC + TE. In the case of the IMTP and CMJ tests, this means 320
that a change of 1.9 and 1.7 times the SWC would be required respectively; however for the 321
5-0-5 test this can rise to as much as four times the SWC. As a consequence, a much greater 322
improvement in performance is needed for practitioners to be confident that a "real" change 323
has occurred. Given an average 5-0-5 performance of 2.5 s and an SWC of 1.8% (0.05 s), a 324
change in performance of 0.20 s would be required to be sure with 75% probability that a 325
"real" change has occurred. This may be an unrealistic expectation if the test is to be used on 326
a regular (e.g. monthly/quarterly) basis, rather than a longer-term basis (e.g. bi-327
annually/annually). In this situation, practitioners are advised to use the test less regularly 328
(e.g. bi-annually/annually) so that performance changes are greater and therefore more 329
certain, or accept that there will be a large element of uncertainty in results if testing occurs 330
regularly and performance changes are smaller. 331
332
***INSERT FIGURE 1 HERE*** 333
334
Although this study has shown the reliability of a fitness testing battery in male and 335
important to understand the limitations inherent in the testing protocols. It could be argued 337
that not splitting the tests by sex is a limitation of the study, however in the only study to date 338
to compare the reliability of a fitness test between sex, no significant differences in reliability 339
were found (Augustsson et al., 2009). The multi-sport nature of the study could be seen as a 340
limitation. It has previously been noted that the movement demands of the sports are different 341
(Chandler et al., 2014; Read et al., 2017), however this study shows that within a multi-sport 342
environment, this fitness testing battery remains reliable. Future research may wish to assess 343
whether there are differences in reliability between sports, however given previous research 344
that shows no differences in reliability between sex (Augustsson et al., 2009), it is possible 345
that the differences between sports will be negligible. The use of two different surfaces for 346
the sprint based tests (outdoor athletics track and 4G artificial grass) could also be seen as a 347
limitation, however this could happen in practice if teams were to perform sprint testing on 348
their normal playing surface. Furthermore, as the surface remained constant between days, it 349
should not have had an impact on the results seen. 350
351
Finally, in order for this testing battery to be considered complete, a marker of aerobic fitness 352
should also be included. Along with its performance related benefits, aerobic fitness has been 353
associated with reduced injury risk in adolescents (Brenner, 2007; Difiori et al., 2014). It is a 354
limitation of this study that a test of aerobic fitness was not included, however both the Yo-355
Yo Intermittent Recovery Test (Bangsbo, 1994; Bangsbo, Iaia, & Krustrup, 2008) and the 30-356
15 Intermittent Fitness Test (Buchheit & Rabbani, 2014) have had their reliability and 357
sensitivity to training confirmed in similar populations and conditions to this study (Buchheit 358
& Rabbani, 2014; Deprez et al., 2014). Consequently, the authors decided not to include 359
either of these tests in this study. 360
In conclusion, this study has shown the reliability and usefulness of a fitness testing 362
battery aimed at monitoring strength, power and speed qualities in youth sport athletes. The 363
IMTP and CMJ were shown to be both reliable and have good usefulness. The sprint splits 364
and 5-0-5 test were shown to be reliable but had marginal usefulness. To this end, the IMTP 365
and CMJ are able to detect the smaller changes in performance with greater certainty than the 366
sprint splits and 5-0-5 test. It is recommended that either the Yo-Yo Intermittent Recovery 367
Test Level 1 or 30-15 Intermittent Fitness Test is added to ensure the battery provides a 368
complete understanding of the athlete's physical capabilities. 369
References 371
Augustsson, S. R., Bersas, E., Thomas, E. M., Sahlberg, M., Augustsson, J., & Svantesson, 372
U. (2009). Gender differences and reliability of selected physical performance tests in 373
young women and men. Advances in Physiotherapy, 11, 64–70. 374
Bangsbo, J. (1994). Fitness training in football: A scientific approach. Copenhagen 375
University: August Krogh Institute. 376
Bangsbo, J., Iaia, F. M., & Krustrup, P. (2008). The Yo-Yo Intermittent Recovery Test: A 377
useful tool for evaluation of physical performance in intermittent sports. Sports 378
Medicine, 38, 37–51. http://doi.org/10.2165/00007256-200838010-00004
379
Beckham, G. K. (2015). The effect of various body positions on performance of the isometric 380
mid-thigh pull.(PhD Thesis). East Tennessee State University. Retrieved from
381
http://dc.etsu.edu/etd/2544 382
Beckham, G., Mizuguchi, S., Carter, C., Sato, K., Ramsey, M., Lamont, H. S., … Stone, M. 383
H. (2013). Relationships of isometric mid-thigh pull variables to weightlifting 384
performance. Journal of Sports Medicine and Physical Fitness, 53, 573–581. 385
Brenner, J. S. (2007). Overuse injuries, overtraining, and burnout in child and adolescent 386
athletes. Pediatrics, 119, 1242–1245. http://doi.org/10.1542/peds.2007-0887 387
Buchheit, M., & Rabbani, A. (2014). The 30-15 Intermittent Fitness Test versus the Yo-Yo 388
Intermittent Recovery Test Level 1: Relationship and sensitivity to training. 389
International Journal of Sports Physiology and Performance, 9, 522–524.
390
http://doi.org/10.1111/j.1399-0012.2012.01641.x 391
Chandler, P. T., Pinder, S. J., Curran, J. D., & Gabbett, T. J. (2014). Physical demands of 392
training and competition in collegiate netball players. Journal of Strength and 393
Conditioning Research, 28, 2732–2737. http://doi.org/10.1519/1533-4287(2005)19<202
394
dynamometry. Ergonomics, 37, 79–86. 396
Cormack, S. J., Newton, R. U., McGulgan, M. R., & Doyle, T. L. A. (2008). Reliability of 397
measures obtained during single and repeated countermovement jumps. International 398
Journal of Sports Physiology and Performance, 3, 131–144.
399
Cronin, J. B., & Templeton, R. L. (2008). Timing light height affects sprint times. Journal of 400
Strength and Conditioning Research, 22, 318–20.
401
http://doi.org/10.1519/JSC.0b013e31815fa3d3 402
Darrall-Jones, J. D., Jones, B., Roe, G., & Till, K. (2015). Reliability and usefulness of linear 403
sprint testing in adolescent rugby union and league players. Journal of Strength and 404
Conditioning Research, 30, 1359–1364. http://doi.org/10.1519/JSC.0000000000001233
405
Darrall-Jones, J. D., Jones, B., & Till, K. (2015). Anthropometric and physical profiles of 406
English academy rugby union players. Journal of Strength and Conditioning Research, 407
29, 2086–2096. 408
De Witt, J. K., English, K. L., Crowell, J. B., Kalogera, K. L., Guilliams, M. E., Nieschwitz, 409
B. E., … Ploutz-Snyder, L. L. (2016). Isometric mid-thigh pull reliability and 410
relationship to deadlift 1RM. Journal of Strength and Conditioning Research, epub 411
ahead of print. http://doi.org/10.1519/JSC.0000000000001605 412
Deprez, D., Coutts, A. J., Lenoir, M., Fransen, J., Pion, J., Philippaerts, R., & Vaeyens, R. 413
(2014). Reliability and validity of the Yo-Yo intermittent recovery test level 1 in young 414
soccer players. Journal of Sports Sciences, 32, 903–910. 415
http://doi.org/10.1080/02640414.2013.876088 416
Difiori, J. P., Benjamin, H. J., Brenner, J., Gregory, A., Jayanthi, N., Landry, G. L., & Luke, 417
A. (2014). Overuse injuries and burnout in youth sports: A position statement from the 418
American Medical Society for Sports Medicine. Clinical Journal of Sport Medicine, 24, 419
Draper, J. A., & Lancaster, M. G. (1985). The 505 test: A test for agility in the horizontal 421
plane. Australian Journal of Science and Medicine in Sport, 17, 15–18. 422
Duthie, G. M., Pyne, D. B., Ross, A. A., Livingstone, S. G., & Hooper, S. L. (2006). The 423
reliability of ten-meter sprint time using different starting techniques. Journal of 424
Strength and Conditioning Research, 20, 246–251. http://doi.org/10.1519/R-17084.1
425
Earp, J. E., & Newton, R. U. (2012). Advances in electronic timing systems: Considerations 426
for selecting an appropriate timing system. Journal of Strength and Conditioning 427
Research, 26, 1245–1248.
428
Faigenbaum, A. D., Kraemer, W. J., Blimkie, C. J. R., Jeffreys, I., Micheli, L. J., Nitka, M., 429
& Rowland, T. W. (2009). Youth resistance training: Updated position statement paper 430
from the National Strength and Conditioning Association. Journal of Strength and 431
Conditioning Research, 23, S60–S79. http://doi.org/10.1519/JSC.0b013e31819df407
432
Gabbett, T. J., Kelly, J. N., & Sheppard, J. M. (2008). Speed, change of direction speed, and 433
reactive agility of rugby league players. Journal of Strength and Conditioning Research, 434
22, 174–181. http://doi.org/10.1519/JSC.0b013e31815ef700 435
Glatthorn, J. F., Gouge, S., Nussbaumer, S., Stauffacher, S., Impellizzeri, F. M., & 436
Maffiuletti, N. A. (2011). Validity and reliability of Optojump photoelectric cells for 437
estimating vertical jump height. Journal of Strength and Conditioning Research, 25, 438
556–560. 439
Haff, G. G., Carlock, J. M., Hartman, M. J., Kilgore, J. L., Kawamori, N., Jackson, J. R., … 440
Stone, M. H. (2005). Force-time curve characteristics of dynamic and isometric muscle 441
actions of elite women Olympic weightlifters. Journal of Strength and Conditioning 442
Research, 19, 741–748.
443
Haff, G. G., Ruben, R. P., Lider, J., Twine, C., & Cormie, P. (2015). A comparison of 444
pull. Journal of Strength and Conditioning Research, 29, 386–395. 446
Harman, E. (2008). Principles of test selection and administration. In T. R. Baechle & R. W. 447
Earle (Eds.), Essentials of Strength and Conditioning (3rd ed., pp. 238–246). 448
Champaign, IL: Human Kinetics. 449
Hopkins, W. G. (2000). Measures of reliability in sports medicine and science. Sports 450
Medicine, 30, 1–15. http://doi.org/10.2165/00007256-200030050-00006
451
Hopkins, W. G. (2004). How to interpret changes in an athletic performance test. 452
Sportscience, 8, 1–7. 453
Hopkins, W. G. (2015). Spreadsheets for analysis of validity and reliability. Sportscience, 19, 454
36–42. 455
James, L. P., Roberts, L. A., Haff, G. G., Kelly, V. G., & Beckman, E. M. (2017). The 456
validity and reliability of a portable isometric mid-thigh clean pull. Journal of Strength 457
and Conditioning Research, 31, 1378–1386.
458
http://doi.org/10.1519/JSC.0000000000001201 459
Lloyd, R. S., Cronin, J. B., Faigenbaum, A. D., Haff, G. G., Howard, R., Kraemer, W. J., … 460
Oliver, J. L. (2016). National Strength and Conditioning Association Position Statement 461
on Long Term Athletic Development. Journal of Strength and Conditioning Research, 462
30, 1491–1509. 463
McGee, K. J., & Burkett, L. N. (2003). The National Football League Combine: A reliable 464
predictor of draft status? Journal of Strength and Conditioning Research, 17(1), 6–11. 465
http://doi.org/10.1519/1533-4287(2003)017<0006:TNFLCA>2.0.CO;2 466
McLean, B. D., Coutts, A. J., Kelly, V., McGuigan, M. R., & Cormack, S. J. (2010). 467
Neuromuscular, endocrine, and perceptual fatigue responses during different length 468
between-match microcycles in professional rugby league players. International Journal 469
of Sports Physiology and Performance, 5, 367–383.
Ofsted. (2014). Competitive school sport - Summary report. Loughborough, United 471
Kingdom. Retrieved from 472
https://www.gov.uk/government/uploads/system/uploads/attachment_data/file/379986/N 473
ational_20Governing_20Bodies_20of_20Sport_20survey_2C_20Competitive_20school 474
_20sport.pdf 475
Pyne, D. B., Spencer, M., & Mujika, I. (2014). Improving the value of fitness testing for 476
football. International Journal of Sports Physiology and Performance, 9, 511–514. 477
Read, D., Jones, B., Phibbs, P., Roe, G., Darrall-Jones, J. D., Weakley, J., & Till, K. (2017). 478
Physical demands of representative match play in adolescent rugby union. Journal of 479
Strength and Conditioning Research, 31, 1290–1296.
480
http://doi.org/10.1519/JSC.0000000000001600 481
Reilly, T., Williams, A. M., Nevill, A., & Franks, A. (2000). A multidisciplinary approach to 482
talent identification in soccer. Journal of Sports Sciences, 18, 695–702. 483
http://doi.org/10.1080/02640410050120078 484
Roe, G., Darrall-Jones, J. D., Till, K., Phibbs, P., Read, D., Weakley, J., & Jones, B. (2016). 485
Between-day reliability and sensitivity of common fatigue measures in rugby players. 486
International Journal of Sports Physiology and Performance, 11, 581–586.
487
http://doi.org/10.1123/ijspp.2015-0413 488
Sheppard, J. M., & Young, W. B. (2006). Agility literature review: Classifications, training 489
and testing. Journal of Sports Sciences, 24, 919–932. 490
http://doi.org/10.1080/02640410500457109 491
Stewart, P. F., Turner, A. N., & Miller, S. C. (2012). Reliability, factorial validity and 492
interrelationships of five commonly used change of direction speed tests. Scandinavian 493
Journal of Medicine & Science in Sports, 24, 500–506.
494
Young, W. B. (2006). Transfer of strength and power training to sports performance. 496
International Journal of Sports Physiology and Performance, 1, 74–83.
497
http://doi.org/10.1123/ijspp.1.2.74 498
Young, W., McLean, B., & Ardagna, J. (1995). Relationship between strength qualities and 499
sprinting performance. Journal of Sports Medicine and Physical Fitness, 35, 13–19. 500
501
Table 1: Ambient conditions for field testing for each sport.
Sport Temperature (˚C)
Humidity (%)
Air Pressure (hPa)
Wind (m/s)
Description
Basketball Day 1
18 54 1008 North (4.6)
Scattered Clouds Basketball
Day 2
12 82 1010 South (3.6) Haze
Cricket Day 1
17 58 1008 North (4.6)
Scattered Clouds Cricket
Day 2
12 82 1010 South (3.6) Haze
Football Day 1
19 46 1013 ENE (4.6)
Scattered Clouds Football
Day 2
13 58 1020 West (1.5)
Partly Cloudy
Hockey Day 1
18 54 1008 North (4.6)
Scattered Clouds Hockey
Day 2
Netball Day 1
18 54 1008 North (4.6)
Scattered Clouds Netball
Day 2
14 69 1010 SSE (3.1) Overcast
Rugby Day 1
17 53 1013 ENE (4.6)
Scattered Clouds Rugby
Day 2
12 67 1020 West (2.1)
Partly Cloudy
Note: Running direction was standardised as North West for sprints and South East
(before the change of direction) for the 5-0-5 test.
503
Table 2: Summary of day 1 and day 2 raw values, TE as a CV (90% confidence intervals in brackets) and SWC as percentages, TE:SWC ratio and usefulness (Hopkins, 2000) for each test.
Test Day 1 Day 2
TE as a CV
(%)
SWC
(%)
TE:SW
C ratio
Usefulness
IMTP (kg) 170.6 ± 45.5 170.9 ± 46.4 5.5 (4.5 - 6.9) 6.1 0.9 Good CMJ (cm) 34.4 ± 5.9 34.4 ± 6.4 2.8 (2.4 - 3.3) 3.9 0.7 Good 5 m (s) 1.08 ± 0.06 1.06 ± 0.06 2.7 (2.0 - 4.0) 1.1 2.5 Marginal 10 m (s) 1.82 ± 0.09 1.78 ± 0.11 2.5 (2.1 - 3.2) 1.1 2.3 Marginal 20 m (s) 3.19 ± 0.17 3.10 ± 0.19 2.2 (1.9 - 2.8) 1.1 2.0 Marginal 30 m (s) 4.45 ± 0.28 4.37 ± 0.28 2.2 (1.8 - 2.7) 1.3 1.7 Marginal 40 m (s) 5.75 ± 0.38 5.68 ± 0.42 1.8 (1.5 - 2.3) 1.4 1.3 Marginal 5-0-5 L (s) 2.54 ± 0.21 2.50 ± 0.22 4.1 (3.4 - 5.4) 1.7 2.4 Marginal 5-0-5 R (s) 2.49 ± 0.20 2.52 ± 0.25 5.4 (4.4 - 7.0) 1.8 3.0 Marginal IMTP = Isometric Mid Thigh Pull; CMJ = Countermovement jump; L = Left; R = Right
505
Figure 1: An example of the change in performance of an athlete over two tests using our 507
reliability data. Data are percentage change in performance (± TE as a CV as error bars). The 508
shaded grey area represents the SWC, which is the same for both tests. Although the 509
magnitude of improvement in performance is the same, the difference in the TE results in the 510
error bar overlapping the SWC for the 10 m split, leading to an inability to describe the 511
changes as "real" with 75% confidence. The error bar for the 20 m split does not overlap the 512
SWC however, resulting in a clear improvement in performance, with 75% certainty 513
(Hopkins, 2000). 514
515