www.ijsrp.org
features like, viewing the red, green and blue components of a color image separately, color detection and various other features (noise addition and removal, edge detection, cropping, resizing, rotation, histogram adjust, brightness control, etc.) that is used in a basic image editor along with object detection and tracking.
Keywords- Image processing toolbox, GUI, MATLAB, Bounding Box
I.INTRODUCTION
In this paper the authors presented a set of MATLAB applications useful for image processing[1][2] and color detection, each of which consists of user friendly graphical interface helpful for those not familiar with MATLAB programs running behind the image processor.
MATLAB based image processing[3] is a very convenient platform and very easy to construct an algorithm. An image is a matrix of pixel values. MATLAB considers every input as a matrix. For this reason MATLAB provides an easy tool for image processing as a user can easily access each and every pixel value from the image matrices and edit it. Moreover there is an ‘image processing tool box’ [4] built in MATLAB for this purpose.
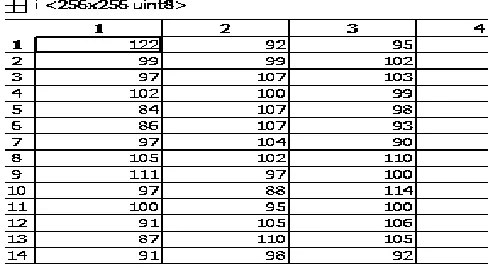
Mainly users deal with three types of image, hence three different matrices. Black and white or binary image matrix consists of only zero and one, one being the brighter portion and zero being the dark part. Generally images are 8bit and corresponding image matrix is 256x256.Gray scale image is also
[image:1.612.322.569.275.409.2]RGB image, three separate matrices for each red, green and blue components overlap to form a RGB image of 256x256x3 dimension. Since we are now well acquainted with image as a matrix, now any mathematical operations can be performed on an image that can be done with a matrix.
Figure 1: Gray scale image Matrix II.IMAGE EDITOR
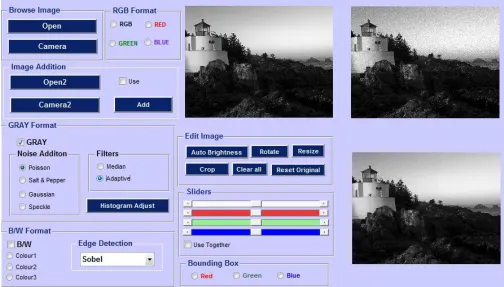
The image editor is created using the Graphical User Interface (GUI) [5][6] option available in MATLAB . The editor consists of three axis and the following options:
Browse image
Image input using camera
Image addition
www.ijsrp.org Figure 2: MATLAB GUI
o Noise addition
o Noise removal
o Histogram adjust
B/W conversion
o B/W to color image
o Edge detection
Auto brightness
Image rotate
Image Resize
Crop
Clear
Reset original
Sliders (4) to control brightness and R, G and B component.
Panel to view RGB format and each component
separately.
While creating the GUI, push button, slider, radio button, check box, pop-up menu, list box, panel and button group options available in MATLAB are used, (Figure. 2) Now each component is discussed separately.
A. Axis
Three axes are used in the GUI. The first axis is mainly for an input image. The second axis is mainly for any other effects on the original image (like after adding noise). The third axis is for the histogram or as in Figure 2 shows the image after removal of
the noise. According to Figure 2,
www.ijsrp.org
D. Gray Conversion
Gray conversion is done mainly to convert a RGB image (three dimensional matrix) to gray scale (two dimensional matrix) having pixel values ranging from 0 to 255.
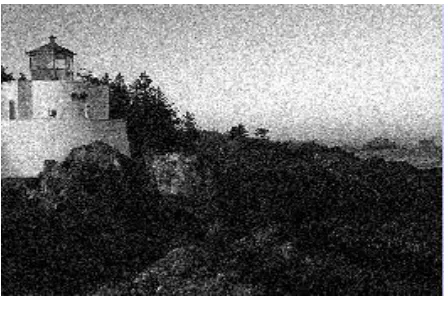
Noise Addition and Removal: Various types of noise get added to an image when a snapshot is taken. In order to get rid of these noises various types of filters are used. To illustrate this authors have added a noise to an image externally and then applied various filters to get rid of it and evaluated the results. Since noises are two dimensional and RGB images are three dimensional, dimensional mismatch has to be avoided while adding the noises. For this reason RGB image is converted to gray image and then noise addition and removal is performed.
[image:3.612.334.558.49.205.2]Noises can be of various types such as Poisson, Salt and pepper, Gaussian and Speckle. Median and adaptive filter are mainly in use. Figure 2 shows that Poisson noise has been added to the image in axis 1, and the noise added image is in axis 2 and after applying Adaptive filter to the image we get the filtered image as shown in axis 3.
Figure 4: Salt and Pepper noise added image
[image:3.612.334.557.218.372.2]Figure 5: Gaussian noise added image
Figure 6: Speckle noise added image
E. Black and White Image
Binary image (black and white) image is a two dimensional image with pixel values either 0(black) or 1(white).
1)Edge Detection: Edge detection technique is applicable only to binary images, so in case of an RGB or gray image it has to be first converted to a binary image and then edge detection technique has to be applied.
[image:3.612.56.280.506.657.2]www.ijsrp.org Figure 7: B/W conversion and edge detection( Sobel)
[image:4.612.348.562.48.251.2]The various types of edge detection techniques are: Sobel, Prewitt, Roberts, LoG, Zerocross and Canny. Figure 7 shows Sobel technique of edge detection.
Figure 8: Canny edge detection technique used
Figure 9: LoG edge detection technique used
F. Image rotate
[image:4.612.57.280.49.221.2]Image rotate is used to rotate the image to a specified degree. The command is ‘imrotate’.
Figure 10: Image rotation
Axis 1 is the actual image, axis 2 is the rotated image and the axis 3 shows the corresponding histogram.
G. Image Crop
Image cropping is used to select any particular portion of the whole image. The syntax is ‘imcrop’.
Figure 11: Image cropping
Axis 1 shows the actual image, axis 2 showing the crop portion and the intensity distribution of the cropped image is being shown on axis 3.
H. Image Resize
[image:4.612.53.285.296.440.2] [image:4.612.326.562.361.568.2] [image:4.612.54.283.467.614.2]www.ijsrp.org components individually and another for brightness. Our main
[image:5.612.347.544.50.198.2]aim was to control each component (red, green & blue) intensity and also brightness of the original image.
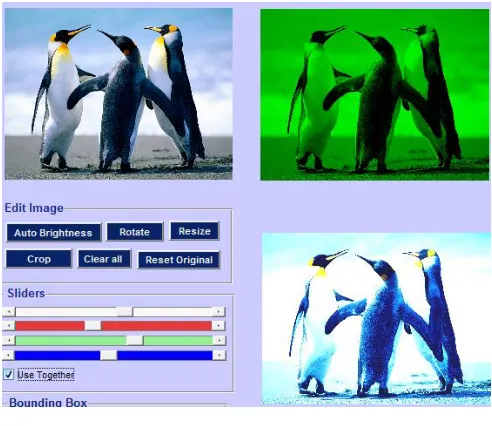
Figure 13: Sliders usage
The axis 1 is the original image, axis 2 shows a particular component change (here green) and the axis 3 is showing the result of it on the actual image.
J. RGB Format
[image:5.612.46.288.50.174.2]This RGB panel is used to view the red, green and blue componenst of the image separately. It has already been mentioned that an RGB image is overlap of three two dimensional matrix.
[image:5.612.350.544.218.375.2]Figure 14a: Red component
Figure 14b: Green component
Figure 14c: Blue component
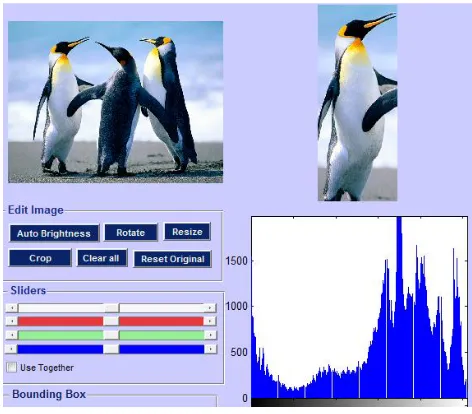
K. Histogram adjust
Generally for certain images the histograms are not equally spaced or rather they are clotted to a particular intensity, hence, making the image dull or too bright. For this reason various histogram adjustment techniques are being used. Some of the well-known histogram adjustment functions are ‘histeq’, ‘imadjust’ and ‘adapthisteq’.
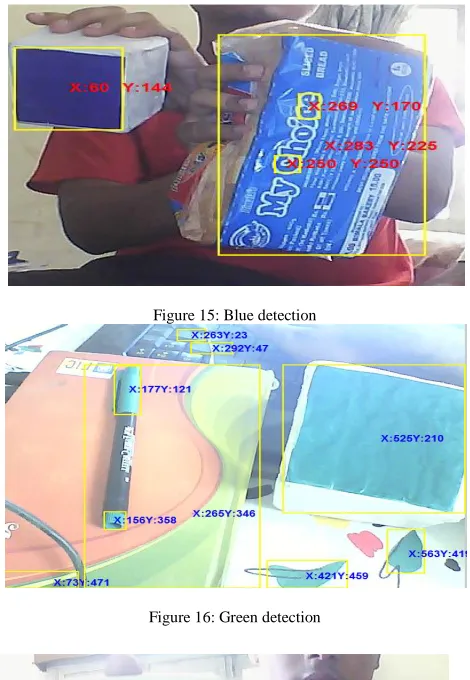
[image:5.612.45.291.248.461.2] [image:5.612.342.544.400.557.2]www.ijsrp.org The bounding box concept is used in MATLAB to identify either
the red, blue or green component of an image taken by the camera. It is a part of the ‘regionprops’ function[7].
‘REGIONPROPS’ measure different properties of a bounded image region, like area, axis and centroid.
Figure 15: Blue detection
[image:6.612.50.285.126.466.2]Figure 16: Green detection
Figure 17: Red detection
III. DISCUSSIONS AND CONCLUSION
Thus here various components of this MATLAB based image editor have been discussed. The authors have tried their level best to make the image editor as user friendly as possible. The purpose of the image editor is to bring the various image editing functions available in MATLAB tool box under one common platform and to make it easier for the understanding of any user. Future work can be aimed to expand the set of applications than what has been used here.
The authors have implemented the bounding box technique used in the image editor, to control the outputs of an Arduino and an ‘iRobot Create’ using color detection, which shall be illustrated in their next paper.
ACKNOWLEDGMENT
This work was supported by ESL (www.eschoollearning.net), Kolkata.
REFERENCES
[1] Rafael C. Gonzalez (University of Tennessee), Richard E. Woods (MedData Interactive) and Steven L. Eddins (The MathWorks, Inc.), in ‘Digital Image Processing Using MATLAB’ Second Edition,2009 by Gatesmark, LLC.
[2] Alasdair McAndrew, in ‘An Introduction to Digital Image Processing with Matlab, Notes for SCM2511 Image Processing 1’, School of Computer Science and Mathematics ,Victoria University of Technology.
[3] Justyna Inglot, ‘Advanced Image Processing with Matlab’, in Bachelor’s Thesis Information Technology, May 2012, Date of the bachelor's thesis 07.05.2010 ,Mikkeli University of Applied Sciences.
[4] http://www.mathworks.in/help/images/index.html [5] http://www.mathworks.in/discovery/matlab-gui.html [6]
http://www.mathworks.in/videos/creating-a-gui-with-guide-68979.html