ScholarWorks @ Georgia State University
Chemistry Dissertations Department of Chemistry
Spring 5-9-2016
Biochemical and Biophysical Studies of Heme
Binding Proteins from the Corynebacterium
diphtheriae and Streptococcus pyogenes Heme
Uptake Pathways
Elizabeth B. Draganova
Follow this and additional works at:https://scholarworks.gsu.edu/chemistry_diss
This Dissertation is brought to you for free and open access by the Department of Chemistry at ScholarWorks @ Georgia State University. It has been accepted for inclusion in Chemistry Dissertations by an authorized administrator of ScholarWorks @ Georgia State University. For more information, please contactscholarworks@gsu.edu.
Recommended Citation
Draganova, Elizabeth B., "Biochemical and Biophysical Studies of Heme Binding Proteins from the Corynebacterium diphtheriae and Streptococcus pyogenes Heme Uptake Pathways." Dissertation, Georgia State University, 2016.
THE CORYNEBACTERIUM DIPHTHERIAE AND STREPTOCOCCUS PYOGENES HEME
UPTAKE PATHWAYS
by
ELIZABETH DRAGANOVA
Under the Direction of Dabney Dixon, PhD
ABSTRACT
The Gram-positive pathogens Corynebacterium diphtheriae and Streptococcus pyogenes
both require iron for survival. These bacteria have developed sophisticated heme uptake and
transport protein machinery responsible for the import of iron into the cell, in the form of heme
from the human host. The heme utilization pathway (hmu) of C. diphtheriae utilizes multiple
proteins to bind and transport heme into the cell. One of these proteins, HmuT, delivers heme to
the ABC transporter HmuUV. The axial ligation of the heme in HmuT was probed by
examination of wild-type HmuT and a series of conserved heme pocket residue mutants, H136A,
H136 and Y235 are the axial ligands in HmuT. Electrospray ionization mass spectrometry was
also utilized to assess the roles of conserved residues in contribution to heme binding.
The S. pyogenes streptococcal iron acquisition (sia)/heme transport system (hts) utilizes
multiple proteins to bring host heme to the intracellular space. Both the substrate binding protein
SiaA and the hemoprotein surface receptor Shr were investigated. The kinetic effects on SiaA
heme release were probed through chemical unfolding of axial ligand mutants M79A and
H229A, as well mutants thought to contribute to heme binding, K61A and C58A, and a control
mutant, C47A. The unfolding pathways showed two processes for protein denaturation. This is
consistent with heme loss from protein forms differing by the orientation of the heme in the
binding pocket. The ease of protein unfolding is related to the strength of interaction of the
residues with the heme.
Shr contains two NEAT (near-iron transporter) domains (Shr-N1 and Shr-N2) which can
both bind heme. Biophysical studies of both Shr-N1 and Shr-N2 indicated a new class of NEAT
domains which utilize methionine as an axial ligand, rather than a tyrosine. Thermal and
chemical unfolding showed ferrous N1 and N2 to be most resistant to denaturation.
Shr-N2 was prone to autoreduction. Together, sequence alignment, homology modeling, and spectral
signatures are all consistent with two methionines as the heme ligands of this novel type of
NEAT heme-binding domain.
INDEX WORDS: Heme, Heme uptake, Heme transfer, Unfolding, Axial ligand, Denaturation,
THE CORYNEBACTERIUM DIPHTHERIAE AND STREPTOCOCCUS PYOGENES HEME
UPTAKE PATHWAYS
by
ELIZABETH DRAGANOVA
A Dissertation Submitted in Partial Fulfillment of the Requirements for the Degree of
Doctor of Philosophy
in the College of Arts and Sciences
Georgia State University
Copyright by
THE CORYNEBACTERIUM DIPHTHERIAE AND STREPTOCOCCUS PYOGENES HEME
UPTAKE PATHWAYS
by
ELIZABETH DRAGANOVA
Committee Chair: Dabney Dixon
Committee: Giovanni Gadda
Markus Germann
Electronic Version Approved:
Office of Graduate Studies
College of Arts and Sciences
Georgia State University
DEDICATION
I dedicate this dissertation to my loving and intelligent husband Alexander Draganov who
ACKNOWLEDGEMENTS
Much love goes out to my family, especially my father, James William Bennett, my
mother and stepfather, Nancy and Jeff Ingram, and sister, Emily Bennett, who have each helped
shape me into the person I am today. Their sacrifices and hard work to provide me with a life in
which not all people get to have is why I have had the drive and perseverance to achieve this
dream of mine. Knowing all of you believe in me keeps me going, even when I want to give up.
There are not enough words in the English language to express how sincerely grateful I
am for my advisor, mentor, and friend, Dr. Dabney W. Dixon. Her guidance and support has led
me to do great things during my career at Georgia State University; things that I never imagined
myself accomplishing before my time here. Her belief in my abilities as a scientist and a teacher
has always been, and will continue to be, the driving force for my next steps in my career.
I would also like to thank my dissertation committee members, Dr. Giovanni Gadda and
Dr. Markus Germann for their advice and expertise throughout the completion of my degree.
Additionally, I would like to thank my qualification exam committee members: Dr. Binghe
Wang, Dr. Giovanni Gadda, and Dr. Ivano Ivanov.
The work in our lab would not have been possible without our hard working
collaborators. Many thanks go out to Dr. Kenton Rodgers, Dr. Gudrun Lukat-Rodgers, and their
PhD student Seth Adrian at North Dakota State University for their long hours of hard work
completing the resonance Raman and time spent on the phone discussing our work; I learned an
amazing amount from those conversations. I would also like to thank our MCD collaborators at
the University of South Carolina, Dr. John Dawson and Dr. Daniel Collins. Not only did Dan
Lastly, but not least, I would like to thank the many friends I am grateful to have
surrounding me. Graduate school would not have been the same without Crystal, Rizvan, Jalisa,
Sarah Laughlin-Toth, Sarah Zingales, Zeus, and Tyler. Each of you helped me through this
journey in one way or another and I am forever grateful! To current and previous lab members,
you made working in the lab an enjoyable experience. To my undergraduate students I have had
the pleasure of mentoring (Brandford, Stephanie, Briana, Cyrianne, Tiffany, and Andrea); I will
never forget you as each of you hold a special place in my heart. Each of you taught me
something about myself and I wish you all the successes in life, although I have no doubt you
will each achieve everything you set your mind to. Endless thanks to Nydia, Katie, KP, Josh,
Susie, and Keri for cheering me on from back home. We have been through so much and have
TABLE OF CONTENTS
ACKNOWLEDGEMENTS ... v
LIST OF TABLES ... xviii
LIST OF FIGURES ... xix
1 INTRODUCTION ... 1
1.1 Iron and Heme in Bacteria ... 1
1.2 ABC Tranporters ... 1
1.3 Gram-negative Heme Uptake Pathways ... 2
1.3.1 Hemophore-mediated heme uptake ... 3
1.3.2 Heme transfer across outer membrane ... 4
1.3.3 Heme transfer across inner periplasmic membrane ... 5
1.4 Gram-Positive Heme Uptake Pathways ... 7
1.4.1 S. aureus Isd System and NEAT domains ... 7
1.4.2 Bacillus anthracis hemophore mediated heme uptake... 10
1.4.3 Heme uptake by S. pyogenes ... 11
1.4.4 C. diphtheriae heme uptake ... 12
1.5 References ... 14
2 Heme Binding by Corynebacterium diphtheriae HmuT: Function and Heme Environment ... 21
2.2 Introduction ... 22
2.3 Materials and Methods ... 25
2.3.1 Bacterial strains and media ... 25
2.3.2 Plasmid construction ... 25
2.3.3 Site-directed mutagenesis and hemoglobin-iron utilization assays ... 26
2.3.4 Expression and purification of CdHmuT ... 26
2.3.5 Magnetic circular dichroism spectroscopy ... 27
2.3.6 Resonance Raman spectroscopy ... 28
2.4 Results ... 29
2.4.1 Heme ligation in ferric HmuT ... 29
2.4.2 Conserved residues and the biological function of HmuT... 30
2.4.3 Spectroscopy of wild-type CdHmuT ... 31
2.4.4 Spectroscopy of M292A CdHmuT... 34
2.4.5 Spectroscopy of H136A CdHmuT ... 35
2.4.6 Spectroscopy of Y235A CdHmuT ... 36
2.4.7 Heme environment in CdHmuT ... 39
2.4.8 Ferric Y235A CdHmuT−fluoride ... 41
2.4.9 Ferrous Y235A CdHmuT ... 43
2.5 Discussion ... 43
2.5.2 Why tyrosine?... 46
2.6 Conclusions ... 48
2.7 Acknowledgments... 49
2.8 References ... 49
2.9 Supplemental Information ... 58
2.9.1 Supplemental Figures ... 58
2.9.2 Supplemental Tables ... 67
2.9.3 Supplemental References ... 69
3 Corynebacterium diptheriae Hmut: A closer look at conserved residues ... 73
3.1 Abstract ... 73
3.2 Introduction ... 74
3.3 Materials and Methods ... 76
3.3.1 Bacterial strains and media ... 76
3.3.2 Plasmid construction ... 76
3.3.3 Site-directed mutagenesis ... 77
3.3.4 Expression and purification of CdHmuT ... 77
3.3.5 Heme extraction and reconstitution studies ... 78
3.3.6 UV-visible absorption spectroscopy ... 79
3.3.7 Resonance Raman spectroscopy ... 79
3.3.9 Thermal Unfolding ... 80
3.4 Results and Discussion ... 80
3.4.1 Sequence alignment and homology modeling ... 80
3.4.2 UV-visible absorption spectroscopy and heme loading of HmuT mutants 82 3.4.3 Buttressing of the heme pocket by M292 ... 83
3.4.4 Thermal unfolding studies ... 84
3.4.5 Heme dissociation in the gas phase ... 86
3.4.6 The plasticity of the HmuT structure ... 88
3.5 Conclusions ... 91
3.6 References ... 91
3.7 Supplemental Information ... 95
3.7.1 Supplemental Figures ... 95
4 ADDITIONAL STUDIES ON THE CHARACTERIZATION OF C. DIPHTHERIAE HMUT ... 97
4.1 Experimental... 97
4.1.1 Expression and purification of HmuT and mutants ... 97
4.1.2 Optical spectroscopy ... 97
4.1.3 HmuT Y235A and M292A heme extraction ... 98
4.1.4 HmuT Y235A and M292A heme reconstitution ... 98
4.1.6 pH titrations of as-isolated and reconstituted HmuT Y235A ... 99
4.1.7 Chemical unfolding studies of HmuT ... 100
4.2 Results ... 101
4.2.1 Circular dichroism spectroscopy of HmuT and mutants ... 101
4.2.2 Reconstitution of Y235A and M292A ... 102
4.2.3 Electrospray ionization (ESI) mass spectrometry of HmuT mutants ... 104
4.2.4 pH titrations of as-isolated and reconstituted HmuT Y235A ... 111
4.2.5 Chemical unfolding studies of HmuT ... 113
4.3 Discussion ... 117
4.3.1 Circular dichroism of HmuT and mutants ... 117
4.3.2 ESI-MS of HmuT mutants ... 119
4.3.3 Protein reconstitution and heme loading... 120
4.3.4 pH titrations of as-isolated and reconstituted Y235A ... 121
4.3.5 Chemical unfolding studies of HmuT ... 122
4.4 References ... 124
5 HEME-BOUND SIAA FROM STREPTOCOCCUS PYOGENES: EFFECTS OF MUTATIONS AND OXIDATION STATE ON PROTEIN STABILITY ... 126
5.1 Abstract ... 127
5.2 Introduction ... 127
5.3.1 Homology modeling ... 131
5.3.2 Materials ... 132
5.3.3 Preparation of plasmids ... 132
5.3.4 Expression and purification of mutants ... 133
5.3.5 Heme loading ... 134
5.3.6 SiaA heme extraction and refolding ... 134
5.3.7 UV-visible absorption spectroscopy ... 135
5.3.8 Circular dichroism spectroscopy ... 135
5.3.9 Resonance Raman spectroscopy ... 135
5.3.10 Denaturation studies ... 136
5.3.11 Studies of unfolding rates ... 137
5.3.12 Spectrophotometric pH titrations ... 138
5.3.13 Reduction potential determination ... 138
5.4 Results ... 139
5.4.1 Spectroscopic studies ... 139
5.4.2 Guanidine-induced denaturation of WT SiaA and mutants ... 141
5.4.3 Spectrophotometric pH titrations ... 144
5.4.4 Resonance Raman spectra of ferric and ferrous SiaA mutants ... 145
5.4.5 Spectroelectrochemical titrations ... 147
5.5.1 Guanidinium-induced unfolding ... 149
5.5.2 The time-scale of protein unfolding ... 151
5.5.3 Spectrophotometric pH titrations ... 153
5.5.4 The effect of redox state ... 154
5.6 Conclusions ... 156
5.7 Acknowledgments... 156
5.8 References ... 157
5.9 Supplemental Information ... 165
5.9.1 Supplemental Figures ... 165
6 ADDITIONAL STUDIES ON THE CHARACTERIZATION OF S. PYOGENES SIAA 170 6.1 Experimental... 170
6.1.1 Expression and purification of SiaA and mutants ... 170
6.1.2 Heme extraction and refolding of SiaA ... 170
6.1.3 Optical spectroscopy ... 171
6.1.4 Stability of holo-SiaA and apo-SiaA ... 171
6.1.5 Denaturation of apo-SiaA via guanidinium hydrochloride ... 171
6.1.6 Denaturation of apo-SiaA via urea ... 172
6.1.7 Electrospray ionization (ESI) mass spectrometry ... 172
6.2 Results ... 173
6.2.1 Heme extraction and refolding of SiaA ... 173
6.2.2 Circular dichroism spectroscopy of holo- and apo-SiaA ... 174
6.2.3 Stability studies of holo- and apo-SiaA ... 175
6.2.4 Denaturation of apo-SiaA ... 178
6.2.5 Myoglobin and SiaA unfolding and desalting ... 182
6.2.6 ESI mass spectrometry ... 183
6.3 Discussion ... 184
6.3.1 Heme extraction and refolding of SiaA ... 184
6.3.2 Circular dichroism spectroscopy of holo- and apo-SiaA ... 185
6.3.3 Denaturation and stability studies of Holo- and apo-SiaA ... 186
6.3.4 D1/2 determination of myoglobin and holo-SiaA desalting ... 188
6.3.5 ESI mass spectrometry ... 190
6.4 References ... 191
7 THE FIRST HEME-BINDING NEAT DOMAIN OF SHR IN STREPTOCOCCUS PYOGENES ... 194
7.1 Abstract ... 194
7.2 Introduction ... 194
7.3 Materials and Methods ... 198
7.3.2 Construction, expression and purification of Shr-N1 and Shr-N1 K119A
198
7.3.3 Magnetic circular dichroism spectroscopy ... 200
7.3.4 Resonance Raman spectroscopy ... 200
7.3.5 Spectrophotometric pH titrations ... 201
7.3.6 Electrochemistry ... 201
7.3.7 Guanidinium hydrochloride (GdnHCl) denaturation studies ... 202
7.3.8 Thermal denaturation studies ... 202
7.4 Results ... 203
7.4.1 Sequence alignment and homology modeling ... 203
7.4.2 Molecular dynamics... 205
7.4.3 Oligomerization of Shr-N1 ... 206
7.4.4 Spectroscopic studies of Shr-N1 ... 207
7.4.5 Shr-N1 pH studies... 211
7.4.6 Electrochemistry ... 212
7.4.7 Unfolding studies of Shr-N1 ... 213
7.5 Discussion ... 215
7.5.1 Heme ligation ... 215
7.5.2 Electrochemistry ... 219
7.5.4 Unfolding Studies of Shr-N1 ... 220
7.5.5 Role of methionine in heme binding ... 221
7.6 References ... 223
7.7 Supplementary Information ... 232
7.7.1 Supplementary Figures ... 232
8 THE SECOND HEME-BINDING NEAT DOMAIN OF SHR IN STREPTOCOCCUS PYOGENES ... 235
8.1 Introduction ... 236
8.2 Materials and Methods ... 238
8.2.1 Homology modeling ... 238
8.2.2 Construction, expression, and purification of WT Shr-N2 and mutants . 239 8.2.3 Magnetic circular dichroism spectroscopy ... 240
8.2.4 Resonance Raman spectroscopy ... 240
8.2.5 Guanidinium unfolding studies ... 241
8.2.6 Thermal unfolding studies ... 242
8.2.7 pH titration – autooxidation and autoreduction studies ... 243
8.2.8 Electrochemistry ... 243
8.3 Results ... 244
8.3.1 Sequence alignment and homology modeling ... 244
8.3.3 Electrochemistry ... 253
8.3.4 pH titration – autooxidation and autoreduction... 255
8.3.5 Guanidinium and thermal unfolding studies ... 258
8.4 Discussion ... 259
8.4.1 Bismethionine axial ligation ... 259
8.4.2 Autoreduction ... 261
8.4.3 Unfolding studies and oxidation state ... 264
8.4.4 The mechanism of heme uptake... 264
8.5 References ... 266
9 GENERAL CONCLUSIONS ... 282
LIST OF TABLES
Table 2.1 pKa values of water trans to histidine in selected ferric heme proteins. The pKa of
ferrous microperoxidase 8 is reported as 10.9 (10)... 67
Table 2.2 Selected His/Tyr and Tyr heme-binding proteins with corresponding residues which are hydrogen-bonded to the axial tyrosine ligand. The examples are ordered by hydrogen bonding motif. ... 68
Table 3.1 Thermal unfolding Tm values of WT HmuT and mutants shown in Figure 3.4. ... 86
Table 4.1 DichroWeb CD estimated secondary structural deconvolution of HmuT and mutants. ... 102
Table 5.1 Forward and reverse primers for the mutants in this work. ... 133
Table 5.2 D1/2 unfolding rate constants and relative abundances for SiaA and mutants. ... 142
Table 6.1 Comparison of D1/2 values of b-type holo- and apo-hemoproteins. ... 189
Table 7.1 Optical absorption bands for proteins with one and two methionine ligands. Bands with the symbol “≈”were approximated from published spectra. The relative intensities (compared to the ≈ 530 nm band) for the ferric Q-bands are given. ... 217
LIST OF FIGURES
Figure 2.1 Model for heme uptake in C. diphtheriae. Arrows indicate the direction of hemin
transfer. It is proposed that hemin would transfer from Hb, a known hemin donor, to the
surface exposed hemin binding protein, HtaA, and be transferred to HtaB
(membrane-anchored protein) followed by HmuT (substrate binding protein). The hemin would then
be passed to the ABC transporter, comprised of HmuU (membrane-bound protease) and
HmuV (the ATPase), to bring the hemin into the cytosolic space. Alternatively, HtaA
could transfer hemin directly to HmuT. ... 24
Figure 2.2 I-TASSER homology model of CdHmuT displayed using PyMOL (93). Shown are
the locations of H136, Y235, R237, M292, and Y349. ... 30
Figure 2.3Hb-iron utilization assay. C. ulcerans CU77 (hmuT) carrying plasmids that encode the
wild type (pCD842) and various mutants of the hmuT gene were assessed for their ability
to use Hb as the sole iron source for growth in low-iron mPGT medium. Cultures were
grown for 36 h at 37 oC in the presence of 25 µg/ml Hb supplemented with 10 µM
EDDA, and then cell density was measured by absorbance at A600. Results are the mean
of three independent experiments ± standard deviation. The growth difference between
WT (pCD842) and Y235A is significant at p < 0.01. ... 31
Figure 2.4 UV-visible absorption spectra of the Fe(III) forms of WT CdHmuT (solid line),
H136A (dashed line), and Y235A (dotted line) normalized at the Soret. The samples
were taken in 50 mM Tris-Cl at pH 7.0. ... 32
Figure 2.5 The UV-visible absorption and MCD comparison spectra for Fe(III) WT CdHmuT at
phosphate buffer. Spectra were slightly dependent on buffer conditions. The spectrum of
phenol-bound leghemoglobin a was replotted from (38). ... 33
Figure 2.6 Comparison of the Soret-excited rR spectra of WT CdHmuT, M292A, H136A, and
Y235A. Protein concentrations were 80, 70, 25 and 36 μM, respectively. All samples
were prepared in 50 mM Tris-Cl at pH 7.0. The spectra were recorded with 406.7-nm
excitation. A) Low frequency and B) high frequency spectra of WT CdHmuT (blue),
M292A (black), H136A (green), and Y235A (red). ... 34
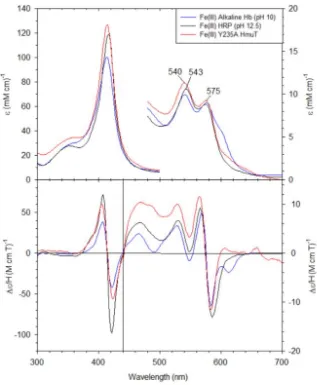
Figure 2.7 The UV-visible absorption and MCD spectra for Fe(III) Y235A CdHmuT at pH 10
with Fe(III) alkaline Hb (pH 10) and Fe(III) HRP (pH 12.5). The samples were prepared
in 50 mM phosphate buffer. The spectra of alkaline Hb and HRP were replotted from
(47) and (48), respectively. ... 37
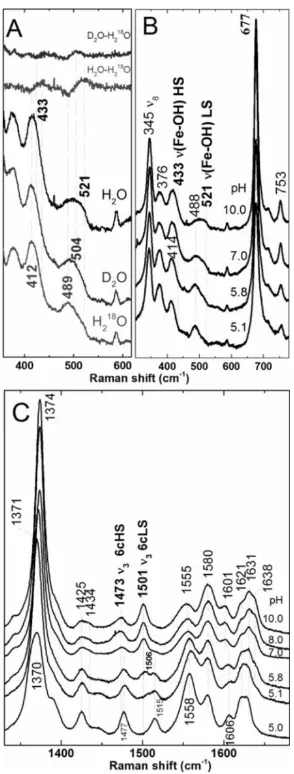
Figure 2.8 The pH dependence of ferric Y235A monitored by 406.7 nm-excited rR spectra (11
mW power at sample). A) Isotopologs of Y235A at pH 10 prepared in H2O, D2O, and
H218O. Difference spectra of D2O-H218O and H2O-H218O shown at the top of the figure
were generated by subtraction of the respective parent spectra at the bottom of the figure.
B) Low frequency and C) high frequency spectra of ferric Y235A as a function of pH.
Samples were between 25 and 60 μM. ... 38
Figure 2.9 Backbonding correlation plot of νFe-CO versus νC-O for ferrous carbonyls of heme
proteins showing the dependences of their positions on axial ligation and distal pocket
properties. WT (blue), H136A (green), Y235A (red) are shown as stars on the plot.
Catalase, hexagon; HasA(Y75A), ◊; HasA(WT), ○; HasA(H83A), ○; HasA(H32A), ○
(57;71). The dashed line is the least squares line for six-coordinate Fe−CO adducts in
line for Fe−CO adducts with proximal histidine (neutral imidazole) (53;57;59) (and
references therein); and the solid line represents a compilation of “five-coordinate” model
complexes (55) (and references therein) and heme proteins which the ligand trans to CO
is coordinated through an oxygen atom (61). ... 40
Figure 2.10 Characterization of Y235A−F by correlation of the FeIII−F stretching frequency and
CT1 energy. A) Low frequency window of the rR spectra of Y235A−F using Raman
excitation into the CT2 (441.6 nm) and Soret (406.7 nm) bands. Protein was 80 μM in
100 mM sodium phosphate buffer in 330 mM sodium fluoride, pH 5.8. Laser power at
the sample was 4.6 mW with 441.6-nm excitation and 9.7 mW with 406.7-nm excitation.
Peak fitting analyses of both spectra are overlaid on the original spectra with the
calculated FeIII−F stretching band shown in red; calculated
8 and propionate and vinyl
bending bands are shown in black; the overall fit is shown in magenta. Inset: Visible
spectrum of Y235A−F rR sample. B) Correlation plot of Fe-F frequency and the CT1
energy. Y235A is shown in red. Other points are from Nicoletti and coworkers (61).
Open circles are for mutants of truncated Hb from Thermobifida fusca (Tf-trHb) with
varying number of hydrogen bonds between the distal pocket and the fluoride (60;61). 42
Figure 2.11 S1 Alignment of the amino acid sequence of HmuT from various Corynebacterium
species. Species are designated as follows: Cd: C. diphtheriae 1737/NCTC13129; CU: C.
ulcerans 712; Cjk: C. jeikeium k411-jk0316; Cglut: C. glutamicum ATCC 13032; Curea:
C. urealyticum DSM 7109. Conserved residues that were subjected to site-directed
mutagenesis are indicated above the sequence alignment; asterisks indicate sequence
Figure 2.12 S2 Alignment of the amino acid sequence of CdHmuT with four HBPs with known
crystal structures. Square boxes indicate the known axial ligands. Orange: P. aeruginosa
PhuT (1) and S. dysenteriae ShuT (1). Green: S. aureus IsdE (2). Blue: Y. pestis HmuT
(3). Red: C. diphtheriae HmuT. For CdHmuT, M292 is also shown. ... 59
Figure 2.13 S3 Comparison of the UV-visible absorption and MCD spectra for Fe(III) WT
CdHmuT at pH 6.5 with Fe(III) bovine liver catalase (BLC) and H93Y myoglobin. ... 60
Figure 2.14 S4 The rR spectrum of ferric WT CdHmuT as a function of pH. A) Low frequency
window. B) High frequency window. Protein concentration was 40 μM; excitation
frequency of 413.1 nm was used with 9.4 mW laser power at the sample. The pH values
are as indicated with the buffers described in the experimental section. ... 60
Figure 2.15 S5 Top panel: UV-visible absorption spectrum of WT CdHmuT (black) and M292A
CdHmuT (red). The samples were taken in 50 mM Tris-Cl, pH 7.0. Bottom panel:
Comparison of the MCD spectra for Fe(III) M292A CdHmuT at pH 6.5 with Fe(III) WT
CdHmuT and Fe(III) phenol-leg Hb a. The samples were taken in 50 mM phosphate
buffer. The spectrum of phenol-leg Hb a was replotted from (8). ... 61
Figure 2.16 S6 The rR spectrum of ferric M292A as a function of pH. Protein concentration was
36 μM; 406.7-nm excitation with 11 mW at the sample was used. The spectrum of ferric
WT HmuT at pH 5.0 (red) is overlaid on the M292A pH 5.0 spectrum for comparison
purposes. Coordination state and spin state markers ν3, ν2 and ν10 appear at the same
frequencies in both spectra. The only noticeable difference between the WT and M292A
spectra is the 1537 cm−1 shoulder, which is assigned toν11 (the B1g, Cβ-Cβ stretching
Figure 2.17 S7 The UV-visible absorption and MCD comparison spectra for Fe(III) H136A
CdHmuT at pH 6.5. Bottom panel: Comparison of the MCD spectra for Fe(III) H136A
CdHmuT with Fe(III) WT CdHmuT, Fe(III) ShuT, Fe(III) H93Y Mb, and Fe(III) BLC.
All samples in the work were taken in 50 mM phosphate buffer. Spectra of H93Y, ShuT,
and BLC were replotted from (7),(9), and (4-6), respectively. ... 63
Figure 2.18 S8 The rR spectrum of ferric H136A as a function of pH. Protein concentration was
25 μM; 406.7-nm excitation with 11 mW at the sample was used. ... 64
Figure 2.19 S9 Resonance Raman spectra of the ferrous carbonyls of WT CdHmuT, H136A, and
Y235A recorded using 413.1-nm excitation. Natural abundance HmuT−CO (black),
HmuT−13CO (red) and difference (blue) spectra are shown for each protein. Spectra of
WT and H136A were recorded at pH 8.8 and that of Y235A at pH 8.2. The asterisks in
the carbonyl stretching region of the Y235A spectrum mark plasma emission lines from
the Kr+ laser. ... 64
Figure 2.20 S10 Comparison of the low frequency RR window of ferrous Y235A spectra
obtained with 413.1-nm and 441.6-nm excitation. Laser powers at the sample were 4.0
mW and 4.6 mW, respectively. The solutions were 38 μM in protein and 100 mM in
Tris-Cl, pH 8.8. ... 65
Figure 2.21 S11 The Fe−C stretching region of the Y235A-CO rR spectrum. The experimental
data for the natural abundance CO (black) and 13CO (burgundy) complexes are shown
with the peak fitting analysis of the 509/505 (magenta) and 491/488 cm−1 bands (red).
Band widths are 24 and 18 cm−1, respectively. The 466 cm−1 band is not 13C sensitive.
The simulated spectra are shown in blue; they are the sums of the fit peaks. The
abundance CO spectrum, is shown in green. The simulated 12CO−13CO difference
spectrum (blue) is the difference between the simulated spectra for the 12CO and 13CO
complexes. ... 66
Figure 2.22 S12 Thermodynamic cycle for heme binding and reduction... 66
Figure 3.1 I-TASSER homology model of HmuT and heme binding pocket. Shown are the
locations of H136 (axial ligand), Y235 (axial ligand), R237, Y272, M292, and Y349. .. 82
Figure 3.2 UV-visible absorption spectra of Fe(III) WT HmuT (blue), R237A (green), and
Y272A (red) normalized at the Soret. The α,β-peaks are labeled for R237A and Y272A.
Samples were recorded in 50 mM Tris-Cl, pH 7.0. ... 83
Figure 3.3 Backbonding correlation plot of νFe-CO versus νC-O for ferrous carbonyls of heme
proteins showing the dependences of their positions on axial ligation and distal pocket
properties. As-isolated WT (blue), reconstituted HmuT (pink), H136A (green), Y235A
(red), and M292A (purple) are shown as stars on the plot. Catalase, hexagon;
HasA(Y75A), ◊; HasA(WT), ○; HasA(H83A), ○; HasA(H32A), ○. The dashed line is
the least squares line for six-coordinate Fe−CO adducts in which the proximal ligand is
thiolate or imidazolate; the dotted line is the least squares line for Fe−CO adducts with
proximal histidine (neutral imidazole); and the solid line represents a compilation of
“five-coordinate” model complexes and heme proteins which the ligand trans to CO is
coordinated through an oxygen atom. ... 84
Figure 3.4 Fraction folded thermal unfolding titrations of WT HmuT (black triangles), H136A
(dark blues squares), Y235A (orange open diamonds), R237A (cyan open squares),
Y349F (green diamonds). Samples were in 50 mM potassium phosphate, pH 7.0. The
Tm values are in Table 3.1. ... 85
Figure 3.5 Electrospray ionization mass spectrometry detection of heme-bound WT HmuT (black
squares), H136A (blue diamonds), R237A (orange circles), Y272A (red triangles), and
M292A (green open squares) as a function of collision energy voltage. Holo-Y235A is
not detected in the MS due to minimal heme-loading. Samples were recorded in 50 mM
ammonium acetate, pH 6.8. ... 87
Figure 3.6 UV-visible absorption spectra of Fe(III) as-isolated (solid) and reconstituted WT
HmuT (dashed line) normalized at the Soret. Samples were recorded in 50 mM Tris-Cl,
pH 7.0. ... 90
Figure 3.7 High frequency resonance Raman spectra of Fe(III) as-isolated and reconstituted
HmuT. Spectra were excited with a 413.1 nm Kr+ ion laser. ... 90
Figure 3.8 S1 Sequence alignment of the HmuT amino acid sequence from various
Corynebacterium species. Conserved residues which were subjected to site-directed
mutagenesis are labeled: R237, Y272, M292, and Y349. ... 95
Figure 3.9 UV-visible absorption spectra of Fe(III) Y349A (dashed) and Y349F (solid line)
normalized at the Soret. Samples were recorded in 50 mM Tris-Cl, pH 7.0. ... 96
Figure 4.1 CD spectra of WT HmuT (purple), Y272A (blue), Y349A (red) and Y349F (green).
Samples were measured in 10 mM potassium phosphate, pH 7.0. ... 102
Figure 4.2 Normalized UV-visible absorption spectra of as-isolated Y235A (solid line) and
reconstituted Y235A (dashed line). Both samples are in 50 mM Tris-Cl, pH 7.0. ... 103
Figure 4.3 Normalized UV-visible absorption spectra of as-isolated M292A (solid line) and
Figure 4.4 Electrospray ionization mass spectrum in the positive mode of purified HmuT
H136A. ... 105
Figure 4.5 Electrospray ionization mass spectrum in the positive mode of purified HmuT
Y235A. ... 106
Figure 4.6 Electrospray ionization mass spectrum in the positive mode of as-isolated HmuT
M292A. Bottom panel: The deconvoluted region shows HmuT M292A at 36,268 Da and
36,886 Da, indicative of apo- and holoprotein, respectively. The predicted mass of the
apoprotein is 36,265 Da and 36,881 Da for the holoprotein. Samples were prepared in 50
mM ammonium acetate at neutral pH. ... 107
Figure 4.7 Electrospray ionization mass spectrum in the positive mode of reconstituted HmuT
M292A. Middle and bottom panels: The deconvoluted region shows HmuT M292A at
36,185 Da and 36,785 Da, indicative of apo- and holoprotein, respectively. The predicted
mass of the apoprotein is 36,265 Da and 36,881 Da for the holoprotein. Samples were
prepared in Nanopure water. ... 108
Figure 4.8 Electrospray ionization mass spectrum in the positive mode of purified HmuT
Y272A. ... 109
Figure 4.9 Electrospray ionization mass spectrum in the positive mode of purified HmuT R237A.
... 110
Figure 4.10 pH titration fit of as-isolated Y235A from pH 4 – 7. The data were fit using a
one-state pKa equation. The pKa is 6.3 ± 0.1. ... 111
Figure 4.11 UV absorbance spectra of as-isolated HmuT Y235A pH titration from pH 7 – 9.5.
Minimal change at the Soret and increase in the 280 and 380 nm bands indicate heme loss
Figure 4.12 UV-visible absorptionpH titration of reconstituted Y235A from pH 7 – 11
(accounted for dilution). Arrows indicate the change in absorbance as the pH was
increased. Inset: The data were fit best to a two-state pKa model. The pKa’s are 7.8 ± 0.1
and 10.6 ± 0.1. ... 113
Figure 4.13 WT HmuT GdnCl denaturation curve fit to a two-state protein unfolding model.
Samples were in 50 mM Tris-Cl, pH 7.0. The D1/2 is 2.0 ± 0.1 M. ... 114
Figure 4.14 Time-scale unfolding curve for WT HmuT in 2.0 M GdnCl for 24 h. The data were
fit to a first-order reaction scheme giving an unfolding fast phase rate of 0.011± 0.001
min-1. The sample was in 50 mM Tris-Cl, pH 7.0. ... 115
Figure 4.15 Time-scale unfolding curve for H136A HmuT in 1.5 M GdnCl. The data were fit to
a first-order unfolding reaction scheme giving an unfolding rate of 0.004 ± 0.001 min-1.
The sample was in 50 mM Tris-Cl, pH 7.0... 116
Figure 4.16 Time-scale unfolding curve for Y235A HmuT in 1.0 M GdnCl. The data were fit to
a first-order unfolding reaction scheme giving an unfolding rate of 0.007 ± 0.001 min-1.
The sample was in 50 mM Tris-Cl, pH 7.0... 116
Figure 5.1 Overview of the S. pyogenes Sia/Hts heme uptake pathway. ... 129
Figure 5.2 Homology model of SiaA. Shown are the locations of C47, C58, K61, M79, and
H229. ... 130
Figure 5.3 UV-visible absorption spectra of the Fe(III) forms of C47A, C58A, K61A, M79A,
H229A and WT SiaA normalized at the Soret. The solutions were in 50 mM Tris-Cl, pH
7.0... 140
Figure 5.4 CD spectra of holo-SiaA (solid line) and apo-SiaA (dashed). The spectra were
Figure 5.5 Time-scale unfolding of WT SiaA at the D1/2 (3.1 M GdnHCl). Data were taken in
50 mM Tris-Cl, pH 7.0. The data were fit using the sum of two exponential processes.142
Figure 5.6 Fraction of folded WT SiaA and mutants as a function of the concentration of
GdnHCl. Data from the titrations were fit via nonlinear least squares to a two state
unfolding model. Protein samples were in 50 mM Tris-Cl, pH 7.0... 143
Figure 5.7 Spectrophotometric pH titration of C47A, titrated with 1.0 M NaOH, in a buffer of 20
mM each CAPS, CHES and Tris-Cl. UV-visible absorption spectra are shown from pH
7.0 to 10.7. The inset shows the nonlinear least squares fit of the data at 409 nm to a
single pKa; the value was 9.22 ± 0.03. ... 145
Figure 5.8 Soret-excited rR spectra of ferric (top) and ferrous (bottom) K61A SiaA. ... 146
Figure 5.9 UV-visible absorption absorbance spectra of K61A SiaA during the course of the
spectroelectrochemical titration with dithionite. Spectral contributions from the dyes,
ferricyanide, ferrocyanide and dithionite ions have been subtracted from each spectrum to
show the clean isosbestic behavior of the system. The inset shows absorbance at the
Soret maximum for ferrous K61A SiaA (423 nm) as a function of cell potential (vs SHE
reference). The oxidative and reductive titration curves are superimposable and fitting to
a single Nernstian wave (Equation 4) yielded a midpoint potential of 61 ± 3 mV vs SHE.
Titrations were carried out in 50 mM Tris/Tris-Cl at pH 8.0, 100 mM NaCl. ... 148
Figure 5.10. Thermodynamic cycle of heme binding in SiaA. ... 155
Figure 5.11 S1 Unfolding of K61A SiaA at the D1/2 (2.5 M GdnCl). The protein was unfolded in
50 mM Tris-Cl, pH 7.0. The data were fit using the sum of a two exponential processes.
Figure 5.12 S2 Unfolding of C47A SiaA at the D1/2 (2.95 M GdnCl). The protein was unfolded
in 50 mM Tris-Cl, pH 7.0. The data were fit using the sum of a two exponential
processes. ... 165
Figure 5.13 S3 Unfolding of C58A SiaA at the D1/2 (2.42 M GdnCl). The protein was unfolded
in 50 mM Tris-Cl, pH 7.0. The data were fit using the sum of a two exponential
processes. ... 166
Figure 5.14 S4 GdnHCl unfolding of WT SiaA using a desalting column. The protein was
unfolded in 50 mM Tris-Cl, pH 7.0. The data were fit using a two-state model and gave a
D1/2 of 2.6 ± 0.1 M. ... 166
Figure 5.15 S5 Soret-excited rR spectra of ferric (top) and ferrous (bottom) C58A SiaA. ... 167
Figure 5.16 S6 Spectroelectrochemical titrations of WT SiaA. Normalized absorbance at the
Soret maximum for ferrous WT SiaA (424 nm) is plotted versus cell potential (vs SHE),
revealing electrochemical irreversibility of the Fe(III)|Fe(II) couple. The oxidative
titration curve (∆, blue) was best modeled by three Nernstian waves. Midpoint heme
potentials at 15 and 72 mV are shown by vertical red lines. The 72 mV potential is
somewhat uncertain in the oxidative curve due to the truncation of its small amplitude
wave at ~100 mV. A third, very negative, potential resulted from the fitting in order to
account for absorbance changes at the lowest cell potentials. This may be due to
dithionite absorbance in this potential range. The reductive titration curve (, green) was
well modeled by a single Nernstian wave having a midpoint potential of 68 mV. The 68
and 72 mV potentials are taken to represent the same reversible Fe(III)|Fe(II) couple,
which accounts for only ~40% of the heme during the titrimetric reoxidation. This
WT SiaA adopts a structure or conformation having a lowered potential of 15 mV. The
small fraction of the heme having the higher potential upon reoxidation suggests the
reduced conformer is kinetically slow to revert back to that of the ferric protein before
reduction. Titrations were carried out in 50 mM Tris at pH 8.0, 100 mM NaCl. ... 168
Figure 5.17 S7 Spectroelectrochemical titration of C58A. A solution of 2 μM SiaA C58A was
initially reduced, oxidatively titrated with ferricyanide to yield a midpoint potential of -96
±15 mV, reductively titrated with dithionite to yield a midpoint potential from global
analysis of 1±8 mV, and oxidatively titrated with ferricyanide to yield a midpoint
potential from global analysis of -120±1 mV. Titration curves at the indicated
wavelengths are shown below for each titration. This suggests that the redox behavior
for the protein is irreversible (similar to WT), and the oxidative potential is reproducible.
... 169
Figure 5.18 S8 Comparison of the A) S. pyogenes SiaA and B) S. aureus IsdE heme binding
sites. Images are displayed using PyMOL. The structure of IsdE was downloaded from
the Protein Data Bank (PDB ID: 2Q8Q)... 169
Figure 6.1 UV-visible absorption absorbance spectrum of apo-SiaA in PBS buffer, pH 7.4. The
apoprotein is represented by the peak maxima at 280 nm. The final apo-SiaA
concentration is 12 μM. ... 174
Figure 6.2 Normalized circular dichroism spectra of holo-SiaA (solid line) and apo-SiaA (dashed
line). Samples (10 μM) were recorded in 10 mM phosphate buffer, pH 7.0. ... 175
Figure 6.3 UV-visible absorption spectra of WT SiaA at 48 h time intervals (total time 228 h).
readings. Protein degradation is shown by the increase in the 280 nm band over time
indicated by the arrow. ... 176
Figure 6.4 Circular dichroism spectra of apo-SiaA over a 72 h period. The protein solution sat
covered in a cuvette at room temperature. A scan was taken every 24 h to monitor
changes. The sample was in 10 mM potassium phosphate, pH 7.0. The scans are as
follows: 24 h (blue), 48 h (red), and 72 h (green). ... 177
Figure 6.5 Normalized circular dichroism spectra of apo-SiaA from the previous figure. Spectra
are normalized at 208 nm. ... 178
Figure 6.6 Circular dichroism spectra of apo-SiaA samples at different GdnCl concentrations for
D1/2 determination. Samples are as follows: 0 M GdnCl (blue), 0.5 M GdnCl (purple),
1.0 M GdnCl (green), and 1.5 M GdnCl (red). Spectra were recorded in 10 mM
potassium phosphate, pH 7.0. All of the samples were incubated at room temperature for
16 h... 179
Figure 6.7 Circular dichroism spectra of apo-SiaA (8 μM) incubated for 2 h (blue) and for 16 h
(red) with 1.0 M GdnCl. Samples were recorded in 10 mM potassium phosphate, pH 7.0
and incubated at room temperature. ... 179
Figure 6.8 Circular dichroism spectra of 8 μM apo-SiaA in 0.5 M GdnCl after incubation at room
temperature for 16 h. Guanidinium was added either directly after preparation (blue)
(from Figure 6.7) or after standing at 4 °C for 24 h (red). ... 180
Figure 6.9 Circular dichroism spectra of an initial urea unfolding titration with apo-SiaA (2.0
μM). Samples were scanned in 10 mM potassium phosphate, pH 7.0. Urea concentrations
were from 0 to 2.8 M as follows: 0 M (dark blue), 0.75 M (red), 1.49 M (green), 2.2 M
Figure 6.10 Circular dichroism spectra of a urea-induced apo-SiaA (5.1 μM) unfolding titration.
... 181
Figure 6.11 Circular dichroism molar ellipticity at 222 nm versus urea concentration. ... 182
Figure 6.12 Electrospray mass spectrum of SiaA C47A. The sample was prepared in 50:50
acetonitrile:ammonium acetate and 0.1% formic acid. Top panel: charge distribution
spectrum. Bottom panel: The SiaA C47A peak is seen at 36,062 Da. The expected peak is
36,071 Da. ... 183
Figure 6.13 Electrospray mass spectrum of SiaA K61A. The sample was prepared in 50:50
acetonitrile:ammonium acetate and 0.1% formic acid. Top panel: charge distribution
spectrum. Bottom panel: The SiaA C47A peak is seen at 36,037 Da. The expected peak is
36,046 Da. ... 184
Figure 7.1 Alignment of the amino acid sequence of Shr-N1 with homologous proteins (selected
portions shown). The proposed Shr-N1 ligand positions (M22 and M107) are indicated
by the red triangles. The conserved Isd YXXXY heme binding motif is shown by the blue
box. The conserved 310 helix SXXXXY motif is shown by the green box. The orange box
shows the position of the β7 axial tyrosine from L. monocytogenes Hbp2-N2. ... 204
Figure 7.2 I-TASSER homology model of Shr-N1. Shown in magenta are the two proposed
heme axial ligands, M22 and M107. Nearby residues H116, Y117, and K119 are also
shown in blue, orange, and cyan, respectively... 205
Figure 7.3 The distance in Shr-N1 between the side chains of potential heme binding amino acids
and the heme iron center over time. ... 206
Figure 7.4 Size exclusion chromatography of Shr-N1.(A) The elution trace monitored at 280 nm.
absorption spectra of the three fractions: F1 (blue), F2 (red), and F3 (black). Shr-ntdN1
before SEC is shown in green. (C) SDS-PAGE of Shr-N1 before SEC and the SEC
elution fractions. All bands are around 60 kDa. The molecular weight of Shr-N1 is
expected to be 58 kDa. (D) Native-PAGE of the fractions and Shr-N1 before SEC. .... 207
Figure 7.5 UV-visible absorption absorbance spectra of ferric (solid line) and ferrous (dashed)
Shr-N1 in 50 mM Tris-HCl, pH 7.0. ... 208
Figure 7.6 MCD and UV-visible absorption spectra of Fe (III) Shr-N1 (red), H93G Mb bis-THT
(blue), and H93G Mb mono-THT (black) at pH 6.5. ... 209
Figure 7.7 Resonance Raman spectra of ferric Shr-N1 as a function of pH. Soret-excited (413.1
nm) spectra were recorded in the (A) low frequency and (B) high frequency regions.
Samples are 40 μM and prepared in 20 mM MES, 20 mM TAPS, 20 mM CAPS adjusted
to pH 6.25 (black), 8.0 (red), 9.4 (blue), and 11 (pink). The 6cLS and 5cHS bands are
labeled accordingly. ... 211
Figure 7.8 Spectrophotometric redox titration of N1. (A) Oxidative titration of ferrous
Shr-N1 with ferricyanide. The arrows indicate the direction of absorbance change. The *
indicates where the mediator dyes have absorbance. (B) Titration curves form global
analysis of the oxidative (▪) and reductive titrations (●) at 427 and 429 nm, respectively.
The midpoint potential is reversible with an oxidative Em = 230 ± 26 mV and reductive
Em = 260 ± 9 mV. ... 213
Figure 7.9 Fraction of folded ferric (diamonds) and ferrous (circles) Shr-N1 as a function of
GdnHCl concentration. The absorbance changes were monitored at 411 and 427 nm for
least squares to a two state unfolding model. Protein samples were in 50 mM Tris-HCl,
pH 7.0. ... 214
Figure 7.10 Normalized fraction folded of ferric Shr-N1 (diamond) and ferrous Shr-N1 (square)
as a function of temperature followed by UV-visible absorption absorbance. Data from
the unfolding were fit via nonlinear least squares to a two state unfolding model. Protein
samples were in 50 mM potassium phosphate, pH 7.5. In both the ferric and ferrous,
proteins were prone to denaturation after 60 °C. ... 215
Figure 7.11 S1 UV spectral comparison of Fe(III) WT Shr-N1 (solid line) and Fe(III) K119A
Shr-N1 (dashed line). Both samples were recorded in 50 mM Tris-Cl, pH 7.0 and
oxidized with potassium ferricyanide. ... 232
Figure 7.12 S2 Comparison of the MCD spectra for Fe(II) Shr-ntdN1 at pH 6.5 with mono-THT
(top panel) and bis-THT H93G Mb (bottom panel). Experiments were completed in 50
mM Tris-Cl buffer at 4˚ C. ... 233
Figure 7.13 S3 Resonance Raman spectra of ferric and ferrous Shr-ntdN1. Soret-excited (413.1
nm) spectra were recoreded for the ferric and ferrous forms. Samples were prepared in
20 mM Tris-Cl, pH 8, 0.1% glycerol. The ferric 6cLS, 5cHS, and ferrous 6cLS marker
bands are labeled accordingly. ... 234
Figure 7.14 S4 Comparison of the MCD and UV-visible spectra for Fe(II)-CO Shr-ntdN1 at pH
6.5 with Fe(II)-CO mono-THT H93G Mb. Experiments were completed in 50 mM
Tris-Cl buffer at 4˚ C. ... 235
Figure 8.1 Selected alignment of the amino acid sequence of S. pyogenes Shr-N2 with
homologous proteins. The proposed Shr-N2 ligand positions M26 and M136 are
the blue boxes. The conserved 310 helix SXXXXY/F motif is shown by the green box.
... 245
Figure 8.2 Selected alignment of the amino acid sequence of S. pyogenes Shr-N2 with Shr-N1
and Shp. The conserved methionine residues are shown in the red box and are the
previously determined heme axial ligands for Shp and Shr-N1 along with the proposed
ligands of Shr-N2. ... 246
Figure 8.3 I-TASSER homology model of Shr-N2. Shown in magenta are the two proposed
heme axial ligands, M26 and M136. Shown in cyan are the predicted lysine residues
involved in autoreduction (K29 and K57). ... 247
Figure 8.4 UV-visible absorption spectra of oxidized and reduced Shr-N2. Both samples were
recorded in 50 mM Tris-Cl, pH 7.0. ... 248
Figure 8.5 The UV-visible absorption and MCD spectra comparison of Fe(III) Shr-N2 with
Fe(III) H93G Mb mono-THT and Fe(III) H93G Mb bis-THT. Samples were taken in 50
mM phosphate, pH 6.5. ... 249
Figure 8.6 The UV-visible absorption and MCD spectra of Fe(III) Shr-N2 with Fe(III) H93G Mb
bis-THT and Fe(III) H93G Mb mono-THT at pH 10. Samples were taken in 50 mM
phosphate, pH 10. ... 250
Figure 8.7 Resonance Raman spectral comparison of as-isolated Shr-N2 (black), Fe(III) Shr-N2
(green), purified Shr-N1 (fraction 2, red), and purified Shr-N1 (fraction 3, blue). Samples
were prepared in 50 mM Tris-HCl, pH 8.0. ... 251
Figure 8.8 The UV-visible absorption and MCD spectra of Fe(II) Shr-N2 with Fe(II) H93G Mb
Figure 8.9 Resonance Raman spectral comparison of Fe(II) Shr-N2 (red), Fe(II) Shr-N1 (fraction
2, black), and Fe(II) Shr-N1 (fraction 3, blue). Samples were prepared in 50 mM
Tris-HCl, pH 8.0 and reduced with 100-fold excess reducing equivalents of dithionite. ... 253
Figure 8.10 Redox potential titration of Shr-N2. A mediator cocktail (10 μL of each dye) that
covered the potential range from 50 – 300 mV was titrated to the sample through two
oxidative and reductive cycles. This restricted range has the advantage of minimizing
absorbance changes due to mediators. The oxidative and reductive titration data sets are
shown in the top panel. The bottom panel shows the absorbance at the reduced Soret
maximum (428 nm) as a function of potential for both cycles. ... 254
Figure 8.11 pH titrations of Shr-N2.A) NaOH titration of Fe(II) Shr-N2. (B) The second NaOH
titration titration. ... 256
Figure 8.12 pH titration of Shr-N2 in 20 mM each CAPS, MES, and Tris-HCl at 4 oC monitored
by UV-visible absorption spectroscopy. (A) After equilibration in each step. (B)
Equilibration between step 1 and step 2 in panel A at 1 h intervals. ... 257
Figure 8.13 GdnCl unfolding of oxidized (black diamonds) and reduced (red squares) Shr-N2 in
50 mM Tris-Cl, pH 7.0. ... 258
Figure 8.14 Thermal unfolding of oxidized (black squares) and reduced (red diamonds) Shr-N2
in 50 mM potassium phosphate, pH 7.0. ... 259
1 INTRODUCTION
1.1 Iron and Heme in Bacteria
Iron is an essential nutrient for the majority of living organisms to survive (1, 2). This
element is found in the ferric and ferrous oxidation states when at standard physiological
conditions. The broad redox potential of iron allows for iron-bound proteins to play a diverse
role in biological processes such as energy transducing pathways, gene regulation, and dioxygen
transport (3). Ferrous iron is soluble at physiological pH, unlike ferric iron, and can undergo
Fenton chemistry which converts ferrous iron and hydrogen peroxide to ferric iron and reactive
oxygen species (1, 4, 5). Excess free iron in the cell results in a buildup of reactive species
which attacks various cellular components and lead to oxidative damage to the cell (3, 6).
Nature has overcome this problem by placing iron in a protoporphyrin IX ring, thus creating the
macromolecule heme (3, 7). Commonly, human host heme is bound to proteins such as
myoglobin (Mb), hemoglobin (Hb), haptoglobin (Hp), and hemopexin (1, 2, 6). As a result,
bacteria have developed various strategies to either synthesize heme or take up the host heme
into the bacterial cytoplasm to be used as a nutritional source. It has also been shown that some
bacterial species utilize both strategies (8). Pathogenic bacteria which rely on heme uptake have
developed sophisticated machinery to obtain the heme using proteins in their cellular membranes
(4, 5, 9).
1.2 ABC Tranporters
ABC transporters make up a class of integral membrane proteins that utilize energy
provided by ATP to pump various compounds across cellular membranes (10-12). These
proteins are found in a wide variety of organisms and participate in import and export
and eukaryotic cells (12). In prokaryotes, the transporter is generally located at the plasma
membrane with ATP hydrolysis on the cytoplasmic side. Eukaryotes also have ABC transporters
in organellar membranes.
A general ABC transporter is made of two transmembrane (TM) modules and two
ATP-binding cassettes [otherwise known as nucleotide ATP-binding domains (NBDs)]. Import type ABC
transporters are commonly found in prokaryotic systems and are responsible for bringing
nutrients, sugars, and amino acids into the cell (13). Importers contain a substrate binding
protein which brings the substrate to the ABC transporter (11, 13). The importer TM modules
and ATP-binding cassette domains are generally encoded on different genes (11). Exporters are
commonly found in eukaryotic systems, and in some prokaryotic systems, and are responsible
for pumping out drugs and toxins from the intracellular space (13). Unlike importers, exporter
functional domains are encoded on a single gene (10, 13, 14).
Currently, four classes of ABC transporters have been identified based on TMD fold
(12). Three of the four classes are importers which are found only in prokaryotes: Type I, Type
II, and energy coupling factor (ECF) transporters (also referred to as Type III transporters). The
fourth class is the exporter fold which is identified in all characterized exporters to date and is
found in both prokaryotes and eukaryotes. Type I and II importers rely on SBDs to bring the
substrate to the TMDs. In some instances, the SBD is fused to the TMD. Although differences
exist in regards to overall fold of these importers, bacterial heme uptake pathways rely on ABC
importers to deliver heme to the cell (2, 3, 9).
1.3 Gram-negative Heme Uptake Pathways
Heme uptake systems exist in both Gram-negative and Gram-positive bacteria and many
the two types of bacteria, these pathogens have developed different strategies to bring heme to
the intracellular space using protein shuttles including ABC importers. The most widely studied
group of pathogenic heme uptake pathways are that of Gram-negative bacteria (5). These
pathogens must transport heme through the outer membrane (OM) to the periplasmic space and
then through the periplasmic membrane to reach the intracellular space (2, 3). Two types of
heme uptake systems have been identified for Gram-negative bacteria: hemophore secretion and
direct binding of host heme to OM receptors (15).
1.3.1 Hemophore-mediated heme uptake
Two types of hemophore systems have been identified in Gram-negative bacteria: has
(heme acquisition system) and hxu (heme/hemopexin utilization) (2, 17, 18). Multiple bacterial
species have shown to utilize the has system including Yersinia pestis, Serratia marcescens,
Yersinia enterolitica, Pseudomonas aeruginosa, and Pseudomonas fluorescens. The has operon
encodes for multiple proteins and includes the hemophore HasA, which is secreted from the cell,
scavenges heme from Hb, and delivers it to the OM receptor HasR. HasA from S. marcescens
and P. aeruginosa bind heme utilizing a histidine/tyrosine binding motif (H32/Y75) while Y.
pestis HasA uses a single tyrosine (Y75) to bind the heme in a pentacoordinate fashion. In all
species of characterized HasA, studies have shown an additional conserved histidine (H83)
which hydrogen-bonds to the axial tyrosine. Once heme is brought to the OM receptor, the heme
is transferred to the periplasmic space where it binds to periplasmic heme binding proteins.
HxuA from Haemophilus influenzae is another hemophore which is able to scavenge
heme by forming a complex with hemopexin (18). HxuA, along with the heme receptor HxuC,
an exception to other known hemophores in that HxuA is not able to bind heme although it has
been shown it is essential for heme uptake and transfer.
Mycobacterium turberculosis (Mtb)has also been identified as bacteria which utilizes a
hemophore system although Mtb is not classified as either Gram-negative or positive since it
does not have the same membrane chemical aspects seen in either type of bacteria (19). Mtb
uses the hemophore Rv0203 to scavenge heme from Hb (2, 18). This protein differs from other
hemophores in fold, yet is thought to utilize a similar His/Tyr binding motif as seen in HasA.
Rv0203 delivers heme to the heme receptors MmpL11 and MmpL3 which then pass the heme to
MhuD for degradation (2).
1.3.2 Heme transfer across outer membrane
Once heme has reached the OM, either by a hemophore or received by an OM heme
receptor directly, the heme must be transported across the membrane (2, 3, 15, 17, 18). Energy
to complete this transfer is coupled with bacterial proton motive force in conjunction with an
inner membrane complex, TonB/ExbB/ExbD, also known as the TonB box (2, 18). The majority
of known OM heme receptors are members of the TonB-depedent outer transporter (TBDT)
family and utilize the energy from the TonB box to bring heme across the membrane into the
periplasmic space (15). These transmembrane proteins are comprised of a closed β-barrel
structure and made of 22 antiparallel β-sheets (3). Most commonly these receptors recognize
and bind host Hb and hemoglobin-haptoglobin (Hb-Hp) (2, 3).
Although over 30 OM heme receptors have been reported, the only crystal structure
determined is of apo-ShuA from Shigella dysenteriae which has been shown to recognize host
methemoglobin and binds heme using two histidines, H86 and H428 (2, 3). Other bis-histidine
Porphyromonas gingivalis HmuR, S. marcescens HasR, and Y. enterocolitica HemR (2, 15).
Once the heme is passed through the OM receptor, the heme is transferred to periplasmic binding
proteins (PBPs) which work alongside ABC importers to bring heme into the cell. The exact
mechanism of the transfer from the OM the periplasmic membrane is still unknown (3).
1.3.3 Heme transfer across inner periplasmic membrane
Gram-negative PBPs receive heme from OM receptors and deliver the heme to ABC
transport systems within the periplasmic membrane to bring heme into the cell (2). Only a few
Gram-negative PBPs have been studied including S. dysenteriae ShuT, P. aeruginosa PhuT, and
Y. pestis HmuT (YpHmuT).
1.3.3.1 S. dysenteriae ShuT and P. aeruginosa PhuT
ShuT and PhuT are protein homologs with about ~35% sequence identity (2). PhuT/ShuT
both utilize a conserved tyrosine residue to coordinate one heme molecule (20). The proteins
share a similar fold although there are differences in the heme pocket environment (2). In the
PhuT heme binding site, a R73 is in position to H-bond to the axial tyrosine while this residue is
replaced by a lysine pointing away from the axial tyrosine in ShuT. The heme propionates in
ShuT are pointed inside the protein while PhuT heme propionates are oriented outside of the
heme pocket. The mechanism of ShuT/PhuT heme binding and release is yet to be determined.
Both ShuT and PhuT deliver heme to the inner membrane ABC transporter. Only the S.
dysenteriae shuttle ShuUV has been studied (2). Due to the nature of ABC transporter proteins,
(membrane-bound) these studies were carried out in liposomes. The study was performed using
ShuT, ShuUV, and ShuS (cytoplasmic-binding protein), and ATP. The cytoplasmic-binding
proteins in Gram-negative bacteria are thought to degrade heme once through the periplasmic
through the shuttle required all of the listed proteins and ATP, indicating heme transfer from
ShuUV to ShuS, and ATP binding and hydrolysis, are coupled. Additionally, E74 and E207
were required for appropriate binding of holoShuT with ShuU.
1.3.3.2 Y. pestis HmuT
YpHmuT binds heme using a His/Tyr axial ligand pair (21). This protein delivers heme to
the HmuUV ABC transport system to be brought into the cellular space. HmuT contains two
lobes, similar in structure, which are connected by a single backbone α-helix, a common feature
among periplasmic heme binding proteins. A crystal structure of holo-YpHmuT showed the
heme pocket to be larger than both ShuT and PhuT with two stacked hemes bound in the pocket
(2). The propionate groups of the hemes were arranged in such a way that the propionates from
one heme molecule were pointing outside of the protein, while the propionates from the other
heme were pointing inward. Isothermal titration calorimetry experiments showed the protein to
bind the heme in a 2:1 molar ratio confirming the structural finding. Similar to PhuT, YpHmuT
also has an arginine in enough proximity to H-bond to the axial tyrosine although the
hydrogen-bonding has not been directly observed.
YpHmuT delivers heme to the HmuUV ABC transporter (2, 21, 22). The crystal structure
of HmuUV has been determined (22). The structure reveals a conserved H142 in HmuU and a
conserved Y93 in HmuV. It has been proposed the heme could be bound by either both of these
residues, or only one, during heme transfer (2). Similar to ShuT, YpHmuT contains two
conserved glutamic acid residues which are thought to participate in docking of YpHmuT to
1.4 Gram-Positive Heme Uptake Pathways
Contrary to Gram-negative bacteria, Gram-positive cells have a thick peptidoglycan layer
composed of proteins, teichoic acids, and carbohydrates (18). Heme can either bind to surface
receptor proteins to be shuttled through the membrane to an ABC transporter, or be scavenged by
hemophores and then shuttled through the membrane (2, 3, 18). The most commonly studied
Gram-positive heme uptake and transfer systems are Staphylococcus aureus, Bacillus anthracis,
Streptococcus pyogenes, and Corynebacterium diphtheriae. The focus of this dissertation will be
on heme uptake in S. pyogenes and C. diphtheriae.
1.4.1 S. aureus Isd System and NEAT domains
S. aureus utilizes the iron-responsive surface determinant (Isd) system heme uptake
pathways and is the most extensively studied Gram-positive shuttle. The Isd system is composed
of nine proteins, most of which have been structurally determined or characterized (2, 23).
Four of the nine Isd proteins function as cell wall anchored surface receptors and are
classified as NEAT-containing proteins: IsdA, IsdB, IsdC, and IsdH. NEAT (near iron
transporter) domains are a group of conserved residues, about 125 amino acids long, which are
rich in beta-strands, contain a 310 α-helix and bind heme (2, 24). NEAT proteins have been
shown to utilize the YXXXY heme binding motif in which the first tyrosine in the sequence is
the heme axial ligand and the second tyrosine H-bonds to the first. The number of NEAT
domains in a protein can vary and not all NEAT domains with this motif have been shown to
bind heme. Additionally, these proteins also utilize a SXXXXY/F motif which assists in the
stabilization of the bound heme. The serine extends from the beginning of the 310 α-helix and
hydrogen bonds to one of the heme propionates while the tyrosine or phenylalanine at the end of
Numerous kinetic heme transfer studies have shown the Isd uptake pathway to proceed
via transfer between various partners (2, 25, 26). IsdB and IsdH are the most exposed to the
extracellular surroundings and can both remove heme from Hb or Hb-Hp, respectively, and can
transfer to either IsdA or IsdC. IsdC then transfers heme to the substrate binding protein IsdE.
The ABC transporter IsdDF brings the heme into the cellular space. Once passed through the
transport system and into the cytoplasm, IsdG and IsdI degrade the heme and release the iron for
use by the organism (8).
1.4.1.1 IsdB
IsdB is exposed to the S. aureus extracellular surroundings and transports host heme to
IsdA (23, 27, 28). IsdB contains two NEAT domains, IsdB-N1 and IsdB-N2, numbered from
N-terminus to C-N-terminus. It has been shown IsdB-N1 can bind to Hb, but is not able to bind heme.
In contrast, IsdB-N2 can bind heme, but not Hb (28). IsdB-N2 has the canonical YXXXY heme
binding motif as seen in other NEAT proteins. The IsdB-N2 domain alone is capable of
transporting heme to IsdA, but transfers at a faster rate when the full construct IsdB construct is
present.
The crystal structure of heme-bound IsdB-N2 showed an eight-stranded β-sandwich fold
similar to that in IsdA and IsdC (28). Distinct from other Isd NEAT domains, there is an α-helix
at the C-terminus following the eighth β-strand. Y440coordinates the heme iron in the fifth
position and hydrogen bonds with the phenol group of Y444. IsdB-N2 is an exception to the
simple tyrosine ligation of other Isd NEAT proteins. The crystal structure shows it utilizes a
five-coordinate Tyr/Met ligation system while spectroscopic studies indicate the protein exists as
to heme binding, particularly Y440A, Y444A, S361A, and M362L, showed that binding of heme
was disrupted.
1.4.1.2 IsdH
S. aureus IsdH, also referred to as HarA, is responsible for the uptake of heme from Hb,
Hp, and Hb-Hp complexes (29, 30). IsdH contains three NEAT domains, each with different
binding functions. IsdH-N1 and IsdH-N2 bind Hb, Hp, and Hb-Hp complexes, but not heme,
while IsdH-N3 binds either single or multiple hemes (23, 29-31).
The crystal structure of holo IsdH-N3 displays similar structural fold as seen in all other
NEAT proteins including eight β-strands (30). A single tyrosine residue, Y642, coordinates the
ferric heme in a five-coordinate fashion with Y646 hydrogen-bonding to the axial Y642. The
heme propionate groups form hydrogen bonds with S563 and Y646 in the heme pocket. The
double mutant Y642A/Y646A resulted in diminished ability of heme-binding.
1.4.1.3 IsdA
IsdA retrieves heme from extracellular proteins IsdB and IsdH and delivers heme to IsdC
(23). IsdA contains one NEAT domain which is capable of binding heme. The crystal structure
of holo-IsdA NEAT shows the domain is similar in fold to other NEAT proteins, consisting of
eight β-strands (27). The heme iron has a five-coordinate ligation with Y166 as the axial ligand
hydrogen-bonded to Y170 (27, 32). Reduction of IsdA results in a heme ligand switch with H83
serving as the axial ligand rather than Y166 (27, 32-34). Reoxidation yielded the original ferric
heme with tyrosine as the proximal ligand.
Spectroscopic studies of point mutations further demonstrated the participation of
specific amino acids in the binding of heme in ferric IsdA (27). Y166A and Y170A both result