Testing of the Technology Acceptance Model in Context of Yemen
Yaser Hasan Al-Mamary
1Alina Shamsuddin
21,2 Faculty of Technology Management and Business, Universiti Tun Hussein Onn Malaysia, 86400 Malaysia
[email protected]/ [email protected]
Doi:10.5901/mjss.2015.v6n4s1p268
Abstract
Recently, the technology acceptance model (TAM) has been widely used by researchers in order to gain a better understanding of the factors that affect on acceptance of technology. Technology Acceptance Model is one of the most common models in field of acceptance of the technology. Technology Acceptance Model has been tested in North America, but the factors that effect on acceptance of technology may be different in diverse cultural and social contexts. This paper test the technology acceptance model in context of telecommunication companies in Yemen. Where, test the model with different data set help to generalization of the model. The questionnaire used to collect primary data. The 269 completed questionnaires were received from the companies. This study test the model by using structural equation modeling techniques. The study found that, three of the hypotheses are supported. This means that technology acceptance model useful in context of Yemen.
Keywords: Testing, Technology Acceptance Model, Context of Yemen, Structural Equation Modeling.
Introduction 1.
Successful adoption of the technology in organizations assisted in automating tasks. Automation can save time, money, resources, reduce employee’s staff, and enhance organizational workflow. The majority of Arab countries especially in Yemen are still dealing with issues related to acceptance of the technology. The use of the technology in organizations helps to increases organization profitability, system increases organization market value, increases organization competitive advantage, reduces operational costs, enhance the revenue, and Overall, affect on the performance, thus, the revenues of these companies will increase and will have a positive role in improving the country's economy.
According to Al-Mamary et al (2015a) organizations invest in information technology and systems because they provide economic value to the business. While recognizing the importance of the technology in the organization, the majority of Arab countries in Middle East and underdeveloped countries are still dealing with issues in adopting the technologies. According to OBrien & Marakas (2007) information technologies is playing vital and expanding roles in business. Information technology can help all kinds of businesses improve the efficiency and effectiveness of their business processes, managerial decision making, and workgroup collaboration, which strengthens their competitive positions in rapidly changing marketplaces. According to Al-Mamary et al (2015b) the use of the technology has become necessary for any organization to improve efficiency, productivity , and improve performance in general.
Literature Review 2.
2.1 Acceptance of The Technology
The managers must be aware that there are many factors help to acceptance of the technology in organizations. According to K. Schaper & P. Pervan (2007) factors such as altruism, individual commitment to the organization and motivation were identified as contributing to the acceptance of the technology. According to Davis (1989) perceived usefulness and perceived are the main factors the affect on the acceptance of the technology.
2.2 Technology Acceptance Model
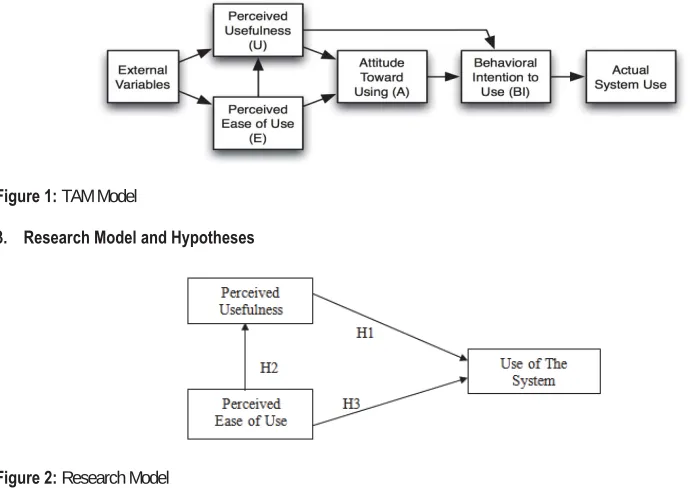
The Technology Acceptance Model, developed by Davis et al. (1989) was one of the most influential research model in studies of the determinate of information systems and information technology acceptance to predict intention to use and accept the information systems and information technology by individuals. In the Technology Acceptance Model, there are two determinants including perceived ease of use and perceived usefulness (Chen et al., 2011).
Perceived usefulness was defined by Davis et al. (1989) as "the degree to which a person believes that using a particular system would enhance his or her job performance". People tend to use or not to use an application to the extent they believe that it will help them to perform their job better. Perceived usefulness explains the user's perception to the extent that the technology will improve the user's workplace performance.
Meanwhile perceived ease of use is defined as "the degree to which a person believes that using a particular system would be free from effort". Users believe that a given application is useful, but they may, at the same time, believe that the technology is too hard to use and that the performance benefits of usage are outweighed by the effort of using the application. Perceived ease of use explains the user's perception of the amount of effort required to utilize the system or the extent to which a user believes that using a particular technology will be effortless (Davis et al., 1989). According to Legris et al. (2003) perceived ease of use is measured by learning to operate is easy for me, easy to get what I want to do, rigid and inflexible to interact with, and overall easy to use.
In summary TAM identifies two main variables for the successful adoption of the technology, and these variables are perceived usefulness, and ease of use. The model mainly focuses on the technical side only. Note that acceptance of the technology in some cases need top management support to encourage the end user to accept the technology or need training or self-efficacy etc. Therefore, there are several aspects to encourage the end-user to accept the technology. Hence, the knowledge gap is the model which is not identified in all the factors that lead to the successful adoption and acceptance of the technology in organizations.
Figure 1: TAM Model
[image:2.482.45.390.321.565.2]Research Model and Hypotheses 3.
Figure 2: Research Model
The followings are the research hypotheses that this study seeks to proof :
Instrument Design and Measures
4.
The questionnaires are divided into 4 parts with a total of 21 questions. The questionnaire in section A is about demographic of respondent. The questionnaire in section B is about perceived usefulness. The questionnaire in section C is about perceived ease of use. Lastly, the questionnaire in section D is about system use.
[image:3.482.42.437.162.280.2]The items that used to measure each of the latent variables in the study are summarized in Table 1.
Table 1: Examples of Success Measures – Perceived Usefulness, Perceived ease of use, and System Use
Perceived Usefulness Measures Perceived ease of use Measures System Use Measures
1. Using the system in my job enables me to
accomplish tasks more quickly. 1. Learning to operate the system is ease for me. 1. help to make decisions.
2. Using the system improves my job
performance. 2. I find it easy to get the system to do what I want I to do 2. help to record the information
3. Using the system in my job increases my
productivity . 3. I t is easy for me to remember how to perform tasks using the system 3. help to communicate with colleagues 4. Using the system enhance my effectiveness on
the job. 4. I find it takes a lot of effort to become skillful at using the system 4. help to share the general information 5. Using the system makes it easier to do my job. 5. Overall, I find the system easy to use 5. help to share the specific
information 6. Overall, I find the system useful to my job.
Sampling and Profile 5.
The population for this study is the employees in telecommunication companies in capital of Yemen (Sana'a). The type of sample techniques used in this study was a purposive sample. The questionnaire was distributed to selected departments of telecommunications companies, and the researcher collected the questionnaires directly from the companies. A total of 275 questionnaires were returned out of 300 distributed. There were 6 incomplete questionnaires that were discarded. Therefore, only 269 questionnaires were used for data analysis, which represented a response rate of 89.66% of the original sample.
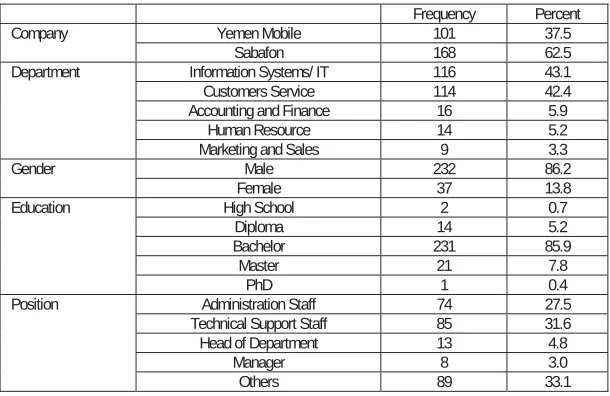
Table 2 presents the demographic profile of the respondents who participated in this survey.
Table 2: Profile of respondents
Frequency Percent
Company Yemen Mobile 101 37.5
Sabafon 168 62.5
Department Information Systems/ IT 116 43.1
Customers Service 114 42.4
Accounting and Finance 16 5.9
Human Resource 14 5.2
Marketing and Sales 9 3.3
Gender Male 232 86.2
Female 37 13.8
Education High School 2 0.7
Diploma 14 5.2
Bachelor 231 85.9
Master 21 7.8
PhD 1 0.4
Position Administration Staff 74 27.5
Technical Support Staff 85 31.6
Head of Department 13 4.8
Manager 8 3.0
[image:3.482.89.394.409.607.2]Structural Model
6.
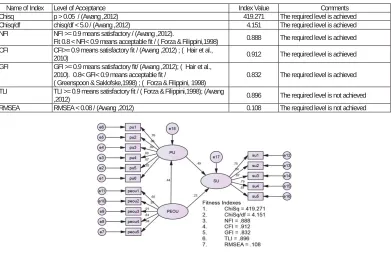
[image:4.482.47.438.159.418.2]Structural model is set of one or more dependence relationships linking the hypothesized model's constructs. The structural model is most useful in representing the interrelationships of variables between constructs (Hair et al., 2010). In this study, the structural model did not fit well. The TLI, and RMSEA not achieved the required level. Table 3 shows the fit indexes for the initially structural model. Figure 3 shows Initially structural model.
Table 3: Goodness of Fit indexes for the Initially Structural Model
Name of Index Level of Acceptance Index Value Comments
Chisq p > 0.05 / (Awang ,2012) 419.271 The required level is achieved
Chisq/df chisq/df < 5.0 / (Awang ,2012) 4.151 The required level is achieved
NFI NFI >= 0.9 means satisfactory / (Awang ,2012).
Fit 0.8 < NFI< 0.9 means acceptable fit / ( Forza & Filippini,1998) 0.888 The required level is achieved
CFI CFI>= 0.9 means satisfactory fit / (Awang ,2012) ; ( Hair et al.,
2010) 0.912 The required level is achieved
GFI GFI >= 0.9 means satisfactory fit/ (Awang ,2012); ( Hair et al.,
2010). 0.8< GFI< 0.9 means acceptable fit /
( Greenspoon & Saklofske,1998) ; ( Forza & Filippini, 1998) 0.832 The required level is achieved
TLI TLI >= 0.9 means satisfactory fit / ( Forza & Filippini,1998); (Awang
,2012) 0.896 The required level is not achieved
RMSEA RMSEA < 0.08 / (Awang ,2012) 0.108 The required level is not achieved
Figure 3: Initially structural model
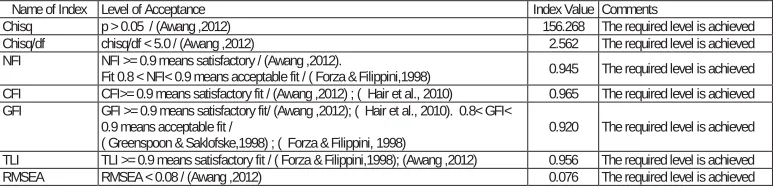
[image:4.482.142.344.473.602.2]After dropping the problematic items, the structural model was re-run. Final structural model is depicted in Figure 4. Table 4 shows the fit indexes for the revised structural model.
Table 4: Goodness of Fit indexes for the Revised Structural Model
Name of Index Level of Acceptance Index Value Comments
Chisq p > 0.05 / (Awang ,2012) 156.268 The required level is achieved
Chisq/df chisq/df < 5.0 / (Awang ,2012) 2.562 The required level is achieved
NFI NFI >= 0.9 means satisfactory / (Awang ,2012).
Fit 0.8 < NFI< 0.9 means acceptable fit / ( Forza & Filippini,1998) 0.945 The required level is achieved
CFI CFI>= 0.9 means satisfactory fit / (Awang ,2012) ; ( Hair et al., 2010) 0.965 The required level is achieved
GFI GFI >= 0.9 means satisfactory fit/ (Awang ,2012); ( Hair et al., 2010). 0.8< GFI<
0.9 means acceptable fit /
( Greenspoon & Saklofske,1998) ; ( Forza & Filippini, 1998) 0.920 The required level is achieved
TLI TLI >= 0.9 means satisfactory fit / ( Forza & Filippini,1998); (Awang ,2012) 0.956 The required level is achieved
RMSEA RMSEA < 0.08 / (Awang ,2012) 0.076 The required level is achieved
Test of Research Hypotheses 7.
7.1 Hypothesis 1
[H1]: There is a positive relationship between perceived usefulness and use of the system. The research findings in this study indicate that perceived usefulness ( CR= 6.700, p = 0.000 < 0.05 ) is found to have a direct relationship with use of the system, in support of hypothesis H1.
7.2 Hypothesis 2
[H2] There is a positive relationship between perceived ease of use and perceived usefulness. The research findings in this study indicate that perceived ease of use ( CR= 6.759, p = 0.000 < 0.05 ) is found to have a direct relationship with perceived usefulness, in support of hypothesis H2.
7.3 Hypothesis 3
[H3]: There is a positive relationship between perceived ease of use and use of the system The research findings in this study indicate that perceived ease of use ( CR= 3.239, p = 0.001 < 0.05 ) is found to have a direct relationship with use of the system, in support of hypothesis H3.
Table 5 shows the summary of hypotheses testing.
Table 5: Summary of Hypotheses Testing
Hypothesis Results
H1 – There is a positive relationship between perceived usefulness and use of the system. Supported
H2 – There is a positive relationship between perceived ease of use and perceived usefulness. Supported
H3 – There is a positive relationship between perceived ease of use and use of the system. Supported
Conclusion 8.
Technology Acceptance Model is one of the most influential models used widely in the studies of the determinant of technology acceptance. Technology Acceptance Model has been tested in North America and many others countries. This paper test the technology acceptance model in context of telecommunication companies in Yemen. This study has provided the empirical test of an of the technology acceptance model in context of telecommunications Companies in Yemen. three hypothesized relationships tested by structural equation modeling technique , all the hypotheses were found to be significant . This means that technology acceptance model useful in context of Yemen.
Acknowledgment 9.
References
Agrawal, S.K. (2013). International journal of advance research in computer science and management studies. International Journal, 1(7).
Al-Mamary, Y.H., Shamsuddin, A. & Aziati, N. (2015a) Investigating the key factors influencing on Management Information Systems adoption among Telecommunication Companies in Yemen: The Conceptual Framework Development, International Journal of Energy, Information and Communications. 6(1),pp.59-68.
Al-Mamary, Y.H., Shamsuddin, A. & Aziati, N. (2015b) The Pilot Test Study of Relationship Between Management Information Systems Success Factors and organizational performance at Sabafon Company in Yemen, Journal of u- and e- Service, Science and Technology, 8(2),pp.337-346.
Awang, Z. (2012). Structural equation modeling using AMOS graphic. Penerbit Universiti Teknologi MARA.
Chen, S.C., Li, S.H. & Li, C.Y. (2011). Recent related research in technology acceptance model: A literature review. Australian Journal of Business and Management Research, 1(9), pp. 124–127.
Davis, F.D. (1989). Perceived usefulness, perceived ease of use, and user acceptance of information technology. MIS quarterly, pp. 319–340.
Davis, F.D., Bagozzi, R.P. &Warshaw, P.R. (1989). User acceptance of computer technology: a comparison of two theoretical models. Management science, 35(8), pp. 982–1003.
Forza & Filippini, R. (1998). Tqm impact on quality conformance and customer satisfaction: a causal model. International journal of production economics, 55(1), pp.1–20.
Greenspoon & Saklofske, D.H. (1998). Confirmatory factor analysis of the multidimensional students life satisfaction scale. Personality and Individual Differences, 25(5), pp. 965–971.
Hair, J., Anderson, R., Tatham, R. & Black,W. (2010). Multivariate Data Analysis 7th edition Prentice Hall.
Hair, J., Anderson, R., Tatham, R. & Black,W. (2006). Multivariate Data Analysis 6th edition Prentice Hall.
Legris, P., Ingham, J. & Collerette, P. (2003). Why do people use information technology? a critical review of the technology acceptance model. Information & management, 40(3), pp. 191–204.
OBrien & Marakas, G. (2007). Management Information Systems (Special Indian Edition) Tata McGraw-Hill Education.
Schaper, L. K., & Pervan, G. P. (2007, January). An investigation of factors affecting technology acceptance and use decisions by Australian allied health therapists. In System Sciences, 2007. HICSS 2007. 40th Annual Hawaii International Conference on pp. 141-141.