International Journal of Emerging Technology and Advanced Engineering
Website: www.ijetae.com (ISSN 2250-2459,ISO 9001:2008 Certified Journal, Volume 3, Issue 3, March 2013)
688
High Speed Detection of Load Surges in Grid Connected
Generators using Kalman Algorithm
N Vedachalam
1, R Ramesh
2, V Doss Prakash
3, N B Prashanth
4, G A Ramadass
5, M A Atmanand
61,2,3,5,6National Institute of Ocean Technology, Chennai, India. 4Manipal Institute Of Technology, Manipal
Abstract— Power generating plants need to operate
synchronous power generators paralleled with local power grid for the purpose of real and reactive power exchanges and to have an uninterrupted operation of plant loads during grid outages. Failure to island generator system during grid outages results in generator feeding infinite grid. This results in sudden load surge on generator sets which could damage electro-mechanical systems and hence early detection and islanding the generator from grid is preferable. This paper presents a new technique for high speed detection of load surges using Kalman prediction algorithm. The paper also describes the conventional zero crossing detection algorithm. The paper describes both algorithms, analyses effectiveness of both conventional and Kalman prediction algorithms using MATLAB software. It is found Kalman prediction algorithm is able to detect load surges involving rotor angle changes from 2º to 20º in 1ms compared to the conventional zero crossing approach which requires a minimum detection time of 12 ms. This fast detection encourages grid synchronized operation of generators with lower inertia constants. It is also analyzed and found that the effectiveness of the Kalman predictor algorithms is not affected significantly due to voltage harmonics.
Keywords—Grid, Harmonics, Kalman prediction, Load
Surge, MATLAB, Synchronous generators.
I. INTRODUCTION
Process and power plants need to operate their in-house synchronous power generators synchronized with local power grid with aim of achieving the following objectives, 1) To provide uninterrupted operation of internal connected loads during grid outages.
2) Import required active and reactive power when the internal power generation is less than the internal demand.
[image:1.612.361.522.217.288.2]3) Export excess generated active and reactive power to the grid when internal power generation is more than internal demand.
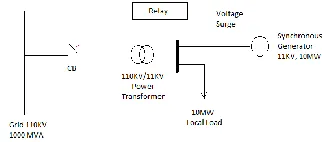
Fig 1.Typical synchronous generator synchronized with load power grid
Fig.1 shows a typical synchronous generator operated in parallel with the local power grid. The active power generated by the synchronous generator is used for feeding the plant internal loads. During grid outages, the generator set starts feeding the mains with an infinitely high load [1]-[6]. This could result in the following undesirable conditions,
Damage the connected electro mechanical system of the generator set. Unsafe condition to the connected grid due to back feeding resulting in damage to life and grid systems.
International Journal of Emerging Technology and Advanced Engineering
Website: www.ijetae.com (ISSN 2250-2459,ISO 9001:2008 Certified Journal, Volume 3, Issue 3, March 2013)
689
The following equations show the relationships [5] between the parameters involved.
H = (1)
H – Inertia constant of the synchronous generator in MWs/MVA
J- Moment of inertia in kgm2 of the rotating synchronous generator
- nominal speed of rotation in rad/s
MVA – MVA rating of the synchronous generator
=
(2)
∂f/∂t - Rate of change of frequency
∆P - Overload load on the generator in MW
Load surges are detrimental for the generators as sudden speed changes are not healthy for the prime mover which is normally diesel driven, steam driver or gas driven. Sudden drop of speed in a gas compressor [9],[10] results in stalling which induces heavy vibration due to the internal forces created by the working fluid on the turbine blades, whereas the internal combustion engine system experiences shocks leading to piston and crank shaft failures. Therefore this situation can be avoided by islanding the generator from the grid immediately upon detecting the load surge. Early detection of surge reduces the stress on the electro mechanical system of the generator and hence increases the reliability and useful life time
II. SYSTEM BEHAVIOR DURING SUDDEN OVERLOAD
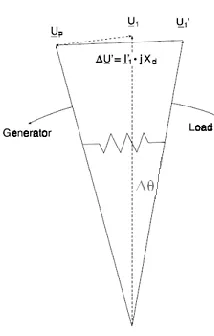
[image:2.612.394.501.116.284.2]When a synchronous generator is operating within its rated capacity, there is a voltage drop between the terminal voltage and the alternator internal voltage due to the alternator current passing through the alternator reactance. As a result, there is a displacement in angle between the terminal voltage and the alternator internal voltage [1]-[3], [6], [11]. This is shown in Fig. 2.
Fig 2. Angular displacement between synchronous machine and mains terminal voltages during normal operation
Fig 3. Angular displacement between alternator and terminal voltages during surge instance
Fig. 3 shows the increase in the angle when the synchronous machine begins to feed a surge load, a condition similar like a grid outage. As the generator prime mover could not meet the active power demand, the rotor of the generator begins to decelerate and the angular difference suddenly increases [1]-[3], [6], [11].
[image:2.612.349.548.543.626.2]WalmirFreitas et al [12] analyzed the load surge phenomena in time domain and found that the instantaneous value of the terminal voltage jumps to another value and the phase position changes. The increase in the angular displacement between the grid and generator terminal voltages is accompanied by a jump in the voltage waveform and the same is shown in Fig.4. It can be seen that u1 (t) is the voltage waveform indicated by thick and continued dotted lines. The dotted line indicates the situation if such a load surge event has not occurred. When the surge occurs, the instantaneous value of the voltage jumps to a new point. U1’ (t) is the voltage waveform after the surge event.
Fig 4. Behavior of the voltage waveform during surge
III. SIMULATING ASURGE LOAD CONDITION
[image:2.612.115.221.557.693.2]International Journal of Emerging Technology and Advanced Engineering
Website: www.ijetae.com (ISSN 2250-2459,ISO 9001:2008 Certified Journal, Volume 3, Issue 3, March 2013)
690
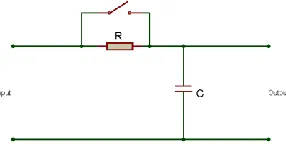
[image:3.612.102.245.245.317.2]The circuit is used to simulate load surge conditions of different magnitudes and the output waveform is analyzed in time domain. By varying the value of resistor and capacitor, the magnitude and duration of the surge can be simulated and hence the voltage waveform behavior can be analyzed. In the circuit shown in Fig.5, the momentary push of the button S simulates the surge load condition.Table I summarizes the values of the circuit elements for realizing varying voltage waveform shift conditions.
Fig.5 Experimental setup to understand voltage waveform behavior
[image:3.612.74.265.387.692.2]The input of the network is energized with a 230 V ac input and the output of the waveform is recorded when the switch S is momentarily closed. This is done for the circuit parameters indicated in Table 1.
Fig 6.Voltage shift with a surge of 2°
Fig. 7. Voltage shift with a surge of 20°
The waveforms are recorded using a Tektronix 3150B oscilloscope. The circled portion in Fig.6 indicates the overload condition corresponding to delta theta of 2° and circled portion in Fig.7 indicates the overload condition corresponding to delta theta of 20°.
TABLE I
VALUES OF CIRCUIT COMPONENTS USED FOR SURGE SIMULATION
Resistance ( R ) in
kΩ Capacitance ( C) in µF ∆θ
1.0 0.1 2°
2.2 0.1 5°
4.7 0.1 10°
6.2 0.1 15°
8.2 0.1 20°
IV. ALGORITHMS FOR DETECTION
The following algorithms are explained in detail, 1) Zero crossing detection approach 2) Kalman prediction
technique.
The zero crossing detection technique based algorithm is presently followed by the industry for protecting grid synchronized generators from surge loads. The zero crossing technique based technique and its limitations are detailed. We have proposed a new algorithm based on Kalman prediction technique which has high speed detection performance compared to the zero crossing detection technique. The proposed Kalman prediction technique based algorithm and its significance in protecting generators with lower inertia constants are detailed. The algorithms immunity to the voltage harmonics is also discussed. Chowdhury et al [1] proposed similar technique for power system fault detection and state estimation for double circuit transmission lines where trip times were around 5 ms.
V. ZERO CROSSING APPROACH
International Journal of Emerging Technology and Advanced Engineering
Website: www.ijetae.com (ISSN 2250-2459,ISO 9001:2008 Certified Journal, Volume 3, Issue 3, March 2013)
[image:4.612.76.263.110.266.2]691 Fig.8. Original wave super imposed on time shifted wave
From Fig.8, it can be seen that, when a surge occurs, the waveform follows a new time reference a voltage jump of approximately 20°. Zero-crossing occurs at time ta instead of tb. The algorithm, after a zero-crossing, waits for next zero arrival and if does not arrive within a programmed duration, it identifies the occurrence of a surge load condition. The delay period is proportional to the magnitude of the surge .The permissible delay duration is pre- programmed so that the decision is transmitted for subsequent actions such as opening the circuit breaker which islands the generator set from the grid.
1. Challenges with zero crossing detection approach
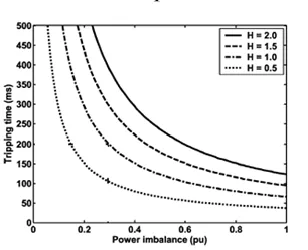
The overload withstand capability of the generator set depends on its capacity and inertia constant. Fig.9 shows the surge load withstand characteristics of generator sets [12], [15] of decreasing inertia constants for a surge angle of 10°.Pieter et al [8] have studied inertia constants of different higher capacity generator systems and found that the inertia constants are in the range from 2 to 5s.
[image:4.612.377.514.533.635.2]1
Fig 9. Overload withstand capability of synchronous power generators
Gonzalez et al [16] have studied inertia constants of the smaller wind driven generators and they have found that the inertia constants are close to 0.63 for generators of 1.65 MW capacity. For lower capacity wind driven generators the inertia constants are around 0.5 s. From Fig.9 it can be seen that generators withan inertia constant of 1 s can be allowed to operate for a maximum duration of 150 ms whereas a generator of 0.5s inertia constant can be allowed to operate only for a maximum period of 80ms for a power imbalance condition of 0.3pu. WalmirFreitas et al [12] have developed mathematical model based on swing equations for generators with varying inertia constants. In this zero crossing detection approach, the detection time is not less than 12ms under the condition that a surge load condition has occurred immediately after a voltage zero crossing and that the surge load condition corresponds to a rotor angle of 20°.M.Benidris et al [17] have analysed the transient stability of distributed lower capacity generators in the presence of energy storage devices.
VI. KALMAN PREDICTOR APPROACH
[image:4.612.94.248.535.660.2]Kalman filter [18]-[20] is a recursive predictive algorithm which estimates the state of a dynamic system. Kalman prediction algorithm is a recursive algorithm used to obtain a precise estimate of an unknown variable by making use of noisy measurements observed over time. Kalman algorithm makes use of the current state of the system and the uncertainties involved to predict the next state. Hence history of observations is not required. This makes the algorithm robust by reducing the memory required making it an ideal choice for cost, low-memory embedded systems. The algorithm involves in projecting the state and covariance ahead and the same is shown in Fig.10.
Fig. 10. Kalman Prediction algorithm
International Journal of Emerging Technology and Advanced Engineering
Website: www.ijetae.com (ISSN 2250-2459,ISO 9001:2008 Certified Journal, Volume 3, Issue 3, March 2013)
692
Kalman prediction algorithm is tuned with the following parameters,
[image:5.612.49.288.231.298.2]Error covariance, P0 = 0.1; Initial state value, x0 = 0 Process variance, Q = 2; Measurement variance, R = 1 The resultant Kalman waveform is subjected to a Butterworth High Pass filtration with a stop band of 100Hz at -80db gain and a pass band of 200Hz with 0dbgains and the output is used for surge detection. The block diagram of the logic is shown in Fig.11.
Fig.11. Block Diagram of Kalman Predictor with filter
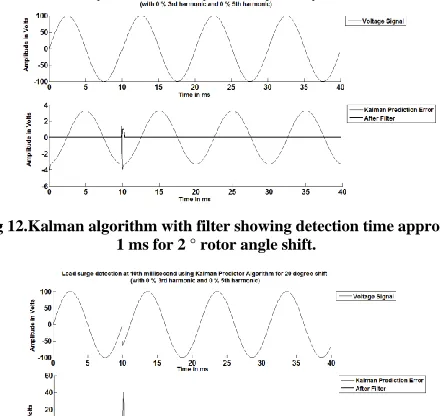
[image:5.612.341.567.365.464.2]The voltage waveform sampling is done at 500 Hz frequency. It is found that Kalman prediction algorithm is able to detect surge loads involving rotor angle shifts in the range from 2° to 20°in a period around 1ms.Fig.12 and 13 shows the simulated waveform for rotor angle shifts of 2° and 20°.
[image:5.612.61.283.395.506.2]Fig 12.Kalman algorithm with filter showing detection time approx. 1 ms for 2 ° rotor angle shift.
Fig 13.Kalman algorithm with filter showing detection time approx. 1 ms for 20 ° rotor angle shifts.
VII. EFFECT OF WAVEFORM HARMONIC DISTORTION IN
KALMAN APPROACH
Simulations are done to analyze the algorithms effectiveness to detect a surge when the voltage waveform contains significant harmonic components. To understand this, the basic waveform which has a fundamental power frequency of 50 Hz is vector added with harmonic components.
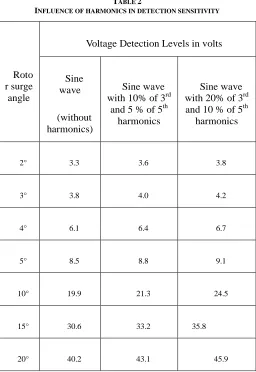
Fig 14 shows the case when the fundamental frequency with third and fifth harmonics each being 10 % of fundamental frequency and Fig 15 shows the case when the fundamental frequency with third and fifth harmonics being 20 % and 10 % of fundamental frequency. It is seen that the harmonics influences the sensitivity of the detection. Fig. 14, 15, 16 shows the Kalman error for voltages without and with harmonics. Table 2 summarizes the influence of harmonics in the measurement. It is found that harmonics influences the accuracy of the surge measurements equivalent to 1° at lesser surge angles and equivalent to 0.5° at higher surge angles.
[image:5.612.60.280.400.608.2]Fig 14. Overload detection using Kalman prediction for 10° shift with fundamental waveform without harmonics
Fig. 15. Overload detection using Kalman prediction for 10° shift with fundamental waveform and 10% 3rd harmonic and 10% 5th
[image:5.612.340.578.502.618.2]International Journal of Emerging Technology and Advanced Engineering
Website: www.ijetae.com (ISSN 2250-2459,ISO 9001:2008 Certified Journal, Volume 3, Issue 3, March 2013)
[image:6.612.65.286.118.241.2]693 Fig. 16. Overload detection using Kalman prediction for 10° shift with fundamental waveform and 20% 3rd harmonic and 20% 5th
[image:6.612.41.297.284.656.2]harmonic
TABLE 2
INFLUENCE OF HARMONICS IN DETECTION SENSITIVITY
Roto r surge
angle
Voltage Detection Levels in volts
Sine wave
(without harmonics)
Sine wave with 10% of 3rd
and 5 % of 5th harmonics
Sine wave with 20% of 3rd and 10 % of 5th harmonics
2° 3.3 3.6 3.8
3° 3.8 4.0 4.2
4° 6.1 6.4 6.7
5° 8.5 8.8 9.1
10° 19.9 21.3 24.5
15° 30.6 33.2 35.8
20° 40.2 43.1 45.9
VIII. SURGE ANGLE SETTING FOR GENERATOR
PROTECTION APPLICATIONS
WalmirFretias et al [12] have explained the surge angle protection is a function of the synchronous speed of the generator, power imbalance, generator inertia constant and the impedance level of the mains and it vary in the range between 2° and 20°.
1.Protecting Generators with higher inertia constants
The surge detection time using Kalman predictor algorithm is 1ms. This has as a significant advantage over zero crossing algorithms with needs a minimum detection time of 12ms. This helps in reducing the stresses on the generator system and hence increased life and reliability of the electro-mechanical systems. Thus it is potential alternate to zero crossing detection approach for protecting generators with higher inertia constants.
2.Protecting Generators with higher inertia constants
This algorithm has a lower detection time; this encourages grid synchronized operation of synchronous generators with lower inertia constants.
3.Protecting grid-interfaced turbo generator
Ahmed F zobea et al [21] has explained the power transfer mechanism in a wind powered synchronous generator and the schematic of a wind turbine is shown in Fig.17.
Fig.17. Schematic diagram of a grid interfaced turbine system
[image:6.612.339.550.447.503.2]International Journal of Emerging Technology and Advanced Engineering
Website: www.ijetae.com (ISSN 2250-2459,ISO 9001:2008 Certified Journal, Volume 3, Issue 3, March 2013)
694
As the power electronics switching times are very less in the order of microseconds [22], the total time required detecting the surge and island the system is less than 2 ms.
IX. CONCLUSION
This paper studies the methodologies for surge detection during situations such as grid outage when synchronous generators are operated synchronized with the local power grid. By using conventional zero crossing detection algorithms, the detection time is not less than 12ms under the condition that a surge has occurred immediately after a voltage zero crossing and that the surge condition corresponds to a rotor angle shift of 20°. Further to this, the control system after detecting the surge load condition has to command the upstream circuit breaker to open. The opening time of a typical SF6 circuit breaker [22] is around 50 ms. Therefore the total time to detect and island is not less than 61 ms. With the Kalman prediction based algorithm, the detection times is around 1ms .Taking into consideration 50ms, the time taken to command the upstream circuit breaker to open, total time to detect and islands 51 ms for rotor angle shifts between 2° and 20°.Thus Kalman prediction algorithm is a viable and efficient alternative to the zero crossing technique. As the detection time is comparatively less, it helps to reduce the stress on generator sets. Furthermore it encourages grid synchronized operation of generators with lower inertia constants.
Acknowledgement
The authors are thankful to Ministry of Earth Sciences and other NIOT scientists for their encouragement and support.
REFERENCES
[1 ] Chowdhury et al, Power system fault detection and state estimation using Kalman Filter with hypothesis testing, IEEE Transactions on power Delivery (1991), Volume 6, Issue 3, Pages 1025 – 1030 [2 ] CIRED Working Group 4, ―Dispersed Generation‖, CIRED, Tech.
Rep., Liege, Belgium, 1999
[3 ] G59/1 Recommendations for the Connection of Embedded Generating Plant to the Regional Electricity Companies Distribution Systems (1991)
[4 ] IEEE Guide for Interfacing Dispersed Storage and Generation Facilities with Electric Utility Systems (1988)
[5 ] Leonard L Grigsby, Power System Stability and Control, Electric Power Engineering Handbook, Second Edition, CRC Press [6 ] P.Kundur, Power System Stability and Control, New York:
McGraw-Hill, 1994.
[7 ] A. K. Singh and S. K. Parida, A multiple strategic evaluation for fault detection in electrical power systems, International Journal of Electrical Power and Energy Systems (2013), Volume 48
[8 ] Pieter Tielens et al, Grid inertia and frequency control in power systems with high penetration of renewables, Young researchers symposium in Electrical Power Engineering (2012), Edition 6, Delft-The Netherlands
[9 ] Control Systems, Robotics and Automation - Vol. XVIII, Gas Turbines, Hans-Kaspar Scherrer, Christopher Ganz and Wolf- gang Weisenstein
[10 ]Quing He and Dongmei Du, Modeling and Calculation Analysis of Torsional Vibration for Turbine Generation Shafts, Journal of Information and Computational Science 7: 10 (2010) 2174-2182 [11 ]N.Jenkins, R. Allan, P. Crossley, D.Krischen, and G. Strbac,
Embedded Generation, 1st ed. London, U.K.: Inst. Elect. Eng., (2000).
[12 ]Walmir Freitas, Zhenyu Huang and WilsunXu, A Practical Methods for Assessing the Effectiveness of Vector Surge Relays for Distributed Generation Applications, IEEE Transactions on Power Delivery (2005), Vol. 20
[13 ]J P Braun et al , Power quality waveform generator based on the C Sound software sound generator, 11th International Conference (12-15 Sep 2004)
[14 ]M. H. Bollen, Understanding power quality problems: Voltage sags and Interruptions, New York, IEEE Press (2000), Page 139 [15 ]Walmir Freitas et al, Characteristics of vector surge relays for
distributed synchronous generator protection Electric Power Systems Research (2007), Volume 77, Issue 2, February 2007, Pages 170-180
[16 ]A.G.Gonzalez Rodriguez et al, Estimating wind turbines mechanical constants, International Conference on renewable energy and power quality, ICREPQ (2006), Volume 7
[17 ]M.Benidris et al, Transient stability of distributed generators in the presence of energy storage devices, North American Power Symposium NAPS (2012), IEEE
[18 ]Design and performance analysis of Kalman filters Mathematics in Science and Engineering (1979), Volume 141, Chapter 6 Part 1, Pages 289-367
[19 ]Sorenson, Harold W. (1985): Kalman filtering: theory and application, New York
[20 ]R.G. Brown, Introduction to Random Signal Analysis and Kalman Filtering, John Wiley & Sons (1983).
[21 ]Ahmed F zobea et al, Renewable energy-global warming problem and impact of power electronics, International Conference on renewable energies and power quality,-ICREPQ (2011) at Spain [22 ]Marco Antonio et al, A failure detection strategy for IGBT based
on gate voltage behavior applied to a motor-drive system, IEEE transactions on industrial electronics (2011), Vol 58
[23 ]William.D.Stevenson, Elements of Power System Analysis, McGraw-Hill International Book Company, Third Edition. [24 ]Working Group 37.23, Impact of increasing Contribution of
Dispersed Generation on the Power System, CIGRÉ, Tech. Rep., Paris, France, 1999.