The Behaviour of Laboratory Soil Electrical Resistivity Value
under Basic Soil Properties Influences
Z A M Hazreek1,7, M Aziman2, A T S Azhar3, W D Chitral4,8, A Fauziah5,9 and S Rosli6
1,2,3 Faculty of Civil and Environmental Engineering, Universiti Tun Hussein Onn Malaysia, 86400 Batu Pahat Johor, MALAYSIA
4 Research Center for Soft Soil, Universiti Tun Hussein Onn Malaysia, 86400 Batu Pahat Johor, MALAYSIA
5 School of Civil Engineering, Universiti Sains Malaysia, 14300 Nibong Tebal Penang, MALAYSIA
6,7 School of Physics, Universiti Sains Malaysia, 11800 USM Penang, MALAYSIA 8 School of Architecture, Computing and Engineering, University of East London, Beckton E11 2RD London, ENGLAND
9 Institute of Postgraduate Studies, Universiti Sains Malaysia, 11800 USM Penang, MALAYSIA
E-mail: [email protected]
Abstract. Electrical resistivity method (ERM) was a popular indirect geophysical tools adopted in engineering, environmental and archaeological studies. In the past, results of the electrical resistivity value (ERV) were always subjected to a long discussion and debate among the related parties such as an engineers, geophysicists and geologists due to its lack of clarification and evidences in quantitative point of view. Most of the results produced in the past was always been justified using qualitative ways which difficult to be accept by certain parties. In order to reduce the knowledge gap between those parties, this study has performed a laboratory experiment of soil box resistivity test which supported by an additional basic geotechnical test as referred to particle size distribution test (d), moisture content test (w), density test (ρbulk) and Atterberg limit test (LL, PL and PI). The test was performed to establish a series of electrical resistivity value with different quantity of water content for Clayey SILT and Silty SAND soil. It was found that the ERV of Silty SAND (600 – 7300 Ωm) was higher
than Clayey SILT (13 – 7700 Ωm) due to the different quantity of basic soil properties value
obtained from the basic geotechnical test. This study was successfully demonstrated that the fluctuation of ERV has greatly influenced by the variations of the soil physical properties (d, w,
ρbulk, LL, PL and PI). Hence, the confidence level of ERV interpretation will be increasingly meaningful since it able to be proved by others parameter generated by laboratory direct test.
1. Introduction
Geotechnical site investigation (SI) was carried out to determine the properties of the geomaterials (soil and rock) which importantly used in design and construction stage. Generally, it involves two stage involving surface and subsurface exploration. Physical mapping (e.g. geological mapping) was always conducted during the surface exploration while soil sampling and laboratory test was usually performed during the subsurface exploration. Several techniques were commonly used in the SI
AeroEarth 2014 IOP Publishing
involving conventional and alternative approach. Drilling technique was a classical SI method which obtained the SI data in good accuracy due to its nature of direct test. However in certain cases (e.g. large scale project), most of the conventional methods will faced several constraints which related to the increasing of project cost and time. Furthermore, the information obtained was a single point data and the interpolation between a large boreholes spacing can lead to increase the degree of uncertainties of the subsurface profile investigated [1] – [3]. As a result, the solutions to these challenges will require multidisciplinary research across the social and physical sciences and engineering [4]. Hence, geophysical method offers the chance to overcome some of the problems inherent in more
conventional ground investigation techniques [5].
Today, geophysical method such as electrical resistivity, seismic, gravity, ground penetration radar, magnetic, etc has improve lots due to the continuous rapid development of electronics technology thus increasingly adopted as an alternative tool in SI. Geophysical methods can be implemented more quickly and less expensively and can cover larger areas more thoroughly [6] – [9]. The electrical resistivity method was among the most popular geophysical tools applied in geotechnical site investigation for subsurface mapping tools. This method was used to detect the depth and thickness of soil and rock, bedrock and overburden materials [10], groundwater [11] and [12], cavity and boulder [13], etc. Most of the project involving ERM was performed by geophysicists, engineers and geologists who have their own strength and weakness based on their own background areas. For example, geophysicist was a truly championed in geophysical field which allow them to performed the electrical resistivity data acquisition, processing and interpretation very good while the civil engineers has not being fully explored about this method due to their lack of exposure and expertise in this area.
As reported by [1], some geophysical results and conclusions are difficult to deliver in sound and definitive ways due to some of geophysicists who attempt to hide their expertise for business reasons. Conventional geophysical interpretation such as ERV is too much dependent subjectively on anomaly and past geomaterials reference charts and tables thus possibly considered weak in term of its reliability due to the qualitative point of view approaches. For example, the properties of ERV can be found to be dissimilar even for the same particular type of geomaterial in many past references. Moreover, conventional reference tables of geomaterials used for anomaly interpretation sometimes was difficult to decipher due to its wide range of variation and overlapping values [14]. As a result, a strong verification is vital to explained its behaviour which otherwise have been traditionally conclude based on a qualitative approach depending on the experience of the expert [15]. This scenario has proved that the geophysical properties ambiguity are still need to be discover from several perspectives. According to [5], geophysicists still possess little appreciation from the engineer’s point of view and lack the knowledge of the science in soil mechanics.
Hence, this study was performed to established a series of laboratory soil electrical resistivity properties and basic physical properties (BPP) under controlled environment with the aim to reduce some black box and ambiguities between all related parties via relationship of ERV and basic physical properties of soil with particular reference to moisture content, density and soil grain size characteristics. Laboratory test used in this study was able to reduced soil uncertainties thus able to produced significant results of the soil ERV behaviour due to its control environment (temperature, humidity and properties known). Furthermore, this fundamental study can possibly increased the confidence level of engineers regarding the ERV interpretation which importantly use as an initial study during the subsurface profile characterization.
2. Methodology
All tests were performed on two different types of soil (fine and coarse soil) using laboratory based geophysical and geotechnical experiments. Soil classification tests such as dry and wet sieve, Atterberg limit, moisture content and density based on [16] was carried out. Electrical soil box resistivity test was performed using Nilsson model 400 soil resistance meters and Miller’s soil box apparatus by mixing an original mass of 1500 g of oven dried soil with 1-3 % of distilled water and
AeroEarth 2014 IOP Publishing
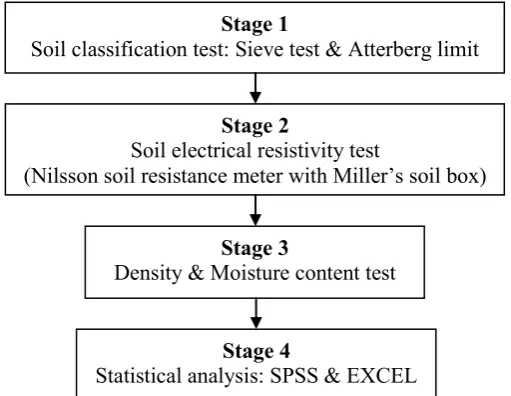
tested repeatedly at 25 times (each test used 15, 30 and 45 ml of distilled water based on percentage of water used for 1500 g of original oven dried soil). For example, a 15 ml of distilled water was added consistently and mixed thoroughly into the originally loose oven dried soil and continuously tested with each increment of distilled water added using soil box resistivity meter for 25 determinations of ERV. After that, the same procedure was repeated using a 30 and 45 ml of distilled water which applied to the new 1500 g of originally loose oven dried soil. The test was continuously repeated at 25 times due to the consistency of ERV (ERV has demonstrate insignificant changing when it reach 25 numbers of test). Miller’s soil box apparatus consisted of a 4 pin arrangement consisting of 2 current pin (both being located at the end of the soil box) and 2 potential pin (these being located along the middle of the soil box). The function of two end current pins were to inject direct current (DC current) into the soil while the other two potential pins were used to measure a potential difference for calculating the soil resistivity value. Soil moisture content and density was taken immediately after the soil resistivity was measured. Moisture content test was determined for two samples from each soil box test for final averaging purposes. All results obtained from the experiments were also analyzed using a statistical regression method. Overall methodology of this study was given in the Figure 1. As referred to in [16], the following equations (1-3) were used to calculate the resistivity value, bulk density and moisture content.
RA/L (1)
where A is the cross-sectional area of the sample, L is the length of the sample between the electrodes and R is the mean resistance of the soil sample (R=V/I)
bulkm/V (2)
where m is the mass of the soil specimen (solids + water) and V is the volume of the test specimen (total volume)
100 x )) -)/( -((
= m2 m3 m3 m1
w (3)
where m1 is the mass of container, m2 is the mass of container and wet soil and m3 is the mass of
[image:3.595.170.426.533.731.2]container and dry soil
Figure 1. Analysis path to infer the behaviour of laboratory soil electrical resistivity value under basic soil properties influences.
Stage 3
Density & Moisture content test Stage 1
Soil classification test: Sieve test & Atterberg limit
Stage 2
Soil electrical resistivity test
(Nilsson soil resistance meter with Miller’s soil box)
Stage 4
Statistical analysis: SPSS & EXCEL
AeroEarth 2014 IOP Publishing
3. Results and Discussions
All results presented and discussed are based on laboratory electrical resistivity value (ERV), basic
physical properties of soil and relationship of field ERV with moisture content (w), density (ρ) and grain size of soil (d). All results are presented in Table 1 and Figure 2 – 4.
3.1. Electrical resistivity value (ERV)
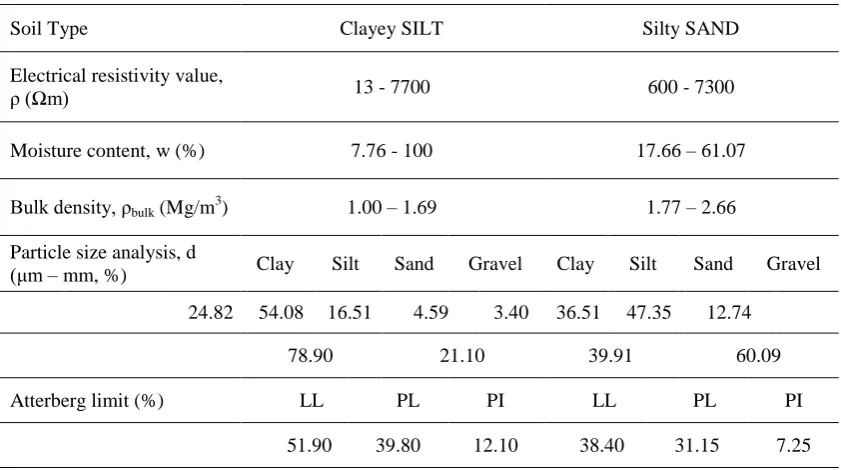
ERV was determined by measuring the potential difference at points on the ground surface which caused the propagation of direct current through the subsurface [17]. The ERV obtained in Table 1 was originally established from the laboratory soil box test using two different types of soil under loose condition. It was found that the ERV of Silty SAND (600 – 7300 Ωm) has demonstrate a higher ERV compared to the Clayey SILT (13 – 7700 Ωm) due to the different composition of basic physical properties of soil such as solid, water and air. Electrical propagation in soil is largely electrolytic process by flowing in connected pore spaces and along grain boundaries of geomaterial [18].
3.2. Grain size fraction, moisture content and density
This study has performed using fine and granular soil in order to demonstrate the behaviour of the ERV under different type of soil which contained different composition of physical and chemical properties. Based on sieve and Atterberg limit test, it was found that the fine soil sample was classified as Clayey SILT (mixture of both granular and fine particle with domination of fine particle) while granular soil sample was known as Silty SAND (mixture of both granular and fine particle with domination of granular particle) based on engineering soil classification. All sieve analysis results of soil specimen tested from both soils has shown some great variation in terms of grain size quantification due to the natural heterogeneity features of soil. Detailed results obtain in Table 1 was originally extracted from particle size distribution curve (PSD) presented in Figure 2.
It was found that moisture content (w) value of Clayey SILT (7.76 – 100 %) has a higher range compared to the Silty SAND (17.66 – 61.07 %). For density results, it was found that Silty SAND (ρbulk = 1.77 – 2.66 Mg/m3) has a higher bulk density value compared to the Clayey SILT (ρbulk = 1.00 –
1.69 Mg/m3). In soil mechanics and geotechnical engineering, soil density was basically described
using bulk density (ρbulk) and dry density (ρdry). Bulk density was defined by total mass of solids and water per total volume while dry density was defined by mass of solids per total volume. Quantities of densities provide a measure of the material quantity related to the space amount it occupies [19]. Based on Figure 3 and 4, it can be observed that the densities of each soil were relative to the moisture content variations by showing general relationship of densities was linearly proportional with the moisture content. Higher quantity of water will increased the total soil weight thus increasing its density and vice versa. Quantity of fine particles from Clayey SILT was greater than coarse particle which allow more water to be absorb more in order to increase its densities. As for Silty SAND, the relationship was strongly believed to be influenced by the domination of water and coarse grain particle. Coarse grain material has a lower ability to absorb water but higher in term of its mass. Hence, the value of moisture content (w) of Silty SAND was lower than Clayey SILT but higher in term of bulk density which caused by a higher mass of coarse particle and also the present of water. Generally, both types of soils have demonstrated different variation of moisture content and density due to the dissimilarity composition of grain sizes fraction.
3.3. Behaviour of electrical resistivity value due to the basic physical properties of soil
This study has demonstrated the relationship of Clayey SILT and Silty SAND due to the grain size fraction, moisture content, density and variations. The behaviour of the ERV due to the BPP were also being analyzed and presented using statistical regression method in Figure 3 and 4.
Based on Table 1, it was found that the ERV of Silty SAND (600 – 7300 Ωm) was higher than Clayey SILT (13 - 7700 Ωm). Based on grain size fraction, Silty SAND was dominantly composed from coarse soil (60.09 %) while Clayey SILT was mainly composed from fine soil (60.09 %). According to previous research, the ease of current to propagate within each geomaterial can be
AeroEarth 2014 IOP Publishing
influenced by grain size fraction as fine particle will allowed current to easily propagate thus producing low resistivity value while coarse grain fraction will produced high resistivity value due to the difficulty of current propagation. According to [19], current may propagate in geomaterials based on electrolysis conduction where the propagation is by ionic conduction from amount and conductivity of dissolved minerals present. In mineral composition of soil, Clayey SILT has a higher composition of fine soil with particular reference to clay minerals such as kaolinite, illite, montmorillonite and vermiculite which allowed the ease of the current propagation in the soil tested thus producing low resistivity value compared to the Silty SAND which has low composition of clay with high composition of coarse soil. Furthermore as reported by [20], resistivity data exhibits a low value for a fine soil such as clayey and silty while the coarser soil such as sand and gravel will produce a higher resistivity value.
Based on this study, soil moisture content and density has demonstrated great influence to the behaviour of ERV. It was found that both correlations (ERV with w and ρbulk) showed a curvilinear trend as given in Figure 3 and 4. According to Figures 3 and 4, moisture content and bulk density value was higher with the decrease of soil electrical resistivity value due to the presence of more water content in soil tested. This finding confirmed the past findings which indicated the moisture content value will increase with the decreasing of soil resistivity value [21] – [25] which can be represented using general relationship of ERV ∞ 1/w. When water was added continuously from dry soil until it reach saturated and oversaturated condition, the ease of current propagation in soil will be increased, thus producing a high to low resistivity value. As reported by [24], ions in pore fluid finds hard to propagate in the low moisture content soil thus producing a low soil conductivity which will cause an increasing of resistivity value. The ability of Clayey SILT to absorbed more water (16 – 100 %) due to its high quantity of fine soil (Clay and Silt) has greatly influenced to dropped the ERV value compared to the Silty SAND which has less fine soil (lower water absorbance (17.66 – 61.07 %) due to less fine soil with high coarse soil). Hence, the ERV of Clayey SILT can be obtained lower than Silty SAND due to its higher water absorbance ability which related to the composition of the soil particle.
Both soils were tested under loose condition which influenced the ERV due to its varying soil density. Generally, both soils were demonstrated that ERV was high at low soil density and vice versa. This condition has shown that under low soil density, soil porosity was filled by air thus producing high ERV. According to [13], air filled void posses a higher resistivity value compared with the water filled void. Both soils were tested from dry–moist–saturated–oversaturated condition using 1-3 % of water continuously until 25 times under loose condition. The quantity of water was greatly increased thus increasing the soil bulk density which finally produced low ERV when the experiment has passed the dry-moist state at saturated-oversaturated condition. Clayey SILT composed of higher fine grain particles was able to absorb more water compared to the Silty SAND. Hence, this phenomenon was possibly has affected the relationship between ERV and densities. Commonly, it was expected that the ERV was supposedly to be high due to the higher soil densities. However in Clayey SILT, this hypothesis was unsuccessfully due to the presence of more water within the fine soils with particular reference to clay and silt particles. Hence in Clayey SILT case, higher density was associated with a higher moisture content thus producing a low ERV which can be represent by ERV ∞ 1/ρ. In other words, the higher moisture content causes easily a flow of current within the soil which finally produced a lower ERV. However the value for soil density of Clayey SILT was lower than Silty SAND due to its higher quantity of fine soil. A higher ERV will be produced due to the higher value of soil densities which associated by higher quantity of granular soil with particular reference to gravel particles demonstrated by Silty SAND. As reported by [26], the bulk resistivity of soil will increase with the grain size increment since it offers more resistance to the ionic current flow. Moreover, higher granular soil will produced lower moisture content which also contributes to the increasing of ERV. Hence, general relationship between ERV and soil densities of Gravelly SAND can be found as ERV ∞ ρ.
AeroEarth 2014 IOP Publishing
This study found that the ERV will continuously decrease as water was continuously added. Despite an overall continuous decrease in resistivity value, a small inconsistency of value reduction from high to low was also recorded. This inconsistency ERV was caused by small inconsistent quantity of soil tested for each percentage of water added due to the difficulty of soil handling from dry-moist-saturated-oversaturated. The experiment was carefully performed by filling the soil (mixed thoroughly with water) inside the box without being compacted (loose condition) with the lowest possible void left. However, the workability of soil inside the box was difficult especially when it was at moist to saturated state where the soil was in a highly cohesive condition. The problems continued when it reached saturated to oversaturated state where the quantity of soil tested can be varies due to the large quantity of water added. Furthermore in some cases, those relationships presented will turn inversely especially when the properties obtained were almost similar to each other. Hence, other major non similar properties will take placed to influence the field ERV. Based on [24], detailed study related to the field condition such as porosity, degree of saturation, salt concentration in pore fluid, grain size, size gradation, temperature and activity can produce more accurate correlation performed from the laboratory experiment.
[image:6.595.88.509.471.706.2]Resistivity value was highly influenced by pore fluid and grain matrix of geomaterials [27]. As reported by [28], a soil’s ERV generally varies inversely proportional to the water content and dissolved ion concentration as clayey soil exhibit high dissolved ion concentration, wet clayey soils have lowest resistivity of all soil materials while coarse, dry sand and gravel deposits and massive bedded and hard bedrocks have the highest ERV. Furthermore a decrease of ERV was results from an increased of metal ions or inorganic elements in geomaterials [29]. According to [30], soil parameters determined in grain size analysis could replicate the variety of resistivities obtained on the site very well. Hence, this study was able to explained varying values due to the variation of selected soil physical state. In other words, BPP can strongly influence the field ERV due to soil composition variation such as relative to the quantity of solid, air and water.
Table 1. ERV and basic physical properties of soil.
Soil Type Clayey SILT Silty SAND
Electrical resistivity value,
ρ (Ωm) 13 - 7700 600 - 7300
Moisture content, w (%) 7.76 - 100 17.66 – 61.07
Bulk density, ρbulk (Mg/m3) 1.00 – 1.69 1.77 – 2.66
Particle size analysis, d
(μm – mm, %) Clay Silt Sand Gravel Clay Silt Sand Gravel
24.82 54.08 16.51 4.59 3.40 36.51 47.35 12.74
78.90 21.10 39.91 60.09
Atterberg limit (%) LL PL PI LL PL PI
51.90 39.80 12.10 38.40 31.15 7.25
AeroEarth 2014 IOP Publishing
Figure 2. PSD curve for Clayey SILT and Silty SAND from dry and wet sieve analysis.
w = 109.98x-0.268
R² = 0.8927
0.00 20.00 40.00 60.00 80.00 100.00 120.00
0 2000 4000 6000 8000 10000
M o ist u r e C o n te n t, w ( %)
Soil Electrical Resistivity, ρ (Ωm)
Moisture Content vs Resistivity
Power (Cla yey SILT)
ρ = -0.111ln(x) + 1.7605 R² = 0.7318
0.00 0.20 0.40 0.60 0.80 1.00 1.20 1.40 1.60 1.80
0 2000 4000 6000 8000 10000
B u lk D e n si ty , ρbu lk (M g /m 3)
Soil Electrical Resistivity, ρ (Ωm) Bulk Density vs Resistivity
[image:7.595.106.492.341.502.2]Power (Cla yey SILT)
Figure 3. Moisture content (left) and density (right) correlation with ERV for Clayey SILT.
w = 638.8x-0.418
R² = 0.5643
0.00 10.00 20.00 30.00 40.00 50.00 60.00 70.00
0 2000 4000 6000 8000
M o ist u r e C o n te n t, w ( %)
Soil Electrical Resistivity, ρ (Ωm)
Moisture Content vs Resistivity
Power (Silty SAND)
ρ = 2.6188e-6E-05x
R² = 0.8511
0.00 0.50 1.00 1.50 2.00 2.50 3.00
0 2000 4000 6000 8000
B u lk D e n si ty , ρbul k (M g /m 3)
Soil Electrical Resistivity, ρ (Ωm)
Bulk Density vs Resistivity
Expon. (Silty SAND)
Figure 4. Moisture content (left) and density (right) correlation with ERV for Silty SAND.
AeroEarth 2014 IOP Publishing
[image:7.595.110.494.560.728.2]Conclusion
The ERV from laboratory test was successfully established on Clayey SILT and Silty SAND soil. The ERV was largely influenced by the variations of basic physical properties of soil. This study has reduced few of the black boxes (uncertainties) of the ERV interpretation ambiguity based on BPP influences with particular reference to grain size fraction, moisture content and density of soil. This study has demonstrated that the integration between ERV with BPP can contribute a meaningful contribution especially during the interpretation stage since it was able to explained and justify the behaviour of ERV based on BPP quantitative approach.
Acknowledgments
This work was funded by Universiti Tun Hussein Onn Malaysia (ERGS from vote 40) and Universiti Sains Malaysia. First author wish to acknowledge gratefully to supervisors and research members for their tremendous guidance, work and cooperation.
References
[1] Abidin M H Z, Ahmad F, Wijeyesekera D C, Saad R and Baharuddin M F T 2013 Soil Resistivity Measurements to Predict Moisture Content and Density in Loose and Dense Soil Applied Mechanics and Materials. 353-356 911-917
[2] Godio A, Strobbia C and De Bacco G 2006 Geophysical Characterisation of a Rockslide in an Alpine Region, Engineering Geology.83 273-286
[3] Mauritsch H J, Seiberl W, Arndt R, Römer A, Schneiderbauer K and Sendlhofer G P 2000 Geophysical Investigations of Large Landslides in the Carnic Region of Southern Austria,
Engineering Geology. 56 373-388
[4] Fragaszy R, Santamarina J, Amekudzi A, Assimaki D, Bachus R, Burns S, Cha M, Cho G, Cortes D, Dai S, Espinoza D, Garrow L, Huang H, Jang J, Jung J, Kim S, Kurtis K, Lee C, Pasten C, Phadnis H, Rix G, Shin H, Torres M and Tsouris C 2011 Sustainable development and energy geotechnology — Potential roles for geotechnical engineering KSCE Journal of Civil Engineering. 15 611-621
[5] Clayton C R I, Matthews M C and Simons N E 1995 Site Investigation (UK: Blackwell Science Ltd)
[6] Khatri R, Shrivastava V K and Chandak R 2011 Correlation between vertical electric sounding
and conventional methods of geotechnical site investigation Int. Journal of Advanced
Engineering Sciences and Technologies.4042-053
[7] Liu C and Evett J B 2008 Soils and Foundation (New Jersey: Pearson International)
[8] Godio A, Strobbia C and De Bacco G 2005 Geophysical characterisation of a rockslide in an alpine region Engineering Geology. 83 273-286
[9] Cosenza P, Marmet E, Rejiba F, Jun Cui Y, Tabbagh A and Charlery Y 2006 Correlations between geotechnical and electrical data: A case study at Garchy in France Journal of Applied Geophysics.60 165-178
[10] Saad R, Muztaza N M and Mohamad E T 2011 The 2D Electrical Resistivity Tomography (ERT) Study for Civil and Geotechnical Engineering Purposes Electronic Journal of Geotechnical Engineering.16 1537-1545
[11] Hamzah U, Samsudin A.R and Malim E P 2007 Groundwater investigation in Kuala Selangor
using vertical electrical sounding (VES) surveys Environmental Geology.51 1349-1359
[12] Hamzah U, Yaacup R, Samsudin A. R and Ayub M S 2006 Electrical imaging of the
Groundwater Aquifer at Banting, Selangor, Malaysia Environmental Geology.49 1156-1162
[13] Jusoh Z 2010 Application of 2-D resistivity imaging and seismic refraction technique in subsurface investigation for civil engineering, M.S. thesis, Sch. Physics, Science Univ., Penang, Malaysia
[14] Solberg I L, Hansen L, Rønning J S, Haugen E D, Dalsegg E and Tønnesen J 2011 Combined Geophysical and Geotechnical Approach to Ground Investigations and Hazard Zonation of a
AeroEarth 2014 IOP Publishing
Quick Clay Area, Mid Norway Bulletin of Engineering Geology and the Environment. 71 119-133
[15] Abidin M H Z, Wijeyesekera D C, Saad R and Ahmad F 2013 The Influence of Soil Moisture Content and Grain Size Characteristics on its Field Electrical Resistivity Electronic Journal of Geotechnical Engineering. 18/D 699-705
[16] British Standard 1377 1990 Methods of test for Soils for Civil Engineering Purposes
[17] Burger H R, Sheehan A F and Jones C H 2006 Introduction to Applied Geophysics (New York: W.W. Norton & Company)
[18] Anita T, 2005 Water content and porosity estimated from ground-penetrating radar and resistivity Journal of Applied Geophysics.58 99-111
[19] Telford W M, Geldart L P and Sheriff R E 1990 Applied Geophysics (Cambridge: Cambridge University Press)
[20] Abidin M H Z, Saad R, Ahmad F, Wijeyesekera D C and Baharuddin M F T 2012 Integral Analysis of Geoelectrical (Resistivity) and Geotechnical (SPT) Data in Slope Stability Assessment Academic Journal of Science.1 305-316
[21] Siddiqui F I and Osman S B A S 2012 Integrating Geo-Electrical and Geotechnical Data for Soil Characterization International Journal of Applied Physics and Mathematics.2 104-106 [22] Ozcep F, Yildirim E, Tezel O, Asci M and Karabulut S 2010 Correlation between electrical
resistivity and soil-water content based artificial intelligent techniques International Journal
of Physical Sciences.5(1) 047-056
[23] Cosenza P, Marmet E, Rejiba F, Cui Y J, Tabbagh A and Charlery Y 2006 Correlations between geotechnical and electrical data: A case study at Garchy in France Journal of
Applied Geophysics.60 165-178
[24] Rinaldi V A and Cuestas G 2002 Ohmic Conductivity of a Compacted Silty Clay Journal of
Geotechnical and Geoenvironmental Engineering. 128(10) 824-835
[25] Tezel O and Ozcep F 2003 Relationships of electrical resistivity and geotechnical parameters,”
Proc. Conf. on Earth Sciences and Electronics(Istanbul, Turkey, 2003)
[26] Sudha, K., Israil, M., Mittal, S. and Rai, J., Soil characterization using electrical resistivity tomography and geotechnical investigations. Journal of Applied Geophysics, Vol. 67, 2009, pp. 74-79.
[27] Griffiths D H and King R F 1981 Applied Geophysics for Geologist and Engineers-The Element of Geophysical Prospecting (Oxford: Pergamon Press)
[28] Liu C and Evett J B 2008 Soils and Foundation (New Jersey: Pearson International)
[29] Jung Y, Lee Y and Ha H 2000 Application of Electrical Resistivity Imaging Techniques to Civil and Environmental Problems Use of Geophysical Methods in Construction
[30] Friedel S, Thielen A and Springman S M 2006 Investigation of a slope endangered by rainfall-induced landslides using 3D resistivity tomography and geotechnical testing Journal of Applied Geophysics.60 100-114
AeroEarth 2014 IOP Publishing