ANALYSIS OF DELAY SPREAD IN MULTILAYER DIFFUSION-BASED
MOLECULAR COMMUNICATION (DBMC) CHANNEL
Saizalmursidi Md Mustam
1, 2and Sharifah Kamilah Syed Yusof
21
Department of Communication Engineering, Faculty of Electrical and Electronic Engineering, Universiti Tun Hussein Onn Malaysia (UTHM), 86400 Parit Raja, Batu Pahat, Johor, Malaysia
2
UTM-MIMOS Centre of Excellence in Telecommunication Technology, Faculty of Electrical Engineering, Universiti Teknologi Malaysia (UTM), 81310 UTM Johor Bahru, Johor, Malaysia
E-Mail: [email protected]
ABSTRACT
Nowadays, diffusion-based molecular communication (DBMC) is gaining recognition as a new physical layer option for nanoscale communication between bio-nanomachines, particularly for emerging applications in biomedical and healthcare. Although numerous studies have been conducted to evaluate and analyse DBMC system to date, investigation on multilayer DBMC channels still has had less attention in the literature. This paper presents an investigation of the delay spread in a multilayer DBMC channel. The results indicate that the delay spread is depending on the averaged diffusion coefficient, transmission distance and the data rate of transmitted bits, but not on the total number of transmitted molecules.
Keywords: nanoscale communication, molecular communication, multilayer diffusion, delay spread.
1. INTRODUCTION
Rapid developments of nanotechnology in biomedical applications, including nanomedicine, tissue engineering, nanorobots, bio-sensor, bio-marker, and implant technologies have provided the possibilities for an intelligent system for disease detection and spontaneous targeted drug-delivery in the treatment of human diseases. Currently, a large number of nanosystems for drug-delivery systems have been investigated by researchers in the literature, including liposomes (Allen and Cullis, 2013), dendrimers (Zhu and Shi, 2013), metallic nanoparticles (Kogan et al., 2007), polymeric nanoparticles (Kamaly et al., 2012), carbon nanotubes (Moore et al., 2013) and nanowires (Pondman et al., 2015). In these intelligent systems, a group of bio-nanomachines embedded in the human body are expected to communicate and cooperatively share information using molecular signals among each other or with the surrounding cells to perform a specific function such as identifying the target locations and automatically control the amount and time of drug release. Thus, communication process among bio-nanomachines plays an important role during the detection and gathering of information molecules inside the body.
Recently, researchers have shown considerable interest in the diffusion-based molecular communication (DBMC) model for realising communication among nanomachines. A comprehensive overview of the DBMC process is addressed in (Nakano et al., 2012), (Akyildiz, Brunetti and Blaquez, 2008). The concept of body area nanonetworks with DBMC for healthcare applications is discussed in (Atakan, Akan and Balasubramaniam, 2012). Calcium signalling based on the exchange of calcium ions (Ca2+) technique is proposed for intra- and inter-cellular communication (Carafoli, 2002). Moreover, several research efforts on mathematical models of the general DBMC channel can be found in (Pierobon and Akyildiz, 2010), (Kilinc and Akan, 2013), (Llatser et al., 2013).
Although DBMC has been the focus of considerable attention, the existing studies are limited to the propagation of molecules in a single channel. In practice, the diffusion process can occur through multiple channels, for example, through an alveolar-blood barrier, the stomach-blood barrier and the blood-brain barrier. Therefore, modelling and analysing multilayer diffusion are important to support future biomedical applications such as to control and regulate the release of drugs over a multilayer barrier environment in living tissue.
A tissue, particularly an arterial wall which has the different material properties in each layer is commonly modelled as a multilayered medium (McGinty, 2014). To the best of our knowledge, there are limited works have been reported throughout the literature to evaluate and analyse the performance of a multilayer DBMC channel. In (Md Mustam, Syed Yusof and Nejatian, 2015), a closed-form expression for the mean molecular concentration, channel impulse response, mean number of received molecules, channel time delay and channel attenuation for a multilayer DBMC channel has been derived and evaluated. The aim of this paper is to analyse the effects of the averaged diffusion coefficient, transmission distance, the total number of transmitted molecules, and the data rate of transmitted bits on the channel delay spread in a multilayer DBMC channel.
The rest of this paper is organized as follows: Section 2 presents the model of a multilayer DBMC system considered, followed by Section 3 discussing the performance evaluation of the channel delay spread. Finally, Section 4 concludes the paper.
2. A MULTILAYER DBMC SYSTEM
2.1 System Model
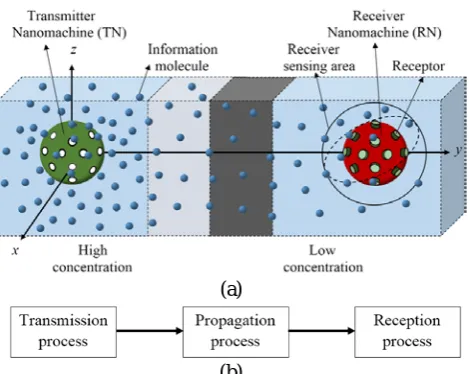
information molecules from the TN to the RN as shown in Figure 1. Generally, the TN transmits the encoded information molecules to the propagation medium or channel in the form of different amplitude levels of molecules, different types of molecule sequences or different time shifts of a pulse transmission (Nakano et al., 2012). The transmitted information molecules are then propagated over multiple channels from the TN to the RN through a free or passive diffusion. In free diffusion, the propagation of molecules is modelled as Brownian motion (random walk) and can be characterised by using Fick's laws of diffusion (Berg, 1993) and (Crank, 1975). At the reception process, receptors on RN surface will detect and bind the available transmitted information molecules at the receiver sensing area. Then, the RN decodes the bound information molecules upon reception by producing an output signal in the form of chemical reaction, by producing other molecules or by performing a simple action (Nakano et al., 2012). However, modelling of the binding and decoding processes is beyond the scope of this work because an accurate view of the physics of the reception phenomenon used by living cells, such as the ligand-receptor binding kinetics, is required (ShahMohammadian, Messier and Magierowski, 2013).
In this paper, a point-source type of TN transmits
Q0 number of molecules to the propagation medium representing bit ‘1’ and no molecules indicating bit ‘0’. An amplitude detection scheme is considered, in which the RN receives a bit ‘1’ if the maximum mean number of received molecules is above the threshold level. Otherwise, the RN receives a bit ‘0’. Moreover, RN is modelled as a point and a passive observer.
(a)
[image:2.595.53.288.481.668.2](b)
Figure 1: A unicast multilayer diffusion-based molecular communication system: (a) a graphical representation and
(b) a block diagram of the communication process. 2.2 Mean Molecular Concentration at the RN Location
According to Fick’s second law of diffusion, the mean concentration of information molecules in molecules per unit volume at the position r, changing with time t, and propagating across n-layers channel, is given by (Md Mustam, Syed Yusof and Nejatian, 2015):
∂ ∂ ∂ ∂ = ∂ ∂ r t r c r D t t r c av ) , ( ) , ( (1)
where c(r,t) is the molecular concentration in molecules/m3, r is distance in m, t is time in s, ∂c(r,t)/∂t is the time rate changes in molecular concentration, ∂c(r,t)/∂r
is the molecular concentration gradient and Dav is the averaged diffusion coefficient of multiple channels in series.
Under the consideration of the unity partition coefficient and a perfect contact between the two different layers, the averaged diffusion coefficient is given by (Md Mustam, Syed Yusof and Nejatian, 2015):
n i D f D n i i i
av 1,2,3,...
-1 1 = =
∑
= (2)where i represent the number of layers that can take the value of 1, 2, 3,… n, fi is the fraction of the i-layer, and Di is the i-layer diffusion coefficient.
For an impulsive transmission of molecules, Q0
δ(t) at time t equals to zero in an infinite volume medium; the solution of eqn. (1) is obtained as follows (Md Mustam, Syed Yusof and Nejatian, 2015):
∑
= − = =∑
n i i i D f t r n i i i e t D f Q t r c 1 2 4 2 3 1 -1 0 4 ) , (π
(3)where δ(t) is the Dirac delta function, Q0 is the total number of transmitted molecules, and r2 = x2 + y2 + z2 in the Cartesian coordinate system.
In a linear system, the output concentration is simply the convolution of the input transmission signal with the channel impulse response, eqn. (3) can then be written as: ) , ( ) ( ) ,
(rt Q0 t hr t
c = δ ∗ (4)
where Q0δ(t) is the input transmission signal, and h(r,t) is the channel impulse response given by:
∑
= − = =∑
n i i i D f t r n i i i e t D f t r h 1 2 4 2 3 1 -1 4 1 ) , (π
(5) [image:2.595.351.515.658.730.2]
∫
∑
=
− −
=
∑
=
− =
∗ =
t tr Df
n
i i
i
d e
t D
f Q t r h t Q t r c
n
i i i
0
) ( 4 2 3 1
-1
1 2
) ( 4
) (
) , ( ) ( ) , (
t
t t
t π
t
(6)
where τ is the variable of integration, Q(t) is the input transmission signal or the transmission rate of molecules, and 1/tb is the data rate of the transmitted bits (Mahfuz, Makrakis and Mouftah, 2011).
2.3 Channel Delay Spread
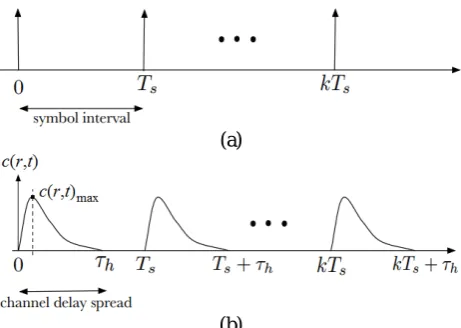
Channel delay spread, τh, as shown in Figure 2 refers to the time duration over which the molecular concentration, c(r,t), drops below a specific threshold level below the maximum peak, c(r,t)max (ShahMohammadian, 2013). It plays an important role in determining the symbol duration or interval, Ts, particularly in the transmission of a sequence message signal to avoid inter-symbol interference (ISI). In this paper, 10 dB below the maximum peak is considered to be the threshold level as proposed in (ShahMohammadian, 2013).
By subtracting the two time instants at which the mean molecular concentration, c(r,t), is equal to one-tenth of its maximum peak, c(r,t)max, the delay spread, τh for impulsive transmission of molecules over a multilayer channel is given by:
n i
D f r
n
i i
i
h 1.886 1,2,3,...
1
2 =
=
∑
=
t
(7)The effects of the averaged diffusion coefficient of a multilayer DBMC channel, transmission distance, the total number of transmitted molecules, and the data rate of transmitted bits on the channel delay spread will be presented and discussed in the following section.
(a)
(b)
Figure 2: (a) Impulse transmission sequencewith symbol interval, Tsand, (b) molecular concentration response due
to impulsive transmission onDBMC channel (ShahMohammadian, 2013).
3. PERFORMANCE EVALUATION
This section presents a simulation analysis of multilayer DBMC channel in terms of the averaged diffusion coefficient, transmission distance, the number of molecule transmission, and the bit rate of transmitted bits channel effects on delay spread. For simplicity, the air-water-blood plasma channel is chosen as the multilayer DBMC channel. The simplified cross sectional channel is shown in Figure 3. It is assumed that the interlayer between the alveolar-blood barrier is permeable by the transmitted information molecules. The standard values of diffusion coefficients for small-sized molecules in air, water and blood plasma are chosen to be 4.3 × 10⁻⁵ m2/s, 1 × 10⁻¹⁰ m2/s and 2.2 × 10⁻¹¹ m2/s, respectively (Mahfuz, Makrakis and Mouftah, 2011).
(a)
[image:3.595.310.542.289.433.2](b)
Figure 3:Multilayer diffusion:(a) alveolar-blood barrier (Boron and Boulpaep, 2012), and (b) the simplified
multilayer representation.
3.1 Effects of Multilayer DBMC Channel on the Channel Delay Spread
The effects of multilayer diffusion channel on the delay spread when the TN releases Q0 = 2×10⁵ molecules is shown in Figure 4. The total transmission distance and the distance for each layer are set to be 45 µm and 15 µm, respectively. For 3-layer channel with similar medium, particularly in water-water-water and blood-blood-blood media, the averaged diffusion coefficients are calculated to be 10 × 10-11 m2/s and 2.2 × 10⁻¹¹ m2/s, while 5.4 × 10⁻¹¹ m2/s for the air-water-blood medium (different medium). Under the consideration of 10 dB below the maximum peak as a threshold level, the values of channel delay spread, τh are 38.2 s, 70.7 s and 173.6 s for the water-water-water, air-water-blood and blood-blood-blood channels, respectively. The large value of the channel delay spread in a multilayer DBMC channel is due to the slow process of molecules diffusion. It can be observed from Figure 4 that, the higher the averaged diffusion coefficient, the shorter the channel delay spread and the faster the channel output response to decay.
[image:3.595.53.284.570.734.2]the level of 10 dB below the maximum peak is considered as the threshold level. This observation shows an interesting idea to help the engineers in developing the free ISI DBMC system.
Figure4:Normalized mean molecular concentration c(r,t) at the RN location (r = 45 µm) over the water-water-water
(Dwater-water-water), blood-blood-blood (Dblood-blood-blood) and air-water-blood (Dair-water-blood) media.
3.2 Effects of Transmission Distance on the Channel Delay Spread
[image:4.595.54.285.165.352.2]In order to evaluate the effects of transmission distance on the channel delay spread, three distances (22.5 µm, 30 µm and 45 µm) between the TN and RN are considered. Figure 5 shows the normalized mean molecular concentration profile at the RN location when 2 × 10⁵ molecules are transmitted by the TN over the air-water-blood medium for these three transmission distances. The length of each layer of the multilayer medium is set to have the same fraction.
Figure 5:Normalized mean molecular concentration c(r,t) at the RN location (r = 22.5 µm, r = 30 µm and r = 45 µm)
over the air-water-blood medium.
It can be observed in Figure 5 that increasing the transmission distance from 22.5 µm to 30 µm and 45 µm increases the channel delay spread from 17.66 s to 31.38 s, and 70.7 s, respectively. Moreover, doubling the transmission distance increases the channel delay spread fourfold, where the value increases from 17.66 s to 70.7 s when the distance is doubled from 22.5 µm to 45 µm. 3.3 Effects of the Number of Transmitted Molecules on the Channel Delay Spread
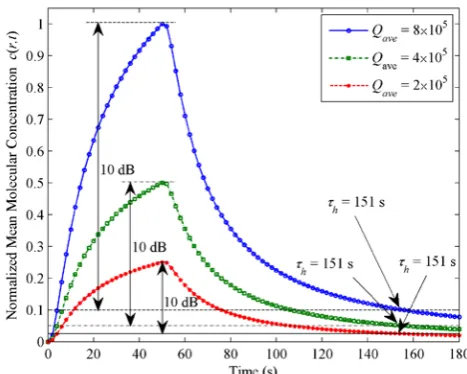
[image:4.595.312.545.313.502.2]Figure 6 and Figure 7 show the effects of the different number of transmitted molecules on the channel delay spread over the air-water-blood medium for impulsive and square pulse transmissions, respectively. In general, increasing the number of molecules increases the maximum peak of mean molecular concentration; however, the channel delay spread remains unchanged.
Figure 6:Normalized mean molecular concentration c(r,t) at the RN location (r = 45 µm) over the air-water-blood
medium for impulsive transmissions.
Figure 7: Normalized mean molecular concentration c(r,t) at the RN location (r = 45 µm) over the air-water-blood
[image:4.595.311.545.557.744.2]In an impulsive transmission as shown in Figure-6, doubling the total number of transmitted molecules, Q0 from 2 × 10⁵ to 4 × 10⁵ and then from 4 × 10⁵ to 8 × 10⁵, increases the peak of the normalized mean molecular concentration twofold. The peaks increase from 0.25 (0.68 × 10⁸ molecules/mm3) to 0.5 (1.36 × 10⁸ molecules/mm3) and from 0.5 (1.36 × 10⁸ molecules/mm3) to 1 (2.72 × 10⁸ molecules/mm3). But, the channel delay spread remains unchanged from 70.7 s. The same trend of increasing peak of the normalized mean molecular concentration and unchanging the channel delay spread value can also be observed in Figure 7. In a continuous transmission of average molecules, Qave for a short duration of tb = 50 s, doubling the average number of molecule transmission
Qave from 2 × 10 5
to 4 × 10⁵ and then from 4 × 10⁵ to 8 × 10⁵, increases the peak of the normalized mean molecular concentration twofold. The peaks increase from 0.25 (2.1 × 10⁹ molecules/mm3) to 0.5 (4.2 × 10⁹ molecules/mm3) and then to 1 (8.4 × 10⁹ molecules/mm3) as can be seen in Figure 7. These peaks are higher in comparison to the peaks of the impulsive transmission due to the increments in the total number of transmitted molecules (Q0 is equal to Qave multiply bytb). Moreover, the value of the channel delay spread is maintained at 151 s.
3.4 Effects of the Data Rate of Transmitted Bits on the Channel Delay Spread
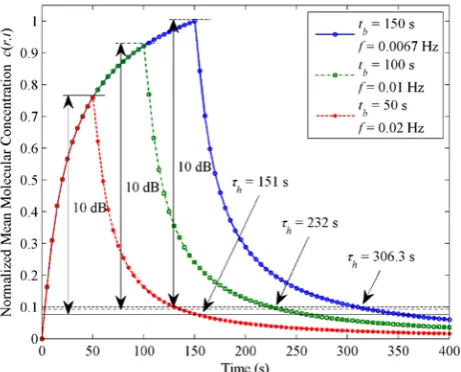
[image:5.595.55.286.556.742.2]In the section 2.3, f = 1/tb is defined as the data rate of transmitted bits, where tb is the pulse bit duration. In this section, three pulse bit durations (50 s, 100 s, and 150 s) are considered to analyse the effects of the data rate of transmitted bits on the channel delay spread. According to Figure 8, the smaller the data rate of transmitted bits, the longer the channel delay spread. At a bit duration of 50 s (f = 0.02 Hz), the channel delay spread is 151 s. Increasing the bit duration into 100 s (f = 0.01 Hz) and 150 s (f = 0.0067 Hz), increases the values from 151 s to 232 s, and 306.3 s, respectively.
Figure 8:Normalized mean molecular concentration c(r,t) at the RN location (r = 45 µm) over the air-water-blood medium for square pulse transmission with different tb.
4. CONCLUSIONS
This paper presented a simulation analysis of delay spread in a multilayer DBMC channel for an impulsive transmission and a square pulse transmission of information molecules through water-water-water, blood-blood-blood, and air-water-blood channels. It was found that, the higher the diffusion coefficient, the shorter the channel delay spread; the larger the transmission distance, the longer the channel delay spread; the smaller the bit data rate, the longer the channel delay spread. Moreover, doubling the transmission distance increases the channel delay spread fourfold. Increasing the number of transmitted molecules increases the peak of mean molecular concentration for both transmission schemes; however, the channel delay spread remains unchanged. Under the consideration of 10 dB below the maximum peak as the minimum threshold level, the value of channel delay spread for impulsive transmission can be calculated by 11.3 times the time delay. These results show an interesting insight as guidance in the development and fabrication of future artificial nanocommunication and networks systems involving a multilayer of media.
ACKNOWLEDGEMENTS
The first author would like to thank the Ministry of Education, Malaysia, and the University Tun Hussein Onn Malaysia (UTHM) for the financial support in the form of a doctoral scholarship. The author would also like to thank the UTM-MIMOS Centre of Excellence for providing a very conducive workspace during the period of 2013 to 2016 to carry out this research work. This work is financially supported by the UTM GUP Research Grant (Vot No: Q.J1300000.2509.07H04).
REFERENCES
Akyildiz, I. F., Brunetti, F. and Blaquez, C. (2008). Nanonetworks: A new communication paradigm.
Computer Networks, 52(12), pp.2260-2279.
Allen, T. M. and Cullis, P. R. (2013). Liposomal Drug Delivery Systems: From Concept to Clinical Applications.
Advanced Drug Delivery Reviews, 65(1), pp.36-48.
Atakan, B., Akan, O. B. and Balasubramaniam, S. (2012). Body area nanonetworks with molecular communications in nanomedicine. IEEE Communications Magazine, 50(1), pp.28-34.
Berg, H. C. (1993). Random Walks in Biology. Princeton: Princeton University Press.
Boron, W. and Boulpaep, E. (2012). Medical Physiology. 2nd ed. Philadelphia, PA: Saunders.
Crank, J. (1975). The Mathematic of Diffusion. 2nd ed. Great Britain: Oxford University Press.
Kamaly, N., Xiao, Z., Valencia, P. M., Radovic-Moreno, A. F. and Farokhzad, O. C. (2012). Targeted Polymeric Therapeutic Nanoparticles: Design, Development and Clinical Translation. Chemical Society Reviews, 41(7), pp.2971-3010.
Kilinc, D. and Akan, O. B. (2013). Receiver Design for Molecular Communication. IEEE Journal on Selected
Areas in Communications, 31(12), pp.705-714.
Kogan, M. J., Olmedo, I., Hosta, L., Guerrero, A. R., Cruz, L. J. and Albericio, F. (2007). Peptides and Metallic Nanoparticles for Biomedical Applications.
Nanomedicine, 2(3), pp.287-306.
Llatser, I., Cabellos-Aparicio, A., Pierobon, M. and Alarcon, E. (2013). Detection Techniques for Diffusion-based Molecular Communication. IEEE Journal on
Selected Areas in Communications, 31(12), pp.726-734.
Mahfuz, M. U., Makrakis, D. and Mouftah, H. T. (2011). Characterization of Intersymbol Interference in Concentration-encoded Unicast Molecular Communication. 24th Canadian Conference on Electrical
and Computer Engineering (CCECE 2011). IEEE,
pp.164-168.
McGinty, S. (2014). A Decade of Modelling Drug Release from Arterial Stents. Mathematical Biosciences, 257, pp.80-90.
Md Mustam, S., Syed Yusof, S. K. and Nejatian, S. (2015). Multilayer Diffusion-based Molecular Communication. Transactions on Emerging
Telecommunications Technologies, DOI: 10.1002/ett.
2935.
Moore, T. L., Pitzer, J. E., Podila, R., Wang, X., Lewis, R. L., Grimes, S. W., Wilson, J. R., Skjervold, E., Brown, J. M., Rao, A. and Alexis, F. (2013). Multifunctional Polymer-Coated Carbon Nanotubes for Safe Drug Delivery. Particle & Particle Systems Characterization, 30(4), pp.365-373.
Nakano, T., Moore, M. J., Fang, W., Vasilakos, A. V. and Jianwei S. (2012). Molecular communication and networking: Opportunities and challenges. IEEE
Transactions on Nano Bioscience, 11(2), pp.135-148.
Pierobon, M. and Akyildiz, I. F. (2010). A Physical End-to-end Model for Molecular Communication in Nanonetworks. IEEE Journal on Selected Areas in
Communications, 28(4), pp.602-611.
Pondman, K. M., Bunt, N. D., Maijenburg, A. W., van Wezel, R. J. A., Kishore, U., Abelmann, L., ten Elshof, J.
E. and ten Haken, B. (2015). Magnetic Drug Delivery with FePd Nanowires. Journal of Magnetism and Magnetic Materials, 380, pp.299-306.
ShahMohammadian, H. (2013). System design for
nano-network communications. Ph.D. Thesis. University of
Calgary.
ShahMohammadian, H., Messier, G. G. and Magierowski, S. (2012). Optimum Receiver for Molecule Shift Keying Modulation in Diffusion-based Molecular Communication Channels. Nano Communication Networks, 3(3), pp.183-195.
ShahMohammadian, H., Messier, G. G. and Magierowski, S. (2013). Nano-machine molecular communication over a moving propagation medium. Nano Communication Networks, 4(3), pp.142-153.
Zhu, J. and Shi, X. (2013). Dendrimer-based Nanodevices for Targeted Drug Delivery Applications. Journal of