MODELLING AND SIMULATION OF DRYING PROCESS FOR CERAMIC
MEMBRANE FABRICATION
ONG TZE CHING
A thesis submitted in
fulfillment of the requirement for the award of the
Doctor of Philosophy
Faculty of Mechanical and Manufacturing Engineering
Universiti Tun Hussein Onn Malaysia
v
ABSTRACT
For ages, ceramic properties and structure is known for its brittleness and its failure
such as cracking and warping. This weakness also relates to the high sensitivity of
ceramic to any thermal gradient effects. Therefore, processing steps of green body of
ceramic is crucial especially in membrane fabrication that has a multilayer structure to
ensure the efficiency of its applications. Thus, every step of ceramic membrane
preparation and fabrication needs careful control and monitoring to fulfil these aims.
Drying is one of the main problems that is always associated with the cracks and
leakages of the ceramic membrane. In fact, the drying process is one of the longest
steps corresponding to various evolutions of parameters during the evaporation
process. Due to the limitation in experimental or empirical ability to determine the
changes of dynamic critical variables during drying, modelling and simulation seems
to be the right option to determine and investigate these nonlinear and dynamic
variables and will be the focus of this study. This two-dimensional mathematical
modelling approach is able to predict the changes of variables in heat and mass transfer
during the drying process. The governing system of fully coupled non-linear partial
differential equations of the model was derived from a mechanistic approach where
the mass and energy conservation laws are defined for a particular phase into which
Darcy’s law and Fick’s law are substituted. A fully implicit algorithm has been
employed for numerical solution using the finite element method in which the Galerkin
weighted residual method is used in the spatial discretization and a backward finite
difference time-stepping scheme is employed for time integration. The ability of this
improved model is not restricted to a single homogenous layer of hygroscopic and
non-hygroscopic material, but on the novelty to incorporate multilayer heterogeneous
material properties as a membrane structure. A good agreement obtained by respective
validation works suggested that the model development and implementation are
satisfactory. Subsequently, case studies involving single layer and multilayer have
produced reasonable accuracy at all times. The application of the model at various
case studies involves a convective and enhanced intermittent drying mode which
demonstrates the robustness and trustworthiness in predicting and optimising the
vi
ABSTRAK
Ciri-ciri dan struktur seramik dikenali dengan sifat kerapuhan dan kegagalannya
seperti keretakan dan meleding sejak berzaman lagi. Kelemahan ini juga dikaitkan
dengan sensitivitinya terhadap sebarang perubahan haba. Oleh itu, langkah-langkah
pemprosesan jasad hijau seramik adalah penting terutamanya dalam fabrikasi
membran yang mempunyai pelbagai struktur lapisan dalam memastikan kecekapan
aplikasinya. Justeru, langkah-langkah penyediaan dan fabrikasi membran seramik
memerlukan kawalan dan pemantauan yang teliti bagi mencapai matlamat tersebut.
Pengeringan adalah salah satu masalah utama yang seringkali dikaitkan dengan
keretakan dan kebocoran membran seramik. Tambahan pula, proses pengeringan
melibatkan tempoh masa yang sangat lama rentetan daripada pelbagai evolusi
parameter semasa proses penyejatan. Disebabkan batasan keupayaan eksperimen atau
empirikal untuk menentukan perubahan pembolehubah kritikal dinamik semasa
pengeringan, pemodelan dan simulasi menjadi pilihan yang betul dalam menentukan
dan menyiasat pembolehubah tidak sejajar serta dinamik dan akan menjadi fokus
kajian ini. Pendekatan pemodelan matematik dua dimensi ini dapat meramalkan
perubahan pembolehubah dalam haba dan pemindahan jisim semasa proses
pengeringan. Sistem pengolahan dengan persamaan pembezaan separa bukan linear
penuh yang diperoleh daripada pendekatan mekanistik dimana hukum pemuliharaan
jisim dan tenaga ditakrifkan untuk fasa tertentu untuk digantikan dengan hukum Darcy
dan hukum Fick. Satu algoritma tersirat penuh digunakan untuk penyelesaian berangka
yang menggunakan kaedah unsur terhingga dimana kaedah pemberat Galerkin
digunakan dalam diskritasi ruang dan skim perbezaan terhingga masa-loncatan ke
belakang digunakan untuk integrasi masa. Kemampuan model ini tidak terhad kepada
satu lapisan homogen bahan higroskopik dan bukan higroskopik, tetapi pada
keupayaan yang novel dalam menggabungkan sifat heterogen bahan pelbagai lapisan
sebagai struktur membran. Satu persetujuan yang baik telah dicapai daripada
kerja-kerja pembuktian yang mencadangkan pembangunan dan pelaksanaan model adalah
memuaskan. Sejurus itu, kajian kes yang melibatkan lapisan tunggal dan berlapis telah
menghasilkan ketepatan yang munasabah pada setiap masa. Aplikasi model dalam
pelbagai kajian kes melibatkan pengeringan perolakan serta mod pengeringan sekala
yang dimajukan menunjukkan keteguhan dan kebolehpercayaan dalam meramal dan
vii
CONTENTS
TITLE
i
DECLARATION
ii
DEDICATION
iii
ACKNOWLEDGEMENT
iv
ABSTRACT
v
ABSTRAK
vi
CONTENTS
vii
LIST OF TABLES
xii
LIST OF FIGURES
xiii
LIST OF ABBREVIATIONS
xviii
LIST OF SYMBOLS
xix
LIST OF APPENDICES
xxiv
CHAPTER 1 INTRODUCTION
1
1.1
Research background
1
1.2
Problem statement
7
1.3
Research objective
8
1.4
Scopes
8
1.5
Research contributions
9
1.6
Structure of the thesis
10
CHAPTER 2 LITERATURE REVIEW
12
2.1
Introduction
12
2.2
Membrane structure
13
2.3
Preparation of ceramic membrane
14
2.4
Importance of drying process in ceramic membrane
preparation
16
viii
2.5.1 Drying period
17
2.5.2 Kinetic of dynamic drying diffusivity
21
2.5.3 Drying in non-hygroscopic and hygroscopic
materials
22
2.5.4 Drying shrinkage
23
2.5.5 Drying mode: stationary versus intermittent
26
2.6
Transport properties of porous material
29
2.6.1 Material properties
30
2.6.1.1 Density
30
2.6.1.2 Porosity
30
2.6.1.3 Liquid and vapour permeability
31
2.6.1.4 Thermal conductivity and specific
heat
31
2.6.1.5 Physical properties of hygroscopic
and non-hygroscopic ceramic
32
2.6.1.6 Physical properties of liquid water
33
2.6.1.7 Physical properties of gas
33
2.6.1.8 Capillary mechanism
34
2.6.1.9 Water retention curve
35
2.6.2
Various transport mechanism in porous
media
40
2.6.2.1 Darcy flow for liquid due to gas
and capillary pressures
40
2.6.2.2 Darcy flow for gases due to gas
pressure
41
2.6.2.3 Fick diffusion for vapour flow
41
2.6.2.4 Bound water flow
42
2.6.2.5 Fourier conduction heat transfer
42
2.6.2.6 Convective heat transfer
43
2.6.2.7 Latent heat transfer
43
2.6.2.8 Dry gas transfer
44
2.7
Mathematical drying model
44
ix
CHAPTER 3 THEORETICAL FORMULATION AND
NUMERICAL
METHOD
NUMERICAL METHOD
50
3.1
Introduction
50
3.2
Limitations and assumptions
51
3.3
Conservation of mass for water flow
52
3.4
Conservation of heat transfer
61
3.5
Dry Gas Transfer
65
3.6
Numerical solution
67
3.6.1 Spatial Discretisation using the Finite
Element Method
68
3.6.2 Incorporation of Boundary Conditions
75
3.6.3 Temporal Discretisation - Time Stepping
Algorithms
77
3.7
Algorithm flow chart
79
3.8
Background and model set-up
81
3.8.1 Case 1: Drying study on capillary suction
82
3.8.2 Case 2: Drying validation with Hall et al.[7]
work
82
3.8.3 Case 3: Drying validation with
Stanish et al. [46] work
83
3.8.4 Case 4: Drying study on bound water equation
84
3.8.5 Case 5: Drying validation with
Zhang et al. [10] work
85
3.8.6 Case 6: Drying validation with Przesmycki
and Strumillo[117] work
86
3.8.7 Case 7: Drying study on effect of material
parameter sensitivity
87
3.8.8 Case 8: Drying study on drying variables
evolution
88
3.8.9 Case 9: Drying validation with Or et al.[102]
work
89
3.8.10 Case 10: Drying study on membrane side
x
3.8.11 Case 11: Drying study on membrane top
surface drying
91
3.8.12 Case 12: Drying study on stationary drying
shrinkage
91
3.8.13 Case 13: Drying validation with Kowalski
and Pawlowski [16], [69] work
95
3.8.14 Case 14: Drying validation with
Manel et al. [68] work
96
3.8.15 Case 15: Drying study on intermittent
drying shrinkage
97
3.8.16 Case 16: Drying study on mesh sensitivity
99
CHAPTER 4 RESULTS AND DISCUSSION
102
4.1
Introduction
102
4.2
Case 1: Capillary suction for drying of hygroscopic
and non-hygroscopic material
104
4.3
Single layer ceramic
107
4.3.1 Drying of non-hygroscopic model
107
4.3.1.1 Case 2: Drying validation with
experimental
experimental data
data
108
4.3.1.2 Case 3: Drying validation with
experimental
experimental data and mathematical
model matica
model
109
4.3.2 Drying of hygroscopic model
111
4.3.2.1 Case 4: Bound water equation based
on different m
on different model
111
4.3.2.2 Case 5: Drying validation with
experimental
experimental data and mathematical
model above
model above irreducible level
112
4.3.2.3 Case 6: Drying validation with
mathematical
model below
mathematical model below
irreducible level
ucible level
irreducible level
114
4.3.3 Case 7: Effect of material parameter
sensitivity towards
xi
4.3.4 Case 8: Drying variables evolution for
hygroscopic and non-hygroscopic material
121
4.3.5 Drying diffusivity for hygroscopic and
non-hygroscopic material
124
4.4
Multilayer ceramic: membrane
126
4.4.1 Case 9: Drying validation with experimental
data: drying front movement
127
4.4.2 Case 10: Drying of side surface
129
4.4.3 Case 11: Drying of top surface
137
4.4.4 Case 12: Shrinkage: case study in stationary
drying technique
144
4.5
Intermittent drying technique
147
4.5.1 Case 13: Drying validation with experimental
data and mathematical model: with a varied
parameter and a fixed parameter
148
4.5.2 Case 14: Drying validation with mathematical
model: varying both parameters
150
4.5.3 Case 15: Shrinkage: case study in intermittent
drying technique
152
4.6
Case 16: Mesh sensitivity: coarse and finer mesh
domain
156
4.7
Summation of results
164
CHAPTER 5 CONCLUSIONS AND RECOMMENDATIONS
165
5.1
Conclusions
165
5.2
Recommendations
166
REFERENCES
168
APPENDIX A
181
LIST OF PUBLICATIONS
Error! Bookmark not defined.
xii
LIST OF TABLES
2.1
Physical properties of hygroscopic and
non-hygroscopic ceramic
33
2.2
Physical properties of liquid water
33
2.3
Physical properties of vapour and air
34
2.4
Fitting parameters in VG equation [83]
40
3.1
Fitting parameters in VG equation
82
3.2
Physical properties of the brick material
86
3.3
Physical properties of ceramic body and transport
parameter
89
3.4
Material properties of a clay material
92
3.5
Material properties
95
3.6
Physical properties of the Bentonite material
96
Table 2.2: Physical properties of liquid water1
33
Table 2.3: Physical properties of vapour and air2
34
Table 2.4: Fitting parameters in VG equation [83] 3
40
Table 3.1: Fitting parameters in VG equation 4
82
Table 3.2: Physical properties of the brick material 5
86
Table 3.3: Physical properties of ceramic body and transport parameter 6
89
Table 3.4: Material properties of a clay material 7
92
Table 3.5: Material properties 8
95
xiii
LIST OF FIGURES
1.1
Several stages in removal of water from between
clay particles during the drying process. (a) Wet
body. (b) Partially dry body. (c) Completely dry
body [11]
3
1.2
Schematic diagram of the drying of a ceramic
green body showing the weight loss and shrinkage
with time [12]
4
1.3
Warpage from drying a tile [13]
5
1.4
Contribution of current work {the insert figure is
contribution of previous work}
10
2.1
SEM micrograph of layered ceramic membrane
[1]
13
2.2
Schematic representation of an asymmetric
membrane [1]
14
2.3
Three step procedure for ceramic membranes [1]
15
2.4
Schematic view of phase exists in a porous
medium [23]
17
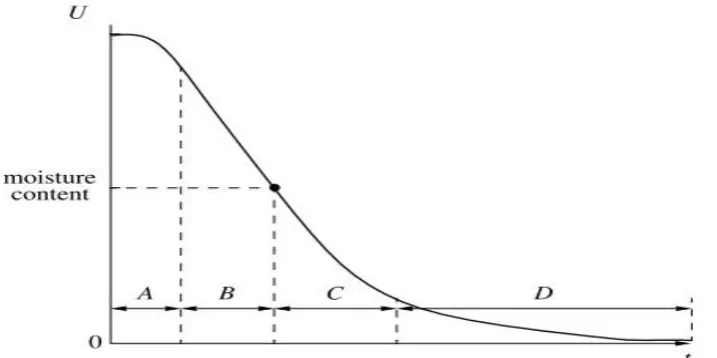
2.5
A typical moisture content profile. (A) Warm-up
period. (B) Constant rate period. (C) First falling
rate period. (D) Second falling rate period. [37]
18
2.6
Drying model [10]
20
2.7
Variations of effective diffusivity with moisture
content [43]
22
2.8
Volume shrinkage and drying rate of a ceramic
body [62]
25
2.9
Schematic drawing of ceramic crack initiation
process. (a) Initial fully saturated matrix. (b)
xiv
Water
–
air interface meniscus developed between
particles. (c) Tensile stress developed in the upper
layer. (d) Surface crack initiated.[63]
2.10
WRC for soils of different texture [79]
37
3.1
Eight-node quadratic quadrilateral element[95]
70
3.2
Overall model setup
80
3.3
Detail setup of AX
81
3.4
Mesh sample of the slab
88
3.5
Mesh of the ceramic membrane
90
3.6
Measured volume shrinkage results from
experiment for constant rate period
93
3.7
Measured volume shrinkage results from
experiment for falling rate period
93
3.8
Mesh of the slab
94
3.9
Intermittent drying configuration condition 1
(denoted as Bi)
98
3.10
Intermittent drying configuration condition 2
(denoted as Bii)
98
3.11
Domain used for single layer ((a),(b)), two layers
((c),(d)) and fine interlayer (e
100
4.1
Water retention curve: (a) comparison between
hygroscopic, non-hygroscopic and reference; (b)
comparison of clay and sand {the insert Figure is
typical WRC from [70]}
104
4.2
Sample plots: (a) with n = 0.6 and m = 2 (α
varies); (b) with m = 2 and α = 46 (n varies); (c)
with n = 0.6 and α = 46 (m varies)
106
4.3
Drying curve
109
4.4
Saturation curve
109
4.5
Temperature curve
110
4.6
Saturation curve for both model
112
4.7
Drying curve
113
xv
4.9
Water pressure distribution as a function of depth
and time; slab X, b) slab Y, c) slab Z
116
4.10
Gas pressure distribution as a function of depth
and time; a) slab X, b) slab Y, c) slab Z
118
4.11
Water saturation distribution as a function of
depth and time; a) slab X, b) slab Y, c) slab Z
120
4.12
Pore water pressure distribution as a function of
time
123
4.13
Temperature distribution as a function of time
123
4.14
Gas pressure distribution as a function of time
124
4.15
Variations of diffusivity with time. (a) Vapour
diffusivity. (b) Bound water diffusivity. (c) Liquid
diffusivity
125
4.16
(a) Initial condition for generated by current
model. (b) Saturation contour after 7 hours by
current model. (c) Initial condition of drying front
from experiment by Or et al [102]. (d) Drying
front movement after 7 hours by experiment by Or
et al [102]
128
4.17
Movement of drying from the top surface
129
4.18
Saturation contour at drying times of (a) 0 hour,
(b) 1 hour, (c) 2 hours, (d) 3 hours, (e) 4 hours (f)
5 hours 20 min
130
4.19
Pore gas pressure contour at drying times of (a) 0
hour, (b) 1 hour, (c) 2 hours, (d) 3 hours, (e) 4
hours (f) 5 hours 20 min
132
4.20
Temperature contour at drying times of (a) 0 hour,
(b) 1 hour, (c) 2 hours, (d) 3 hours, (e) 4 hours (f)
5 hours 20 min
134
4.21
Pore water pressure contour at drying times of (a)
0 hour, (b) 1 hour, (c) 2 hours, (d) 3 hours, (e) 4
hours (f) 5 hours 20 min
xvi
4.22
Variations of diffusivity with time for multilayer
system. (a) Liquid diffusivity. (b) Vapour
diffusivity
137
4.23
Pore water pressure distribution as a function of
depth and time (a); pore pressure water at 1hour
(b); 10hours (c)
138
4.24
Temperature distribution as a function of depth
and time (a); temperature at 1hour (b); 10hours (c)
140
4.25
Gas pressure distribution as a function of depth
and time (a); gas pressure at 1hour (b); 10hours (c)
141
4.26
Saturation distribution as a function of depth and
time (a); saturation at 1hour (b); 10hours (c)
142
4.27
Difference in moisture as a function of time
144
4.28
Volume shrinkage as a function of time; (a)
hygroscopic layer, (b) non-hygroscopic layer, (c)
differential
146
4.29
Drying shrinkage as a function of time; (a)
hygroscopic layer, (b) non-hygroscopic layer, (c)
differential
147
4.30
Temperature distribution
149
4.31
Saturation distribution
149
4.32
Temperature distribution
150
4.33
Saturation distribution
150
4.34
Temperature evolution
151
4.35
Saturation evolution
151
4.36
(a) Volume shrinkage as a function of time; (b)
differential in volume shrinkage; (c) drying
shrinkage; (d) differential in drying shrinkage
152
4.37
(a) Volume shrinkage as a function of time; (b)
differential in volume shrinkage; (c) drying
shrinkage; (d) differential in drying shrinkage
xvii
4.38
Dimensionless moisture gradient in solid matrix
(a) hygoscopic layer (denoted as 1) (b)
non-hygroscopic layer (denoted as 2)
155
4.39
Comparison of saturation level at 0
seconds((a),(b)), 30 minutes((c),(d)), 1
hour((e),(f)), 4 hours((g),(h)) and 8 hours((i),(j))
for both meshes
157
4.40
Comparison coarse and fine mesh saturation
evolution at node 22(fine) and 12(coarse) over 8
hour drying time for single layer structure.
159
4.41
Comparison of saturation level at 0
seconds((a),(b)), 30 minutes((c),(d)), 1
hour((e),(f)), 4 hour((g),(h)) and 8 hour((i),(j)) for
both meshes.
160
4.42
Comparison of saturation loss between fine mesh
and coarse mesh at node 22, 54(fine) and 12,
29(coarse) over 8 hour drying time for two layer
structure.
162
4.43
Difference in saturation and temperature for
interlayer at node 82, 92 and 102 (fine interlayer);
18, 23 and 28(coarse interlayer) over 8 hour
drying time for two layer structure.
163
Figure 1.1 : Several stages i n rem oval of water from 2.6between clay particles during the dry ing process. (a) Wet body . (b) Partially dry body . (c) Com pletely dry body [11]...3
Figure 1.2 : Schem atic diagram of the dry ing of a ceram ic green body showing the weig ht lo ss and s hrin kage with tim e [12]...4
Figure 1.3 : Warpage from dry ing a tile [13]...5
Figure 1.4 : Co ntribu tion of current work { the insert fig ure is contrib ution of previous w or k}...10
Figure 2.1 : SE M m icrograph of lay ered ceram ic m em brane [1]5...13
Figure 2.2 : Schem atic representation of an asy m metric m em brane [1]6...14
Figure 2.3 : Three step procedure for ceram ic m em branes [1]7...15
Figure 2.4 : Schem atic view of phase exis ts in a p orous m edium [23]8...17
Figure 2.5 : A ty pical m oisture content profile. (A) Warm -up period. (B) Cons tant rate period. (C) First fall ing rate period. (D) Second falling rate period. [3 7]9...18
Figure 2.6 : Dry ing m odel [10]10...20
Figure 2.7 : Variations of effective diffusivity with m oi sture content [43]11...22
Figure 2.8 : Volum e shrin kage and dry ing rate of a ceram ic body [62]12...25
Figure 2.9 : Schem atic drawing of ceram ic crack ini tiatio n process. (a) Initial ful ly saturated m atrix. (b) Water–air interface m eniscus developed between particles. (c) Tensile stress developed in the upper lay er. (d) Surface crack init iated.[63]13 ...25
Figure 2.10 : WRC for soi ls of d ifferent texture [79]14...37
Figure 3.1 : Eigh t-node quadratic quadrilateral elem ent[95]...70
Figure 3.2 : Overall m odel setup 2...80
Figure 3.3 : Detail set up of AX3...81
Figure 3.4 : Mesh sam ple of the slab 4...88
Figure 3.5 : Mesh of the ceram ic m em brane 5...90
Figure 3.6 : Measured volum e shrin kage resul ts from experim ent for constant rate period 6...93
Figure 3.7 : Measured volum e shrin kage resul ts from experim ent for falling rate period7...93
Figure 3.8 : Mesh of the slab 8...94
Figure 3.9 : Interm ittent dry ing configurati on condi tion 1 (denoted as bi)9...98
Figure 3.10 : Interm ittent dry ing config uration cond itio n 2 (denoted as b ii)10...98
Figure 3.11 : Dom ain used for si ngle lay er ((a),(b)), two lay ers ((c),(d)) and fine interlay er (e).11...100
Figure 4.1 : Water retention curve: (a) com parison between hy groscopic, non-hy groscopic and reference; (b) com parison of clay and sand {the insert Fi gure is ty pical WRC from [70]}12...104
Figure 4.2 : Sam ple plo ts: (a) with n = 0.6 and m = 2 (αvaries); (b) with m = 2 andα= 46 (n varies); (c) wit h n = 0.6 andα= 46 (m varies)13...106
Figure 4.3 : Dry ing curve 14...109
Figure 4.4 : Saturat ion curve15...109
Figure 4.5 : Tem perature curve 16...110
Figure 4.6 : Saturat ion curve for both m odel 1 7...112
Figure 4.7 : Dry ing curve18...113
Figure 4.8 : Dry ing curve19...114
Figure 4.9 : Water pressure distribu tion as a funct ion of dep th and t im e; slab X, b) slab Y, c) s lab Z 20...116
Figure 4.10 : Gas pressure dis tribu tion as a functi on of depth and tim e; a) slab X, b) s lab Y, c) slab Z21 ...118
Figure 4.11 : Water saturation d istri butio n as a function of depth and t im e; a) slab X, b) slab Y, c) slab Z22...120
Figure 4.12 : Pore water pressure distribut ion as a functi on of tim e 23...123
Figure 4.13 : Tem perature distribut ion as a functio n of tim e 24...123
Figure 4.14 : Gas pressure dis tribu tion as a functi on of t im e 25...124
Figure 4.15 : Variation s of diffusi vity with tim e. (a) Vapour diffusivity . (b) Boun d water diffusiv ity . (c) Liquid diffus ivity 26...125
Figure 4.16 : (a) Initial cond itio n for generated by current m odel. (b) Saturation contour after 7 hours by current m odel. (c) Initial condit ion of dry ing front from experim ent by Or et al [102]. (d) Dry ing front m ovem ent after 7 hours by experiment by Or et al [102]27...128
Figure 4.17 : Mo vem ent of dry ing from the top surface 28...129
Figure 4.18 : Sat uration con tour at dry ing tim es of (a) 0 hour, (b) 1 hour, (c) 2 hours , (d) 3 hours, (e) 4 hours (f) 5 hours 20 m in 2 9...130
Figure 4.19 : Pore gas pressure contour at dry ing tim es of (a) 0 hour, (b) 1 hour, (c) 2 hour s, (d) 3 hours, (e) 4 hour s (f) 5 hours 20 m in 3 0...132
Figure 4.20 : Tem perature contour at dry ing tim es of (a) 0 hour, (b) 1 hour, (c) 2 hours, (d) 3 hours , (e) 4 hours (f) 5 hours 20 m in 31...134
Figure 4.21 : Pore water pressure contour at dry ing tim es of (a) 0 hour, (b) 1 hour, (c) 2 hours, (d) 3 ho urs, (e) 4 hours (f) 5 hours 2 0 m in 32...135
Figure 4.22 : Variation s of diffusi vity with tim e for m ultilay er sy stem . (a) Liquid diffusiv ity . (b) Vapour diffusivi ty 33...137
Figure 4.23 : Pore water pressure distribut ion as a functi on of depth and tim e (a); pore pressure water at 1hour (b); 10hours (c)34...138
Figure 4.24 : Tem perature distribut ion as a functio n of depth and tim e (a); tem perature at 1hour (b); 10hours (c)35...140
Figure 4.25 : Gas pressure dis tribu tion as a functi on of depth and tim e (a); gas pressure at 1hour (b); 10h ours (c)36...141
Figure 4.26 : Sat uration d istrib utio n as a function of depth and t im e (a); saturation at 1hour (b); 1 0hours (c)37...142
Figure 4.27 : Difference in m oisture as a function of t im e 38...144
Figure 4.28 : Volum e shrin kage as a functi on of t im e; (a) hy groscopic lay er, (b) non-hy groscopic lay er, (c) differential 39...146
Figure 4.29 : Dry ing shrin kage as a functio n of tim e; (a) hy groscopic lay er, (b) non-hy groscopic lay er, (c) differential 40...147
Figure 4.30 : Tem perature distribut ion 41...149
Figure 4.31 : Sat uration d istrib utio n 42...149
Figure 4.32 : Tem perature distribut ion 43...150
Figure 4.33 : Sat uration d istrib utio n 44...150
Figure 4.34 : Tem perature evolution 45...151
Figure 4.35 : Sat uration evo lutio n 46...151
Figure 4.36 : (a) Volum e shrin kage as a function of tim e; (b) differential in vo lum e shrin kage; (c) dry ing shrin kage; (d) differential in dry ing s hrin kage 47...152
Figure 4.37 : (a) Volum e shrin kage as a function of tim e; (b) differential in vo lum e shrin kage; (c) dry ing shrin kage; (d) differential in dry ing s hrin kage 48...154
Figure 4.38 : Dim ension less m ois ture gradient in s olid m atrix (a) hy goscopic lay er (denoted as 1) (b) non-hy groscopic layer (denoted as 2)49...155
Figure 4.39 : Com parison of saturatio n level at 0 second s((a),(b)), 30 m inutes((c),(d)), 1 hour((e),(f)), 4 hours((g),(h)) and 8 hours((i),(j)) for both m eshes 50...157
Figure 4.40 : Com parison coarse and fine m esh saturation evolu tion at node 22(fine) and 12(coarse) over 8 hour dry ing tim e for single lay er structure.51...159
Figure 4.41 : Com parison of saturatio n level at 0 second s((a),(b)), 30 m inutes((c),(d)), 1 hour((e),(f)), 4 hour((g),(h)) and 8 hour((i),(j )) for both m eshes.52...160
Figure 4.42 : Com parison of saturatio n los s between fine m esh and coarse m esh at node 22, 54(fine) and 12, 29(coarse) over 8 hour dry ing tim e for two lay er structure.53...162

![Figure 1.2: Schematic diagram of the drying of a ceramic green body showing theweight loss and shrinkage with time [12]](https://thumb-us.123doks.com/thumbv2/123dok_us/8765088.895982/25.595.122.514.71.291/figure-schematic-diagram-drying-ceramic-showing-theweight-shrinkage.webp)
![Figure 1.3: Warpage from drying a tile [13]](https://thumb-us.123doks.com/thumbv2/123dok_us/8765088.895982/26.595.169.469.73.231/figure-warpage-from-drying-a-tile.webp)

![Figure 2.1: SEM micrograph of layered ceramic membrane [1]](https://thumb-us.123doks.com/thumbv2/123dok_us/8765088.895982/34.595.181.459.442.677/figure-sem-micrograph-of-layered-ceramic-membrane.webp)
![Figure 2.2: Schematic representation of an asymmetric membrane [1]6](https://thumb-us.123doks.com/thumbv2/123dok_us/8765088.895982/35.595.138.496.305.473/figure-schematic-representation-asymmetric-membrane.webp)
![Figure 2.3: Three step procedure for ceramic membranes [1]7](https://thumb-us.123doks.com/thumbv2/123dok_us/8765088.895982/36.595.124.519.277.482/figure-three-step-procedure-ceramic-membranes.webp)
![Figure 2.4: Schematic view of phase exists in a porous medium [23]](https://thumb-us.123doks.com/thumbv2/123dok_us/8765088.895982/38.595.189.460.579.731/figure-schematic-view-phase-exists-porous-medium.webp)
![Figure 2.6: Drying model [10]10](https://thumb-us.123doks.com/thumbv2/123dok_us/8765088.895982/41.595.189.450.527.744/figure-drying-model.webp)
