Design comparison of experimental storm
water detention systems treating
concentrated road runoff
Nanbakhsh, H, KazemiYazdi, S and Scholz, M
http://dx.doi.org/10.1016/j.scitotenv.2006.10.016
Title
Design comparison of experimental storm water detention systems treating
concentrated road runoff
Authors
Nanbakhsh, H, KazemiYazdi, S and Scholz, M
Type
Article
URL
This version is available at: http://usir.salford.ac.uk/id/eprint/20753/
Published Date
2007
USIR is a digital collection of the research output of the University of Salford. Where copyright
permits, full text material held in the repository is made freely available online and can be read,
downloaded and copied for noncommercial private study or research purposes. Please check the
manuscript for any further copyright restrictions.
Elsevier Editorial System(tm) for Science of the Total Environment
Manuscript Draft
Manuscript Number: STOTEN-D-05-00823R1
Title: Design comparison of experimental stormwater
detention systems treating concentrated road runoff
Article Type: Wetland Pollutant Special Issue Paper
Keywords: Biochemical oxygen demand; Detention; Gully; Nitrate; Road runoff; Storm water
Corresponding Author: Dr Miklas Scholz, PhD
Corresponding Author's Institution: The University of Edinburgh
First Author: Hassan Nanbakhsh, PhD
Order of Authors: Hassan Nanbakhsh, PhD; Sara Kazemi-Yazdi, MSc; Miklas Scholz, PhD
Design comparison of experimental storm water
detention systems treating concentrated road runoff
Hassan Nanbakhsh
a, Sara Kazemi-Yazdi
b, Miklas Scholz
b,*
aUrmia Univers ity of Medical Sciences, Department of Environmental; Health, Urmia, 57135-163, Iran bInstitute for Infrastructure and Environment, School of Engineering and Electronics, William Rankine
Build ing, The King’s Build ings, The University of Edinburgh, Edinburgh EH9 3JL, Scotland, United Kingdom
______________________________________________________________________
Abstract
The aim was to assess the treatment efficiencies of experimental storm water detention (extended storage) systems based on the Atlantis Water Management Limited detention cells receiving concentrated runoff that has been primary treated by filtration with different inert aggregates. Randomly collected gully pot liquor was used in stead of road runoff. To test for a ‘worst case scenario’, the experimental system received higher volumes and pollutant concentrations in comparison to real detention systems under real (frequently longer but diluted) runoff events. Gravel (6 and 20 mm), sand (1.5 mm), Ecosoil (inert 2 mm aggregate provided by Atlantis Water Management Limited), block paving and turf were tested in terms of their influence on the water
Manuscript
in contrast to suspended solids (SS) were frequently reduced to below international secondary wastewater treatment standards. The denitrification process was not completed. This resulted in higher outflow than inflow nitrate-nitrogen concentrations. An analysis of variance indicated that some systems were similar in terms of most of their treatment performance variables including BOD and SS. It follows that there is no advantage in using additional aggregates with high adsorption capacities in the primary treatment stage.
Keywords: Biochemical oxygen demand; Detention; Gully; Nitrate; Road runoff; Storm water.
_______________
*Corresponding author. Tel. +44-131-6-506780.; fax: +44-131-6-506554. E-mal address: [email protected] (M. Scholz).
1. Introduction
1.1. Sustainable Drainage Systems
New developments proposed for Brownfield sites or on the periphery of urban developments may be unable to obtain planning permission, if existing local sewers have no spare capacity for storm water drainage, and if the storm water discharge from the proposed site cannot be controlled. In the absence of suitable watercourses that can accommodate direct storm water discharges, alternative technologies such as ‘at source’ storm water storage and detention systems are required (Butler and Davies, 2000; Scholz, 2006).
Many existing catchments in Scotland (e.g., Glasgow and Edinburgh), which are served by combined sewerage, have the potential to increase local sewer capacity by disconnecting storm water at other sites within developed parts of the catchment (D’Arcy and Frost, 2001). Diversion of urban runoff before it enters the combined sewer into locally based storage devices such as the Atlantis Water Management Limited detention cell system has been shown to be a viable approach in many cases (Butler and Davies, 2000; CIRIA, 2000; Scholz, 2006).
Optimising the maintenance of SUDS structures is currently one of the greatest management problems. Mowing grass and removing litter and debris are the most time-consuming and therefore costly maintenance tasks (Jeferies et al., 1999; McKissock et al., 1999; Scholz, 2003).
trenches, filter strips and below-ground detention systems (Butler and Davies, 2000; CIRIA, 2000; Nuttall, 1998; Scholz, 2006).
Storm water runoff is usually collected in gully pots that can be viewed as simple physical, chemical and biological reactors. They are particularly effective in retaining suspended solids (Bulc and Slak, 2003). Currently, gully pot liquor is extracted once or twice per annum from road drains and transported (often over long distances) for disposal at sewage treatment works (Butler et al., 1995; Memon and Butler, 2002). A more sustainable solution would be to treat the entire road or car park runoff locally in potentially sustainable storm water detention systems such as below-ground storage systems and storm water ponds (Guo, 2001) reducing transport and treatment costs. Furthermore, runoff treated with storm water detention systems can be recycled for irrigation purposes.
Below-ground storm water storage and detention systems are defined as a sub-surface structure designed to accumulate sub-surface water runoff, and where water is released from as may be required to increase the flow hydrograph. The structure may contain aggregates with a high void ratio or empty plastic cells and act also as a water recycler or infiltration device (Butler and Parkinson, 1997; Scholz, 2006).
reduction. This detention system is predominantly applied in new developments (Scholz, 2006).
The effect of varying organic loading rates on the treatment performance of the complex biomass within most filter systems used for primary treatment is unknown. Moreover, an experimental study is required to assess the passive treatment performance of storm water detention systems.
1.2. Project purpose
The aim is to advance knowledge and understanding by formulating design guidelines for vertical-flow storm water detention systems treating road runoff predominantly by extended storage in a cold climate such as the Southeast of Scotland. The objectives are to assess
1. the function of turf (absent versus present) and different aggregates such as Ecosoil as components of a primary treatment filtration stage before the below-ground detention systems; and
2. the overall passive treatment performance of vertical-flow storm water detention systems.
2. Materials and methods
Five detention systems (Table 1 and Fig. 1) were located outdoors at The King’s Buildings campus (The University of Edinburgh, Scotland) to assess the system performance during a relatively cold spring and summer (31/03-19/08/04; Table 2). Inflow water, polluted by road runoff, was collected by manual abstraction with a 2 l beaker from randomly selected gully pots on the campus and the nearby main roads.
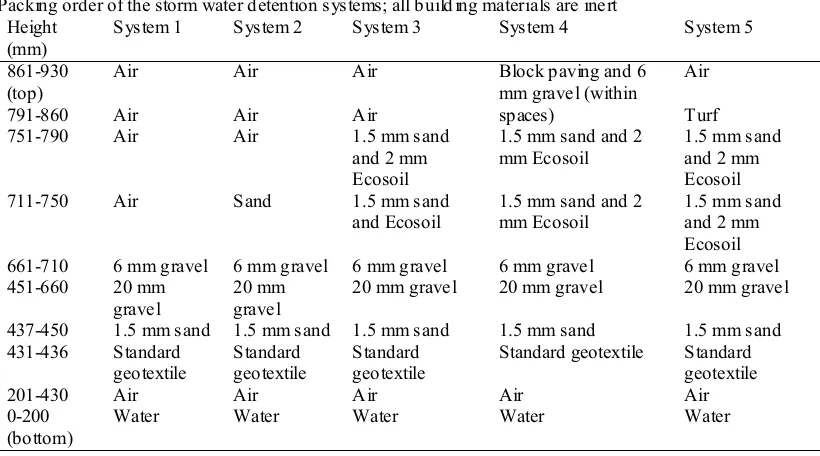
Five storm water detention systems based on plastic cells (boxes with large holes) wrapped in standard inert geotextile were used. Virtually any geotextile complying with the corresponding national standard could be used. Each system had the following dimensions: height = 85 cm, length = 68 cm and width = 41 cm. Two plastic cells on top of each other made up one detention system (Fig. 1). The bottom cell (almost 50% full at any time) was used for water storage only. The top cell contained the aggregates. Different packing order arrangements of inert single size aggregates and plant roots were used in the systems (Table 1) to test for the effects of gravel (6 and 20 mm diameter single size layers), 1.5 mm diameter sand, 2 mm diameter Ecosoil, block paving and turf on the water treatment performance. Apart from System 5, all remaining systems were unplanted. Systems 2 to 5 contained additional media: System 2 contained sand. System 3 comprised sand and Ecosoil. System 4 contained sand, Ecosoil and block paving. Finally, System 5 comprised Sand, Ecosoil and turf. In comparison to all other systems, natural aeration of System 4 was restricted due to block paving.
systems were approximately twice per week watered with 10 l gully pot liquor as slow as possible, and drained by gravity afterwards to encourage air penetration through the soils (Table 1) (Cooper et al., 1996; Gervin and Brix, 2001). The relative quantity of gully pot liquor used per system was approximately 3.6 × the mean annual rainfall volume to simulate a ‘worst case scenario’. The hydraulic residence times were in the order of one hour. Biodegradation was enhanced by encouraging natural ventilation of the aggregates from the top via the natural air, and from the bottom via the air pocket above the storage water and between the aggregates (Fig. 1). Considering industrial-scale systems, vertical ventilation pipes should be installed to encourage passive ventilation as well.
2.2. Analytical methods
The five-day @ 20 °C ATU biochemical oxygen demand (BOD) was determined in the inflow and outflow water samples with the OxiTop IS 12-6 system (Wisenschaftlich-Technische Werkstätten (WTW), Weilheim, Germany), a manometric measurement device. The measurement principle is based on measuring pressure differences estimated by piezoresistive electronic pressure sensors. Nitrification was suppressed by adding 0.05 ml of 5 g/l N-Allylthiourea (WTW Chemical Solution No. NTH 600) solution per 50 ml of sample water.
(using a Perstorp Analytical EnviroFlow 3000 flow injection analyser) following diazotisation with sulphanilamide and subsequent coupling with N-1-naphthylethylendiamine dihydrocloride (Allen, 1974).
Ammonia-nitrate and ortho-phosphate-phosphorus were determined by automated colorimetry in all water samples from reaction with hypochlorite and salicylate ions in solution in the presence of sodium nitrosopentacyanoferrate, and reaction with acidic molybdate to form a phosphomolybdenum blue complex, respectively (Allen, 1974). The coloured complexes formed were measured spectrometrically at 655 and 882 nm, respectively, using a Bran and Luebbe autoanalyser (Model AAIII).
A Whatman PHA 230 bench-top pH meter (for control only), a Hanna HI 9142 portable waterproof dissolved oxygen (DO) meter, a HACH 2100N turbidity meter and a Mettler Toledo MPC 227 conductivity, total dissolved solids (TDS) and pH meter were used to determine DO, turbidity, and conductivity, TDS and pH, respectively. An ORP HI 98201 redox potential meter with a platinum tip electrode HI 73201 was used to measure the redox potential. Composite water samples based on 2 litre of sample water taken randomly at a minimum of four sample locations and/or times were analysed. All other analytical procedures were performed according to the American standard methods (APHA, 1998).
For analysis of total nitrogen, the following procedure was adopted: Ammonium (present in the digest) reacts with hypochlorite ions generated by alkaline hydrolysis of sodium dichloroisocyanurate. The reaction forms monochloroamine which reacts with salicylate ions in the presence of sodium nitroprusside to form a blue indephenol complex. This complex is measured colorimetrically at 660 nm using a Bran & Luebbe autoanalyser (model AAIII).
For analysis of total phosphorus, the following procedure was used: Orthophosphate (present in the digest) reacts with ammonium molybdate in the presence of sulphuric acid to form a phosphomolybdenum complex. Potassium antimonyl tartrate and ascorbic acid are used to reduce the complex, forming a blue colour, which is proportional to the total phosphorus concentration. Absorption was measured at 660 nm using a Bran & Luebbe autoanalyser (model AAIII).
For the analysis of total potassium, the digest was analysed by a flame atomic absorption spectrometer (Unicam 919, Cambridge, UK) at a wavelength of 766.5 nm and with a bandpass of 1.5 nm. Standards were prepared in 100 ml flasks using 2 ml concentrated sulphuric acid and 1.5 ml hydrogen peroxide (30% v/v) and made up to mark with de-ionised water. Caesium at a concentration of 100 mg/l was added to both standards and digests to overcome ionisation.
Metal concentrations were determined in the raw gully pot liquor and the outflow waters from the experimental rig on 16 June 2004. Water samples for metal determinations were stored at -19°C until analysis.
flask to which 21 ml of hydrochloric acid (strength of 37%, v/v) and 7 ml of nitric acid (strength of 69%, v/v) were added. The mixtures were then heated on a Kjeldahl digestion apparatus (Fisons, UK) for at least 2 h. After cooling, all solutions were filtered through a Whatman Number 541 hardened ashless filter paper into 100 ml volumetric flasks. After rinsing the filter papers, solutions were made up to the mark with deionised water. The method was adapted from the section 'Nitric Acid-Hydrochloric Acid Digestion’ (APHA, 1998).
An Inductively Coupled Plasma Optical Emission Spectrophotometer (ICP-OES) called TJA IRIS and supplied by ThermoElemental (USA) was used to analyse selected wastewater, Ecosoil and grass cutting samples. The purpose was to economically screen samples to determine various trace element concentrations and potential contaminants. Analytical precision (relative standard deviation) was typically 5-10% for three individual aliquots.
No replicates were analysed unless stated otherwise in the standard methods (APHA, 1998). However, replicate samples were stored in the freezer, and revisited for specific variables where unexplained outliers were determined. If required these outliers were either replaced or ignored.
3. Results and discussion
The overall capital and maintenance costs were estimated for each detention system for the first year of operation. Maintenance included litter removal and grass cutting, and was based on an area of 1000 m2. Material prices were requested for a volume of 100 m3 per aggregate to obtain realistic figures for a scaled-up detention system (industrial operation size). It follows that the five system configurations have standardised cost ratios of approximately 1.0 : 1.1 : 1.2 : 1.3 : 1.6 based on Edinburgh prices in March 2004.
The actual prices are subject to negotiations and fluctuations on the market (i.e. labour costs, quantities ordered and transportation costs). Costs for sand, gravel, Ecosoil and block paving are likely to be similar to their transportation costs (e.g., between £20 and £35 per m3) for most small sites. Moreover, block paving costs depend heavily on the expenditure for skilled labour; i.e. a square meter may require up to 30 min laying time depending on the type of block paving and specifications for the corresponding purpose. Turf may be as cheap as £1.5 per square metre. The detention cells provided by Atlantis Water Management Limited may be sold for £4 per cell depending on the distributor. However, the corresponding installation costs are considerable higher. A detention cell system for a medium sized car park (500 to 1000 m2) in Edinburgh, for example, costs between £5,000 and £15,000 depending on the specific site, specifications and contractor.
3.2. Inflow water quality
selection of gully pots and seasonal variations (Butler and Parkinson, 1997; Scholz, 2004).
The gully pot liquor was less polluted in summer than in spring. For example, BOD, SS and turbidity in summer were 42, 33 and 46% lower, respectively (Table 2). There are various reasons for this including the observation that the higher temperature in summer compared to spring results in a faster biodegradation rate within the gully pot (Table 2). Moreover, the retention time of the gully pot liquor in summer is likely to be longer than in spring due to less frequent rainfall events. A longer retention time correlated positively with a higher biodegradation rate (APHA, 1998; Butler and Davies, 2000; Scholz, 2004).
3.3. Comparison of outflow water qualities
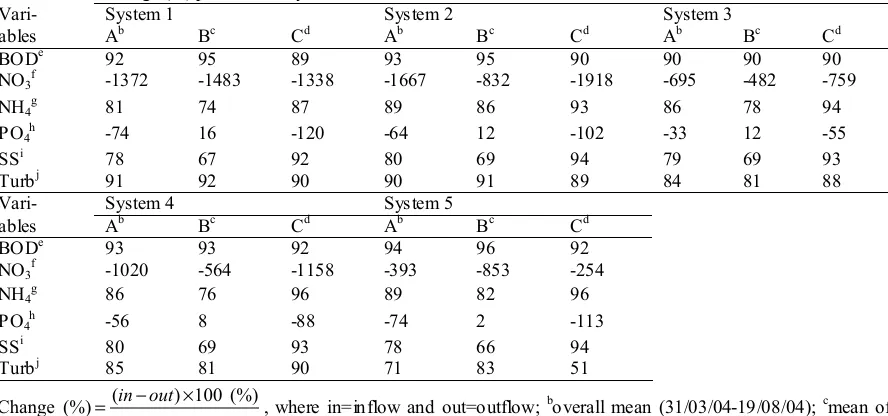
The overall filtration performance figures are summarised in Table 3 that should be compared with Table 2. Figure 2 shows ‘real’ inflow and outflow concentrations for all detention systems for BOD, SS and nitrate-nitrogen, respectively. Considering the relatively high standard deviations of most inflow water quality variables, and the only indirect relationships between inflow and outflow concentrations over time (i.e. buffer function of the large storage tank), it would be misleading to show mean outflow concentrations.
standards for the secondary treatment of effluent. Biochemical oxygen demand in contrast to SS (Table 3 and Fig. 2a,b) outflow concentrations did not exceed the US thresholds of 30.0 mg/l, respectively (Tchobanoglous et al., 2003). However, some European standards or those of individual regional agencies (Cooper et al., 1996; Lim et al., 2003; Shutes et al., 2001) are more stringent; e.g. BOD <20 mg/l. The BOD outflow concentration was also lower than the UK standard for secondary treated wastewater of 20 mg/l (Table 3).
A regression analysis has shown that BOD, ammonia-nitrogen, nitrate-nitrogen and ortho-phosphate-phosphorus can be estimated with conductivity and total dissolved solids using a second order polynomial equation. For example, concerning BOD, nitrate-nitrogen and ammonia-nitrogen with conductivity, the corresponding coefficient of determination (r2) for Filter 4 are 0.60, 0.71 and 0.76, respectively. The application
of these relationships for internal water quality control purposes is likely to result in the reduction of sampling effort. However, statistical relationships between other variables were not significant.
Furthermore, it has been suggested that mature and viable microbial biomass, in contrast to aggregates with high adsorption capacities (e.g., Ecosoil) and turf, is responsible for the high overall filtration performances (Cooper et al., 1996; Scholz and Martin, 1998). However, it is difficult to classify objectively a biological system as mature without having undertaken intensive microbiological work.
most heavy metals (e.g., aluminium, copper and cadmium) below the detection limit (0.2, 0.029 and 0.1 mg/l, respectively). Dissolved zinc (detection limit: 0.006 mg/l) was the pollutant measured with the highest corresponding concentration. The mean inflow concentration for zinc was 0.14 mg/l and the corresponding outflow concentrations were 0.07 mg/l (standard deviation: 0.05 mg/l).
3.4. Ecosoil and turf
The commercial product Ecosoil is rather an inert inorganic aggregate than an organic soil. The analysis shows that it does not contribute to elevated nutrient concentrations due to very low total nitrogen, total phosphorus and total potassium concentrations of 65, 46 and 1367 mg/kg, respectively. In comparison, a recent soil quality analysis for areas in Glasgow, where SUDS were considered for implementation, indicated total nitrogen, total phosphorus and total potassium concentrations of 1612, 605 and 4562 mg/kg (Scholz et al., 2005). It follows that Ecosoil does function only as a very weak fertiliser, and that it is therefore unlikely to contribute to eutrophication after the release of the treated storm water to the nearby watercourse.
The influence of turf (Filter 5; Fig. 1) on the organic matter content of the outflow was studied. The BOD and SS concentrations within the outflow from the planted system compared to the unplanted gravel and sand systems were similar (Tables 2 and 3). However, BOD in the outflow of System 5 was lower compared to all other systems.
Moreover, grass on top of Filter 5 (Fig. 1) was cut when the length was greater than 10 cm for optical reasons and to reduce the overall nutrient load. Total nitrogen, total phosphorus and total potassium concentrations were 3001, 640 and 6909 mg/kg fresh weight. The presence and harvesting of grass seemed to have a positive effect on the overall nitrate-nitrogen outflow concentration that was lower for System 5 if compared to the remaining systems (Tables 2 and 3; Fig. 2c).
3.5. Analysis of variance
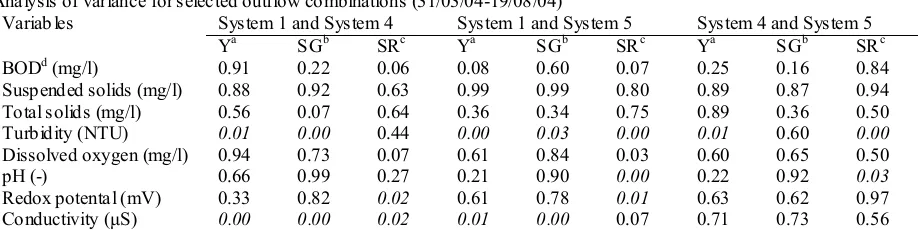
Table 4 summarises analysis of variance findings for selected water quality outflow variables concerning selected detention system combinations. The overall data sets were also sub-divided into seasonal data sets.
The threshold for statistically significant findings is P<0.05. It follows that pairs of data associated with P≥0.05 can be regarded as not significantly different. For example, the most simple and complex systems (System 1 and Systems 4 or 5, respectively; Table 1) are similar in term of their BOD and SS removal efficiencies.
Ammonification, nitrification and denitrification are the three dominant nitrogen transformations that were partly quantified by measuring ammonia-nitrogen and nitrate-nitrogen (Tables 2 and 3). Ammonification is the conversion from organic-nitrate-nitrogen to ammonia-nitrogen. Ammonia-nitrogen is used by micro-organisms and turf (Filter 5; Fig. 1) for new biomass development (Memon and Butler, 2002). This explains the higher reduction of ammonia in planted compared to unplanted storm water detention systems (see above and Tables 2 and 3).
Ammonification is slower in anaerobic than in aerobic aggregates because of the reduced efficiency of heterotrophic decomposition in anaerobic environments. Therefore, it was important to drawdown the water table completely after watering to allow oxygen to penetrate into the deeper filter-like layers of aggregates on top of the storage tank (Table 1). Ammonification also depends on pH being within an optimum range of approximately 6.5 to 8.5 (Kadlec and Knight, 1996), which was the case throughout the experiment (see also Table 2).
occurred at the stagnant bottom of the storage tank and within the less well aerated layers of aggregates (see above and Table 1) during warm periods. However, Fig. 2c indicates that the denitrification process was not completed. It follows that the retention times were likely to be too short.
4. Conclusions
Five-day @20°C biochemical oxygen demand (BOD) outflow concentrations were below the UK threshold of 20 mg/l for secondary treated wastewater. The storm water detention system did show signs of overloading resulting in relatively high suspended solids (SS) and nitrate-nitrogen concentrations, and further treatment would be required. Moreover, denitrification was not completed, and longer retention times are therefore suggested. Nitrate-nitrogen was lower in the outflow of the planted system (turf on the top).
Gully pot liquor (concentrated storm water runoff) in relative quantities exceeding three times the mean annual rainfall was used for all systems. Therefore, it is likely that the SS concentration would be much lower in the field under real in comparison to the tested ‘worst case scenario’ conditions.
Sampling effort can potentially be reduced for internal water quality control purposes by using relationships derived from a regression analysis between expensive variables that can be substituted by low-cost ones. For example, BOD can be replaced by conductivity for internal control purposes.
Ecosoil did contain relatively low concentrations of nutrients and metals (except for aluminium). It follows that higher investment costs for more complex systems are not justified based on a water quality analysis alone. However, further research concerning the potential hydraulic and structural benefits of additional aggregates such as Ecosoil is required.
Acknowledgements
The authors wish to acknowledge the support provided by Dr P. Anderson, Dr K. V. Heal, Mr. A. Gray and Mr. J. Mormon (all of The University of Edinburgh), and Mr. N. Cooper (Atlantis Water Management Limited). Sponsors: Atlantis Water Management Limited (storm water detention systems and Ecosoil) and Marshalls Public (block paving).
References
APHA. Standard Methods for the Examination of Water and Wastewater. 20th edn.,
American Public Health Association (APHA), AWWWA and WEF, Washington DC, 1998.
Bulc T, Slak AS. Performance of constructed wetland for highway runoff treatment. Wat Sci Tech 2003; 48(2):315-22.
Butler D, Davies JW. Urban Drainage. E & FN Spon, London, 2000.
Butler D, Parkinson J. Towards sustainable urban drainage. Wat Sci Tech 1997;35(9):53-63.
Butler D, Xiao Y, Karunaratne SHPG, Thedchananamoorthy S. The gully pot as a physical, chemical and biological reactor. Wat Sci Tech 1995;31(7):219-28.
CIRIA. Sustainable Urban Drainage Systems: Design Manual for Scotland and Northern Ireland. Report C521, Construction Industry Research and Information Association (CIRIA), Cromwell Press, London, 2000.
Cooper PF, Job GD, Green MB, Shutes RBE. Reed Beds and Constructed Wetlands for Wastewater Treatment. WRc plc., Swindon, 1996.
D’Arcy B, Frost A. The role of best management practices in alleviating water quality problems associated with diffuse pollution. Sci Tot Env 2001;265(1-3):359-67. Gervin L, Brix H. Reduction of nutrients from combined sewer overflows and lake
water in a vertical-flow constructed wetland system. Wat Sci Tech 2001;44(11-12):171-76.
Guo Y. Hydrologic design of urban flood control detention ponds. ASCE J Hydrolog Eng 2001;6(6):472-79.
Kadlec RH, Knight RL. Treatment Wetlands. CRC Press, Boca Raton, Florida, 1996. Lim PE, Tay MG, Mak KY, Mohamed N. The effect of heavy metals on nitrogen and
oxygen demand reduction in constructed wetlands. Sci Tot Env 2003; 301(1-3):13-21.
McKissock G, Jefferies C, D’Arcy BJ. An assessment of drainage best management practices in Scotland. J Ch Inst Wat Env Managem 1999;13(1):47-51.
Memon FA, Butler D. Assessment of gully pot management strategies for runoff quality control using a dynamic model. Sci Tot Env 2002;295(1-3):115-29.
Nuttall PM, Boon AG, Rowell MR. Review of the design and Management of Constructed Wetlands. Report 180, Construction Industry Research and Information Association, London, 1998.
SEPA. Protecting the Quality of our Environment – Sustainable Urban Drainage: An Introduction. The Stationary Office, London, 1999.
Scholz M. Sustainable operation of a combined flood-attenuation wetland and dry pond system. J Ch Inst Wat Env Managem 2003;17(3):171-75.
Scholz M. Treatment of gully pot effluent containing nickel and copper with constructed wetlands in a cold climate. J Ch Inst Wat Env Managem 2004;79(2):153-62.
Scholz M. Wetland Systems to Control Urban Runoff. Elsevier, Amsterdam, 2006. Scholz M., Martin RJ. Control of bio-regenerated granular activated carbon by
spreadsheet modelling. J Chem Tech Biotechnol 1998;71(3):253-61.
Shutes RE, Revitt DM, Scholes LNL, Forshaw M, Winter B. An experimental constructed wetland system for the treatment of highway runoff in the United Kingdom. Wat Sci Tech 2001;44(11-12):571-78.
Tchobanoglous G, Burton FL, Stensel HD. Wastewater Engineering: Treatment and Reuse (4th edn, revised). Metcalf & Eddy Inc. and McGraw Hill Companies Inc., New York, 2003.
Table 1
Packing order of the storm water detention systems; all build ing materials are inert Height
(mm) System 1 System 2 System 3 System 4 System 5 861-930
(top) Air Air Air Air
791-860 Air Air Air
Block paving and 6 mm gravel (within
spaces) Turf 751-790 Air Air 1.5 mm sand
and 2 mm Ecosoil
1.5 mm sand and 2 mm Ecosoil
1.5 mm sand and 2 mm Ecosoil 711-750 Air Sand 1.5 mm sand
and Ecosoil 1.5 mm sand and 2 mm Ecosoil 1.5 mm sand and 2 mm Ecosoil 661-710 6 mm gravel 6 mm gravel 6 mm gravel 6 mm gravel 6 mm gravel 451-660 20 mm
gravel 20 mm gravel 20 mm gravel 20 mm gravel 20 mm gravel 437-450 1.5 mm sand 1.5 mm sand 1.5 mm sand 1.5 mm sand 1.5 mm sand 431-436 Standard
geotextile Standard geotextile Standard geotextile Standard geotextile Standard geotextile
201-430 Air Air Air Air Air
0-200 (bottom)
Water Water Water Water Water
Table
Table 2
Gully pot liquor (inflow to systems): water quality variables (31/03-19/08/04)
Variable Unit Number of samples Mean SDa Mean(springb) Mean (summerc)
BODd mg/l 30 37.8 55.30 50.3 29.4
Nitrate-nitrogene mg/l 34 1.0 1.54 0.5 1.4
Ammonia-nitrogen mg/l 34 2.1 1.85 2.4 1.9
Ortho-phosphate-phosphorus mg/l 34 0.2 0.12 0.1 0.2 Suspended solids mg/l 30 596.5 1430.40 725.6 483.5
Total solids mg/l 30 442.8 848.58 311.4 518.9
Turbidity NTU 35 81.3 81.67 108.0 58.7
Dissolved oxygen mg/l 33 3.2 1.47 2.9 3.3
pHf - 35 6.99 0.286 6.79 7.16
Redox potential mV 35 178.0 110.62 106.2 238.5
Conductivity µS 35 224.7 223.25 338.5 128.9
Temperature (air) ºC 34 18.0 3.92 16.2 19.4 Temperature (gully pot) ºC 34 17.4 4.66 14.6 19.7
Table 3
Relative reduction (%) of outflow variab les (31/03/04-19/08/04) with respect to the inflow variables shown in Table 2 change (%) per wetland systema
Vari- System 1 System 2 System 3
ables Ab Bc Cd Ab Bc Cd Ab Bc Cd
BODe 92 95 89 93 95 90 90 90 90
NO3f -1372 -1483 -1338 -1667 -832 -1918 -695 -482 -759
NH4g 81 74 87 89 86 93 86 78 94
PO4h -74 16 -120 -64 12 -102 -33 12 -55
SSi 78 67 92 80 69 94 79 69 93
Turbj 91 92 90 90 91 89 84 81 88
Vari- System 4 System 5
ables Ab Bc Cd Ab Bc Cd
BODe 93 93 92 94 96 92
NO3f -1020 -564 -1158 -393 -853 -254
NH4g 86 76 96 89 82 96
PO4h -56 8 -88 -74 2 -113
SSi 80 69 93 78 66 94
Turbj 85 81 90 71 83 51
a
in out
in ) 100 (%) (
(%)
Change = − × , where in=inflow and out=outflow; boverall mean (31/03/04-19/08/04); cmean of
the spring (31/03/04-21/06/04); dmean of the summer (22/06/04-19/08/04) efive-day @ 20ºC N-Allylthiourea
biochemical oxygen demand (mg/l); fnitrate-nitrogen (mg/l); gammonia-nitrogen (mg/l); hotho-phosphate-phosphorus
Table 4
Analysis of variance for selected outflow combinations (31/03/04-19/08/04)
Variab les System 1 and System 4 System 1 and System 5 System 4 and System 5 Ya SGb SRc Ya SGb SRc Ya SGb SRc
BODd(mg/l) 0.91 0.22 0.06 0.08 0.60 0.07 0.25 0.16 0.84
Suspended solids (mg/l) 0.88 0.92 0.63 0.99 0.99 0.80 0.89 0.87 0.94 Total solids (mg/l) 0.56 0.07 0.64 0.36 0.34 0.75 0.89 0.36 0.50 Turbidity (NTU) 0.01 0.00 0.44 0.00 0.03 0.00 0.01 0.60 0.00 Dissolved oxygen (mg/l) 0.94 0.73 0.07 0.61 0.84 0.03 0.60 0.65 0.50 pH (-) 0.66 0.99 0.27 0.21 0.90 0.00 0.22 0.92 0.03 Redox potental (mV) 0.33 0.82 0.02 0.61 0.78 0.01 0.63 0.62 0.97 Conductivity (µS) 0.00 0.00 0.02 0.01 0.00 0.07 0.71 0.73 0.56
ayear (overall data); bspring; csummer; dfive-day @ 20 ºC N-Allylthiourea biochemical oxygen demand; includes
Figure captions
Fig. 1. Experimental storm water detention systems (The King’s Buildings campus;
The University of Edinburgh) on 1 July 2004: a) Systems 1 to 5; b) System 4 (partly
covered with block paving); c) System 5 (covered with turf).
Fig. 2. (a) Five-day @ 20°C N-Allylthiourea biochemical oxygen demand, BOD (mg/l), (b) suspended solids, SS (mg/l), and (c) nitrate-nitrogen (mg/l) concentrations
for the inflow and outflows of Systems 1 to 5.
Figure captions
Aggregates
Water storage tank
[image:29.612.202.414.93.239.2]Inflow from the top
Figure 1
(a) (b) (c) 0 1 10 100 1000
24-Mar 13-Apr 3-May 23-May 12-Jun 2-Jul 22-Jul 11-Aug Time (d) BO D ( m g /l )
Inflow System 1 System 2 System 3 System 4 System 5
0 1 10 100 1000 10000
24-Mar 13-Apr 3-May 23-May 12-Jun 2-Jul 22-Jul 11-Aug Time (d)
SS (
m
g
/l)
Inflow System 1 System 2
System 3 System 4 System 5
0 5 10 15 20 25 30 35 40 45
[image:30.612.191.414.71.594.2]3-Apr 28-Apr 23-May 17-Jun 12-Jul 6-Aug Time (d) N itr a te -ni tr oge n (mg/ l) Inflow System 1 System 2 System 3 System 4 System 5 Figure 2
Figure 1 (original BMP file)
Cover letter to the editor
To you as the Guest Editor:
• The case study (including associated figures) and Table 1 have been removed.
• The paper has been shortened.
• All referee comments have been addressed (see below).
To Reviewer No. 1:
• Standard aggregates (e.g. sand and gravel) and building materials (e.g., geotextile) were used. They have been specified further, if essential to the interpretation of the findings. The referee should appreciate that inert materials themselves have virtually no direct impact on the water quality.
• Analytical detection limits for heavy metals have been listed.
• A brief discussion concerning real costs has been included.
• Composite samples were described further.
• Grading curves for sand and gravel are trivial (i.e. virtually meaningless) considering that single sizes were used as specified in the text and corresponding table.
• The paragraph concerning the regression analysis has been clarified, and unsubstantiated
statements have been deleted. It follows that more diagrams are not necessary anymore.
To Reviewer No. 2:
• The filter material and the type of system have been detailed further in the abstract to make it more informative.
• Mean temperatures have been summarized in Table 2. An appropriate reference to Table 2
has been added in the text.
• The method statement on the redox potential has been corrected as suggested.
• Section 3.1 discusses now actual costs and should therefore be part of the section on results and discussions (i.e. not materials and methods). Referees should appreciate that it is virtually meaningless to specify aggregate costs considering that they depend and widely fluctuating variables such as location, labour and transport costs, for example. Differences might vary by one or two orders of magnitude!
• Statistical methods are now stated in the section on methods.
• As discussed in the text, it would be meaningless to state mean outflow concentrations
considering the high standard deviations of most inflow water quality variables, and that inflow and outflow are not directly related to each other considering the buffer capacities of the large below-ground detention systems. Moreover, the paper would be unnecessarily long, and similar information would be presented at least twice (text, Tables 2 and 3, and Figure 2).
To Reviewer No. 3:
• The case study and associated material such as two figures has been removed.
• The key words have been revised as suggested.
• Table 1 has been deleted, and its content has been incorporated into the text.
• Figures 2 to 4 have been combined as suggested.