comm
en
t
re
v
ie
w
s
re
ports
de
p
o
si
te
d r
e
se
a
rch
refer
e
e
d
re
sear
ch
interacti
o
ns
inf
o
rmation
A survey of ovary-, testis-, and soma-biased gene expression in
Drosophila melanogaster
adults
Michael Parisi
*
, Rachel Nuttall
†
, Pamela Edwards
*
, James Minor
†
,
Daniel Naiman
‡
, Jining Lü
*
, Michael Doctolero
†
, Marina Vainer
†
,
Cathy Chan
†
, James Malley
§
, Scott Eastman
†
and Brian Oliver
*
Addresses: *Laboratory of Cellular and Developmental Biology, National Institute of Diabetes and Digestive and Kidney Diseases, National
Institutes of Health, Department of Health and Human Services, Bethesda, MD 20892, USA. †Incyte Genomics, Palo Alto, CA 94304, USA. ‡Department of Mathematical Sciences, Johns Hopkins University, Baltimore, MD 21218, USA. §Center for Information Technology, National
Institutes of Health, Department of Health and Human Services, Bethesda, MD 20892, USA.
Correspondence: Michael Parisi. E-mail: michaelpa@intra.niddk.nih.gov
© 2004 Parisi et al.; licensee BioMed Central Ltd. This is an Open Access article: verbatim copying and redistribution of this article are permitted in all media for any purpose, provided this notice is preserved along with the article's original URL.
Abstract
Background: Sexual dimorphism results in the formation of two types of individuals with specialized reproductive roles and is most evident in the germ cells and gonads.
Results: We have undertaken a global analysis of transcription between the sexes using a 31,464 element FlyGEM microarray to determine what fraction of the genome shows sex-biased expression, what tissues express these genes, the predicted functions of these genes, and where these genes map onto the genome. Females and males (both with and without gonads), dissected testis and ovary, females and males with genetically ablated germlines, and sex-transformed flies were sampled.
Conclusions: Using any of a number of criteria, we find extensive sex-biased expression in adults. The majority of cases of sex differential gene expression are attributable to the germ cells. There is also a large class of genes with soma-biased expression. There is little germline-biased expression indicating that nearly all genes with germline expression also show sex-bias. Monte Carlo simulations show that some genes with sex-biased expression are non-randomly distributed in the genome.
Background
Sexual dimorphism varies enormously from the morphologi-cally indistinct yeast mating types, to extreme differences that can lead to the misclassification of males and females as dis-tinct species. While the Drosophila sexes show relatively modest sexually dimorphic somatic body plans there is strik-ing sexual dimorphism in the germline [1]. Indeed, it is diffi-cult to imagine cell types that differ more than eggs and
sperm. During the last century a handful of genes involved in the regulation of somatic (for example, Sex-lethal [2], trans-former [3], transformer-2 [4], doublesex [5], intersex [6]) and germline sexual identity (for example, ovo [7], sans fille [8], ovarian tumor [9], and stand still [10]) have been identi-fied, but we know very little about the effector genes that actu-ally result in a sexuactu-ally dimorphic state. Major terminal genes in the current models of somatic and germline sex Published: 1 June 2004
Genome Biology 2004, 5:R40
Received: 4 February 2004 Revised: 8 April 2004 Accepted: 12 May 2004 The electronic version of this article is the complete one and can be
determination are a transcription factor (doublesex) and an RNA binding protein (Sex-lethal) [11,12]. These molecules must orchestrate a cascade of effector functions that result in sexually dimorphic gametes and the somatic support func-tions required for their union at fertilization.
Whilst we know relatively little about how germline sexual identity is determined in Drosophila, the downstream proc-ess of oogenesis has been well studied. Egg production occurs in the ovary [13]; each ovary consists of a cluster of 16-20 ovarioles where the assembly line-like production of germline and somatic cell units (egg chambers) progresses along the length of the ovariole. The germline component of each egg chamber contains the differentiated products of a single germline stem cell division. The differentiating stem cell daughter undergoes four rounds of incomplete cytokinesis to produce an interconnected 16-cell cyst surrounded by a somatic follicular epithelium.
One of these 16 germline cells becomes the oocyte and the remaining 15 cells develop into supporting nurse cells. The 16-germline cells within cysts are connected by an intercellu-lar network facilitating the active transport of macromole-cules from the nurse cells into the growing oocyte. These components include basic cellular machinery such as ribos-omes, and a vast assortment of proteins and RNA species that support early embryonic development. For example, the dor-sal/ventral and anterior/posterior axes of the future embryo are laid down during oogenesis [14]. The somatic follicular epithelium surrounding each egg chamber is an important source of structural proteins, such as yolk and egg shell pro-teins, that become incorporated into the oocyte, as well as patterning information. Most of the yolk proteins are pro-duced distantly in non-gonadal fat body tissue [15]. Thus, while much of the egg is constructed by the cells of the egg chamber, there is significant contribution from distant organs. Finally, additional somatic functions in the female reproductive tract and female mating behaviors are required for productive gamete function [16]. A global analysis of gene expression in adult females therefore captures the genes required for all of the stages of oogenesis from stem cell to early embryo.
Analogously, the Drosophila testis contains developing gam-etes, from the stem cells at the apical tip of the testis to fully functional sperm [17]. As in the ovary, the germline stem cell division in the testis produces cysts of 16 primary spermato-cytes. However, in males all these primary spermatocytes undergo meiosis resulting in a cyst of 64 spermatids. Each spermatid then follows an elaborate differentiation program of cytoskeletal and nuclear rearrangements to form a mature sperm cell. These changes are quite remarkable. For example, sperm chromatin is nearly crystalline and the nucleus changes from a round structure to a highly elongated and slightly hooked shape. Cytoskeletal rearrangement is equally dramatic. The round spermatid forms a flagellar axoneme
that is nearly half the length of the adult. Mitochondrial dif-ferentiation in the axoneme is also striking. Individual mito-chondria fuse into two large and interleaved structures extending along the length of the flagellum. Thus, while the structure of a sperm cell might suggest a simplistic develop-mental program for spermatogenesis (DNA and a motor), shedding the features that characterize virtually all other cells in the body (such as packing DNA into nucleosomes) is an enormous reengineering feat. As is the case in females, the male reproductive tract and male behavior are required for fertility [18]. Therefore a global analysis of gene expression in adult males captures the genes required for all of the stages of spermatogenesis from stem cell to the fertilized egg.
Not surprisingly, both genetic and classic molecular studies indicate that spermatogenesis and oogenesis are complex events requiring extensive and often sex-specifically deployed information [13,17]. More recently, global gene expression studies using printed cDNAs, expressed sequence tags (ESTs), and full transcriptome microarrays have revealed extensive overall sex differential expression [19-24], with gene expression in the germline and gonads being particu-larly striking [19,20,24]. Here we report gene expression pro-files as a function of sexual dimorphism and sex determination in Drosophila as analyzed using a platform including 93% of predicted genes from version 1.0 of the Dro-sophila genome [25] and 75% of release 3.1. This article includes the dataset from Parisi et al. [24] on gene expression in adults, augmented with additional microarray experiments to further track the source of sexually dimorphic expression.
There are many stories embedded in the expression data reported here. We touch on only a few to illustrate the value of the dataset. The most significant aspect of the survey we report here is the creation of a dataset that can be mined by other researchers interested in gametogenesis and sexual dimorphism. To that end, genes showing differential expres-sion have been organized into easy to browse tables that include internet links to FlyBase [26,27], the compendium of genome information for Drosophila. We have also deposited all the data at the Gene Expression Omnibus [28,29] so that those interested in large-scale reanalysis can easily download the entire dataset.
Results
Experimental design
comm
en
t
re
v
ie
w
s
re
ports
refer
e
e
d
re
sear
ch
de
p
o
si
te
d r
e
se
a
rch
interacti
o
ns
inf
o
rmation
expression [30]. Another measure of germline contribution was obtained by dissection. The gonad samples provide a measure of gene expression in the germline and somatic com-ponents of the gonad. Whilst the gonads clearly contain both tissues, the vast majority of the mRNA is derived from the germline cells. Indeed, we were unable to collect sufficient
mRNA (600 ng of polyA+) from dissected germline-less gonads to perform a single microarray experiment. Finally, wildtype Drosophila males are XY and females are XX. We reversed the sex of XX flies from female to male using muta-tions in tra2 and dsx [31]. These sex transformed flies have rudimentary testes with very few germline cells [32] and are thus phenotypically similar, although less extreme, than the male progeny of tudor1 mothers [1]. By performing replicate microarray experiments on these diverse samples we obtain a robust picture of sexually dimorphic gene expression in the germline and soma.
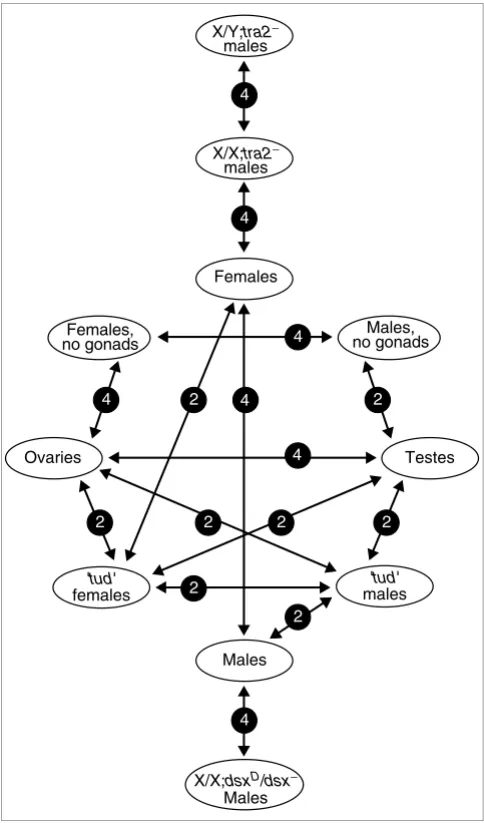
Pairs of mRNA samples (Figure 1) labeled using Cy3 or Cy5 labeled nonomers were applied to Incyte Fly Gene Expression Microarrays (FlyGEM) and the Cy3 and Cy5 channel intensity values were extracted for study as previously reported [33]. The microarray was designed against release 1 of the Dro-sophila genome and has been updated to release 3.1. There are many changes in the annotation and future changes are also likely. As a result some of the microarray elements no longer correspond to officially recognized genes (although some detect transcripts) and some transcripts are now recog-nized by multiple element species. Therefore we use the expression from the 14,611 DNA element species pairs corre-sponding to Drosophila transcripts (there are at least two of each printed on the array plus many control elements for a total of 31,464) as a metric for 'genes'. Using element species rather than gene names assures that the dataset can be updated as gene models change in the ongoing annotation effort.
In order to characterize a gene as showing biased expression in a particular tissue or sex, one is forced to use arbitrary sta-tistical or magnitude cut-offs. In our replicated heterotypic hybridizations we used both a conservative measure to cap-ture the highest confidence data and noisier, but more inclu-sive, clustering methods. We express sex-biased and tissue-biased gene expression in terms of percent of the genome for didactic purposes only, as these numbers depend greatly on the arbitrary cut-off. For gene lists, see the extensive set of tables and links to FlyBase in the Additional data files.
Expression analyzed by ratio
We have used conservative calls on competitive pairwise experiments at two-fold. An extensive set of homotypic hybridization experiments (mean r2 of 0.754, and a standard deviation of 0.097) has shown that the 99.5% tolerance inter-val for measurements on the FlyGEMs is <1.5-fold, and unlike the case with some array platforms the particular element sequence does not contribute significantly to variance [33]. Therefore, this global statistic can be applied to individual elements. Outliers are very effectively dealt with by replicates (Figure 2). In heterotypic hybridizations reported here, only 0.01% of the elements (representing 0-6 in each comparison) showed two-fold differences that fail to correlate with the experimental variables in question. Briefly, replication
[image:3.612.54.296.86.498.2]Microarray experimental design
Figure 1
Microarray experimental design. Sex biased gene expression data was derived from 44 microarray hybridizations testing 15 conditions. All experimental conditions included at least one biological replicate and most also include dye-flip hybridizations for additional replicates. Abbreviated genotypes of the samples are shown in light ellipses with the total number of replicated hybridizations in dark circles between the two samples. Full genotypes of the flies used are as follows: X/Y;tra2- males are w67c/ BsY;tra2B/Df(2R)trix, X/X;tra2- sex transformed males are w67c/+;tra2B/ Df(2R)trix, X/X;dsxD/dsx- males are (+/+; dsxM+R45/dsxswe. 'tud' males and females are the progeny of homozygous tud1 bw1 sp1 females mated to tud1 bw1 sp1/CyO males and themselves are genotypically tud1 bw1 sp1 homozygotes. Females and males are whole adult y1 w67c flies. Ovary, testis and no gonad samples are also derived from y1 w67c flies.
X/Y;tra2−
males
Ovaries
X/X;tra2−
males
Females
'tud'
females
'tud'
males Females,
no gonads
Males, no gonads
Testes
Males
X/X;dsxD/dsx−
Males
4
4
4
4 4 2
4
4 2
2 2 2
2
effectively eliminates false positives for tissue-biased expres-sion in theory and practice.
In comparisons of whole adult females and males, 17% of the element species reporting in all experiments showed a greater than two-fold sex-biased hybridization intensity (Figure 2a). Female-biased hybridization intensity was less extensive (6%) than male-biased hybridization intensity (11%). A series of experiments suggest that most sex-biased hybridization intensity is due to the germline (Figure 2; see also tables in the Additional data). We found that 1.5% of array element species show sex-biased hybridization in experiments using probes
derived from flies with no germ cells (Figure 2b). This distri-bution was asymmetric, with greater numbers of element spe-cies showing high hybridization to male samples (0.9%) than to female samples (0.4%). Similarly, when male or female carcasses were compared, 3% of the element species showed sex-biased hybridization (Figure 2c). The greater degree of sex-biased hybridization observed in the carcass samples may reflect strain differences, which can be substantial [21,23], or germline-dependent expression in the soma. We are cur-rently scrutinizing these possibilities with additional array experiments using flies of identical genotypes, with and with-out germlines. Briefly, these data indicate that relatively little
[image:4.612.57.558.86.473.2]Sex-biased differential expression in Drosophila
Figure 2
Sex-biased differential expression in Drosophila. Scatter plots show global expression in Drosophila testing different sex and tissue conditions. Data are pairwise comparisons of natural log (Ln) Cy3/Cy5 signal ratios averaged from dye flipped and biological replicate experiments. Black color indicates expression ratios that fall within a two-fold cutoff. Microarray element species greater than two-fold are color coded as indicated on each scatter plot. Yellow points indicate 2-fold differences that fail to correspond to the expression variables analyzed. The number of element species included in each pairwise comparison that met stringency conditions are indicated in parentheses. (a) y1 w67c males versus y1 w67c females (n = 10,688); (b) male versus female progeny of homozygous tud1 bw1 sp1 females (n = 12,836); (c)y1 w67c males, no gonads versus y1 w67 female, no gonads (n = 9,778); (d)y1 w67c testis versus y1 w67c ovary (n = 11,338); (e) y1 w67c testis versus y1 w67c y1 w67c male, no gonads (n = 12,461); (f) y1 w67c ovary versus y1 w67c female, no gonads (n = 11,223).
Male
Female
Male no gonads
Female no gonads
Ovary Female no gonads
Testis
Male no gonads
Testis
Ovary
'tud' Male
'tud' Female
-1
0
1
-1 0 1
−5 −4 −3 −2 −1 1 2 3 4 5
−5
−4
−3
−2
−1
1 2 3 4 5
−5 −4 −3 −2 −1 1 2 3 4 5
−5
−4
−3
−2
−1
1 2 3 4 5
−5 −4 −3 −2 −1 1 2 3 4 5
−5
−4
−3
−2
−1
1 2 3 4 5
−5 −4 −3 −2 −1 1 2 3 4 5
−5
−4
−3
−2
−1
1 2 3 4 5
−5 −4 −3 −2 −1 1 2 3 4 5
−5
−4
−3
−2
−1
1 2 3 4 5
−5 −4 −3 −2 −1 1 2 3 4 5
−5
−4
−3
−2
−1
1 2 3 4 5
0 0 1 -1 01 0 1
-1 -1
01 0 1
-1
01 0 1 -1
-1
01 0 1
-1
(a)
(b)
(c)
(d)
(e)
(f)
Replicates 1 and 2
Replicates 3 and 4
Replicates 3 and 4 Replicates 3 and 4
Replicate 2
Replicate 2
Replicates 3 and 4
Replicates 1 and 2 Replicate 1 Replicates 1 and 2
comm
en
t
re
v
ie
w
s
re
ports
refer
e
e
d
re
sear
ch
de
p
o
si
te
d r
e
se
a
rch
interacti
o
ns
inf
o
rmation
of the sex-biased expression in whole flies is attributable to the soma.
While the contribution of the germline to sexually dimorphic gene expression can be approximated by examining the frac-tion of the sex-biased expression in whole wildtype flies minus the sex-biased expression in the soma, a more direct measurement is obtained by hybridizing mRNA from dis-sected gonads. As we show below, this substantially concen-trates the mRNAs from germline cells and increases the depth of the observed expression profile. Ovary and testis samples exhibit the highest degree of sex-biased hybridization in our experiments (Figure 2d). A total of 29% of element species exhibit ovary-biased or testis-biased hybridization. This is in contrast to 14-16% of element species deduced to show ovary or testis-biased hybridization by subtracting the somatic biased genes from the list of element species exhibiting sex-biased hybridization in whole adults. The expression profile is distinctly asymmetric with nearly twice as many element spe-cies showing greater than two-fold hybridization to testis samples (18%) versus ovary samples (11%). Additionally, there were far more element species showing a large magni-tude of testis-biased hybridization. For example, 2% of ele-ment species showed >20-fold hybridization intensity in the testis channel, while <<1% of element species showed a simi-lar magnitude in the ovary channel (n = 4). These data indi-cate that the cells of the testis deploy a larger battery of specific genes than those of the ovary. Additionally, these data confirm that the most sexually dimorphic tissues, the gonads, show the most distinct gene expression profiles.
A priori, one might expect that the soma would be quite dif-ferent from the germline, but to what extent is this due to the expression of germline-specific or soma-specific gene batter-ies? To address this question, we have also examined germ-line versus somatic expression within a given sex. As expected we observed a high degree of testis-biased hybridization in competitive hybridizations with samples from either males with no or few germline cells (males from tudor1 mothers, and females transformed somatically into males; not shown) or from males with gonads removed (Figure 2e). A total of 14% of element species hybridize preferentially to labeled testis samples, supporting the idea that the gene batteries deployed in a testis-biased manner are extensive. Additionally, these experiments reveal a high degree of soma-biased hybridiza-tion - 10% of element species are preferentially hybridized to samples from males with the gonads removed (Figure 2e).
Somewhat surprisingly, comparing females with or without germlines did not show the same pattern of soma versus germline hybridization that was evident in the males. Ovary-biased hybridization was modest (4%) in experiments meas-uring hybridization of samples from ovary versus samples from females with the ovaries removed (Figure 2f). In con-trast, soma-biased hybridization was extensive (12%) as was the case when examining male soma and germline (Figure
2e). Thus, unlike what is seen in males, the asymmetry in these ratio plots favors the soma. This suggests that most of the genes expressed in the female soma are also expressed in the ovary and that many genes are expressed specifically in the female soma. The soma is distinguished from the germ-line by a high degree of soma-biased gene expression.
Expression analyzed by intensity
An overview of all sex-biased gene expression is provided by examining a self-organized heat map of the cross-normalized intensities from each of the hybridizations (Figure 3). This also provides an independent method for building gene lists. As expected from the pairwise comparisons, the prominent clusters in this map highlight groups of element species exhibiting testis-biased (12%), ovary-biased (9%), and soma-biased (11%) hybridization. The clusters of element species showing testis-biased hybridization are most dramatic, both in terms of the number showing sex-bias and in terms of the degree of hybridization bias. This global overview shows very little overt sex-biased expression in the soma, and very little germline-biased expression. In agreement with the scatter-plot analysis, the heat map indicates that the main batteries of differentially expressed genes distinguish the soma from the germline, and the female germline from the male line. Again, the lack of an overt class of genes showing germ-line-biased expression indicates that the male and female germlines have very little in common, other than the absence of expression from a large class of genes that appear to have soma-biased function.
Figure 3 (see legend on next page)
Females 'tud' females
Females no
gonads Ovaries Males
"tud" males
Males no
gonads Testes XY
tra2
males
XX
tra2
males XX
dsx
malesMixed adult
High
Moderate
Ovary-biased
Testis-biased
Soma-biased
Testis-biased
Ovary-biased
Soma-biased Low
5.17% (756) 16.21% (2,368)
3.76% (549)
7.86% (1,149)
5.56% (813)
4.08% (596)
16.03% (2,342)
32.00% (4,676)
4.96% (724) 4.37% (638)
Moderate ovary-biased
High Moderate Low Missing
SOM_0
SOM_1
SOM_2
SOM_3
SOM_4
SOM_5
SOM_6
SOM_7
SOM_8
comm
en
t
re
v
ie
w
s
re
ports
refer
e
e
d
re
sear
ch
de
p
o
si
te
d r
e
se
a
rch
interacti
o
ns
inf
o
rmation
tudor1 mothers. Thus, ratios determined by Northern blotting and FlyGEM compare favorably.
Cross-validation of expression with the developmental time course
Comparing array results across platforms can cross-validate a larger fraction of the genome. Confidence is heightened for element species showing biased expression on two platforms [34]. A Drosophila developmental profile including males and females with and without a germline has also been per-formed on a cDNA array platform (GEO accession GPL218) [20]. This array is less complete than the FlyGEM and is biased against testis gene expression as no clones from testis cDNA libraries were included in the platform. Thus, overall estimates of sex-biased gene expression are expected to vary between the platforms. However, FlyGEM element species designed against the genes represented by cDNA inserts should correlate if both platforms are performing as expected. We extracted data from 2,536 GPL218 elements also present on the FlyGEM platform for comparative analysis.
The correlation between male/female hybridization ratios was quite good (Figure 5a,b). The trend lines clearly demon-strate that elements showing sex-biased expression on one platform show similar sex-biased expression on the other if one applies a greater than two-fold cut-off to these ratios. The only clearly artifactual result from this comparison is the presence of a substantial number of elements reporting sex-bias only in Arbeitman et al. [20]. This may be due to cross-hybridization as a result of low sequence complexity and repeats in the cDNA inserts - a common problem with cDNA arrays [35]. Nevertheless, this comparison clearly cross-vali-dates the expression profiles for a substantial set of genes. Indeed, the r2 for male/female ratios across platforms is 0.447, which is similar to the correlation observed between replicate hybridizations within the time course dataset (r2 = 0.334 +/- 0.114).
We then tested whether expression ratios from our Northern analysis correlated to ratios derived from Arbeitman et al. [20]. We have Northern data in 16/2,536 elements common to both platforms. The male versus female and 'tud' male ver-sus 'tud' female ratios were plotted (Figure 5c,d). The Arbeit-man et al. [20] data to Northern (Figure 5c,d) and FlyGEM to Northern (Figure 4b,c) correlation was similar.
The Arbeitman et al. [20] data has been recently re-evaluated in a more statistically rigorous manner to extract the high
confidence data from the moderately reproducible primary data [36]. The specific aim of this re-evaluation was to iden-tify genes with sex-specific expression patterns. If the set of cDNA amplicons that most reliably hybridize to female or male samples can also be used to categorize female and male samples of differing genotype from another lab, then confi-dence in that list of genes is augmented. We therefore took a list of gene identifiers from this more recent study, extracted our corresponding data, and generated a cluster map of sam-ples (Figure 5e,5f). This small subset of elements was suffi-cient for the unsupervised classification of whole females and males, despite disparate genetic backgrounds. Tissues were also appropriately juxtaposed on the sample tree. Collec-tively, the scatterplot and heat map comparisons indicate that FlyGEM and Arbeitman et al. [36] data are in broad agree-ment and suggests that a full meta-analysis of Drosophila expression data from multiple platforms will be fruitful.
Well-characterized genes are correctly scored
Genes known to have sex-biased expression or function should be present in the appropriate ovary-, testis-, or soma-biased lists. We have mapped the FlyGEM element species to the current release of the Drosophila genome and generated a large set of lists with links to Flybase gene report pages (see Additional data). Following these links leads to more links (for example, literature, additional array data, yeast two-hybrid maps) and following these trails lends further confi-dence in the array data. For example, on lists of element spe-cies showing ovary-bias (Table 21 in Additional data; see also Tables 5, 15, 17, 30, 24, 36, and 38), we find six that represent chorion proteins (Cp15, Cp16, Cp18, Cp19, Cp36, and Cp38). Chorion proteins are components of the egg shell, and are known to be highly over-expressed in the ovary [37,38]. Sim-ilarly, structural components of sperm such as beta-tubulin85D [39], tektin-A [40] and don juan [41] are found on testis-biased lists (Additional data, Table 22; see also Tables 6, 7, 9, 31, 33, and 39). A number of other genes show-ing biased hybridization are known to be required for female or male fertility. These include alpha-tubulin67C, which is represented by over 20 female sterile alleles [42] and dead-head, which is represented by four female sterile alleles and a single lethal allele [43]. Genes represented by male sterile alleles (for example, boule [34] and fuzzy onions [44]) are found on testis-biased lists. The boule gene is also required in mammalian spermatogenesis [34], highlighting the potential utility of this dataset for those interested in spermatogenesis in mammals. Genes known to encode products required maternally for germline formation in the resulting embryo
Heat diagram of intensities
Figure 3 (see previous page)
are represented on lists of genes showing ovary-biased hybridization (for example, oskar [45], mago nashi [46], vasa [45], smaug [47], and cyclinB [48]) as are genes required for germline cell division within the ovary (for exam-ple, piwi and fs(1)Ya [49]). Even among the genes with little functional information, there is evidence to cross validate some of them. For example, BEST:GH14656 is represented by 13 testis ESTs from the NIH collection and just two ESTs from the BDGP head library [19,50].
In addition, there are a number of genes showing soma-biased expression in our experiments (Additional data, Table 23; see also Tables 9, 18, 37, and 40). Examples include actin88F [51], flightin [52], Tropomyosin1, Tropomyosin2, and upheld [53] that are known to be required for flight
mus-cle function. Similarly, genes involved in phototransduction (arrestin-2 [54], ninaC [55] and five genes encoding rho-dopsins [56]) exhibit soma-biased expression, as do genes expressed in the fat body which are immune response genes (Drosomycin [57]), or genes that may be required for energy storage (fat body protein 1 [58] and lipid storage droplet pro-tein 1 [59]). Thus, many of the class of genes showing soma-biased expression are genes used for well-defined soma-spe-cific functions.
Briefly, many of the genes expected to show biased expression do. Additionally, given the importance of these known genes, it seems likely that there will be interesting functions among the unstudied genes showing biased expression in our experiments.
[image:8.612.60.556.85.452.2]Northern and microarray comparison
Figure 4
Northern and microarray comparison. A series of 75 Northern blots with total RNA from germline-less ('tud') male, wildtype (y1 w67c) male, germline-less ('tud') female and wildtype (y1 w67) female whole flies were probed with the PCR products identical to those printed as microarray elements. (a) 34 Northern blot images show a range of expression patterns among the input RNA samples. Phosphorimaging of the radioactive signal from Northern blots gave expression ratios between the RNA sample types for each Northern probe. (b-e) Corresponding (Ln) transformed Northern and microarray element ratios averaged from multiple experiments are shown as four scatterplots comparing expression between (b) y1 w67c males versus y1 w67c females; (c) 'tud' males versus 'tud' females; (d) y1 w67c males versus 'tud' males and (e) y1 w67c females versus 'tud' females. The y and x axes are expression ratios derived from Northern blot and microarray ratios respectively. Over two-, over four- and over tenfold differences in ratio values between the Northern and microarray experiments are indicated in yellow, red and blue.
'tud' male
Female Male 'tud'
female
−5−4−3−2−1 0 1 2 3 4 5
−4
−3
−2
−1
0 1 2 3 4 5
−5−4−3−2−1 0 1 2 3 4 5
−4
−3
−2
−1
0 1 2 3 4 5
−5−4−3−2−1 0 1 2 3 4 5
−4
−3
−2
−1
0 1 2 3 4 5
−5−4−3−2 -1 0 1 2 3 4 5
−4
−3
−2
−1
0 1 2 3 4 5
Ln (male/'tud' male) Ln (male/female)
Ln (male/female)
Ln (male/'
tud'
male)
Ln (female/'tud' female)
Ln (female/'
tud'
f
e
male)
Ln ('tud' male/'tud' female)
Ln ('
tud'
male/'
tud'
f
e
male)
Microarray (Ln) ratio
Northern (Ln) ratio
1:1 >2-fold >4-fold >10-fold
'tud' male
Female Male 'tud'
female
Cyp6a19
Yp2
yip7
CG3203 dhd Cp18
exu
LD23830 Cp38
Yp1
CG13095 nos
Yp3 CG15044
CG6540
yip6 EG:25E8.2
CG4847 CG6140 TrxT
CG6483 Tsf1 CG12860
CG15258 CG10869
CG5089
GH14656
Cyt-c-d
Vha26
CG31872
Cyp4g1 Mst84Dc
MtnA
CG17472
(d)
(e)
(b)
comm
en
t
re
v
ie
w
s
re
ports
refer
e
e
d
re
sear
ch
de
p
o
si
te
d r
e
se
a
rch
interacti
o
ns
inf
o
rmation
Systematic analysis of gene function
Browsing offers some degree of confidence, but is not amena-ble to the analysis of large datasets. The Gene Ontology (GO) consortium [60] has provided a controlled vocabulary to describe gene function allowing us to determine rigorously which functions are over-represented in a particular expres-sion profile. We queried our element species lists with the GO term analysis tool 'Database for Annotation, Visualization and Integrated Discovery' (DAVID) and 'Expression Analysis Systematic Explorer' (EASE) [61].
The results of GO term analysis are reassuring. Genes with oogenic functions [13] are highly over-represented among element species with ovary-biased expression (Figure 6a). The most highly over-represented categories are associated with metabolism (P < 1 × 10-20) and are probably associated with biosynthesis required for the manufacture of eggs. Simi-larly, ribosomes are highly over-represented cellular compo-nents (P < 2 × 10-42) as are ribosomal proteins in the protein GO category (P < 8 × 10-52). Genes encoding translational ini-tiation complexes are also highly over-represented (P < 2 × 10-22). This is consistent with the high level of protein produc-tion during egg development and the high ribosomal content maternally loaded into the egg. Indeed, mutations in many ribosomal protein genes result in female sterility due to defec-tive egg formation [62]. Also prominently represented are genes involved in DNA metabolism and cell cycle regulation (P < 1 × 10-12, P < 1 × 10⁻⁷). These functions may be required for the dramatic endoreplication of nurse cells during oogen-esis. Similarly, the over-representation of transcripts from genes required for DNA replication (P < 1 × 10⁻⁹), chromatin architecture (P < 4 × 10⁻⁵), nuclear organization (P < 1 × 10⁻⁴), and DNA packaging (P < 5 × 10⁻⁵), may be required for nurse cell polyploidization [13] or for the rapidly dividing embry-onic cells which rely on maternally deposited gene products. Finally, molecular genetic analysis of oogenesis has revealed that a substantial number of these gene products include RNA binding proteins, and this class is also over-represented in ovaries in our microarray data (P < 2 × 10⁻⁶).
The representation of GO terms in the testis-biased element species lists was similarly examined (Figure 6b). Again, the most significantly over-represented GO terms are consistent with what we know about spermatogenesis [17]. Genes encoding microtubule (P < 2 × 10⁻⁹) or movement (P < 3 × 10 -8) function are among the element species with testis-biased expression. These are required for the extensive cytoskeletal reorganization during spermiogenesis [17]. Genes encoding transport proteins (P < 2 × 10⁻⁶), including those with dynein-associated ATPase activity (P < 1 × 10⁻⁹) are over-represented. Again, this is consistent with the motile nature of sperm. Chaperones (P < 3 × 10⁻⁴) are over-represented, which is in agreement with the known requirement for heat shock pro-teins during spermatogenesis [63]. In testis, cellular compo-nent analysis shows high over-representation of gene products associated with mitochondria (P < 9 × 10-14),
membranes (P < 1 × 10⁻⁴) and the cytoskeleton (P < 3 × 10⁻⁷) which is almost certainly due to requirements for sperm axoneme structure.
Non-gonadal female somatic tissues show sex-biased expres-sion of genes related to reproductive processes (Figure 6c). Vitellogenesis (P < 2 × 10⁻⁵) is required for egg development, as the vitellogenin or yolk proteins synthesized in the female fat body are the major component of a mature egg. The sec-ond category of proteolytic processing (P < 8 × 10⁻⁴) might reflect the process required for generating yolk proteins. Ribosomal protein encoding genes are also over-represented (P < 1 × 10⁻⁶) in the non-gonadal female soma transcription profile. Similarly, element species encoding lysosome compo-nents (P < 2 × 10⁻⁵) are over-represented. These functions probably reflect the dual anabolic and catabolic metabolism required to support egg development.
The male reproductive tract includes several additional somatic structures in addition to the testis. For example, the seminal fluid components of the ejaculate are produced in the accessory glands. These glandular secretions mediate sperm competition, reduce post copulatory mating by recipient females, and increase egg laying rates [18]. These element species with 'extracellular' function are over-represented in the male expression profile (P < 4 × 10⁻⁵) (Figure 6d).
Gene expression neighborhoods
A whole genome transcriptional profile enables us to investi-gate the genomic organization of tissue-specific gene batter-ies. Previous experiments have shown that there are significantly fewer genes with male-biased expression on the X chromosome [23,24]. The fourth chromosome is enriched in genes with soma-biased expression (not shown). On a more local level, Drosophila genes with tissue-, temporally-biased expression patterns have been shown to be concentrated in neighborhoods of contiguous genes [64]. We asked if genes with sex-biased expression show a similar sub-chromosomal level organization.
Figure 5 (see legend on next page) Northern GPL218 FlyGEM
(a)
(b)
(c)
(d)
Female Male(e)
(f)
Female no gonads Female no gonads Male no gonads 'tud'
female
Female ap ap XY;
tra2 XX; tra2 XX; tra2 XX; tra2 XX; dsx D/ dsx −
Male Male Male Male no gonads Male no gonads Female Female Female Ovary Ovary Ovary Ovary Ovary Ovary Male Male Male 'tud'
male ' tud' male ' tud' male ' tud' male ' tud' male
Male no gonads XX;
dsx
D/
dsx
−
Male Female Female no gonads 'tud'
female ' tud' female ' tud' female ' tud' female
Female no gonads XY;
tra2
−
XX;
tra2
−
Testis Testis Testis Testis Testis Testis
Female Female Female Ovary Ovary Ovary Ovary Male Male 'tud'
male ' tud' male ' tud' male ' tud' male ' tud' male
Male no gonads 'tud'
female ' tud' female ' tud' female ' tud' female
Female no gonads Female no gonads ap Ovary Ovary Male Male Male Male Male no gonads Testis Testis Testis Testis Testis Testis Female XY;
tra2 − XX; tra2 − XX; tra2 − XX; dsx D/ dsx
Female Female Female no gonads Female no gonads XY;
tra2
−
XX;
tra2
−
ap 'tud'
female
Male no gonads Male no gonads XX;
tra2 XX; dsx D/ dsx −
−5−4−3−2−1 1 2 3 4 5
−4 −3 −2 −1 1 2 3 4 5
−5−4−3−2−1 1 2 3 4 5
−4 −3 −2 −1 0 1 2 3 4 5
−8 −6 −4 -2 0 2 4 6 8
−4 −3 −2 −1 0 1 2 3 4 5
−8 −6 −4 -2 0 2 4 6 8
−4 −3 -2 -1 0 1 2 3 4 5 Ln (male/female) Ln ( male / female )
Ln (male/female) Ln ('tud' male/'tud' female)
comm
en
t
re
v
ie
w
s
re
ports
refer
e
e
d
re
sear
ch
de
p
o
si
te
d r
e
se
a
rch
interacti
o
ns
inf
o
rmation
Given that the concept of gene expression neighborhoods is relatively new, we were interested in identifying the most sig-nificant examples for detailed future study. To do so, we examined the distribution of element species with both highly ovary-, testis-, or soma-biased expression and high intensity to avoid low intensity noise. This resulted in 791 element spe-cies with testis-biased hybridization, 129 element spespe-cies with ovary-biased hybridization, and 287 element species with soma-biased hybridization, which we mapped onto the genome (Figure 7). We also generated randomized datasets to determine if the distribution pattern of ovary-biased, testis-biased, or soma-biased expression is non-random. To do this, 100,000 randomizations were performed for each gene posi-tion over windows (consecutive genes along the chromo-some) ranging between five to 200 genes. We used sliding windows of various sizes to determine how often an equal or greater number of elements reporting highly biased expres-sion occurred in a random set versus the real data. A total of 20 gene expression neighborhoods were identified with a P -value < 10-3, 15 at P <10-4 and seven at the lowest possible P -value of <10-5 (0/100,000). The most clear-cut examples of gene expression neighborhoods include approximately 10 genes within a chromosomal region spanning between 20 to 40 genes (Figure 8). This is consistent with the report of 10-to 20-gene expression neighborhoods shown in microarray analysis of Drosophila embryonic versus adult transcription [64].
There are several possible reasons for co-expression of neigh-boring genes. One possibility is that they are members of gene families or are part of the same transcription unit. Indeed, a recent article suggests that operons and duplicate genes account for many of the gene expression neighborhoods in Caenorhabditis elegans [65]. While there is no evidence for extensive operon structure in Drosophila, genome annota-tion errors might potentially introduce artifactual evidence for gene expression neighborhoods if genes thought to be distinct are in fact derived from a common transcript. Alter-natively, gene expression neighborhoods might reflect the
local transcriptional environment via a neighborhood-wide control structure [66,67]. In order to distinguish between these models, to a first approximation, we examined the seven P < 10-5 neighborhoods more closely.
All of the most significant gene expression neighborhoods contain genes expressed from either strand, indicating that neither polycistronic messages nor annotation errors are causal (Figure 8). Additionally, there are no overt gene fami-lies or groups of gene ontology terms associated with six of the neighborhoods, suggesting that they are unlikely to be derived by gene duplication, although one is a neighborhood of paralogous genes (Figure 8e). This latter soma-biased gene expression neighborhood consists of a group of distinct genes encoding trypsin-like proteases [68]. Such gene arrange-ments usually represent gene duplications from a common ancestor and are often co-expressed. The unusually high number of Drosophila genes encoding trypsins has been pre-viously noted [69], it appears that repeated gene duplication may be the cause.
Discussion
A large fraction of the Drosophila genome shows sex-biased expression
We have carefully cataloged sex-biased expression in Dro-sophila adults using 88 samples of wild-type flies and tissues, germline-ablated flies, and flies with sex transformed geno-types with 14,611 pairs of elements representing exons from release 1 of the Drosophila genome. We have also carefully examined platform performance [33] and have extensively analyzed the dataset for internal consistency as well as cross-validation with other array datasets and Northern blotting. The lists of genes in the survey of sex-biased expression will be a valuable resource for ultimately understanding how sex-ual dimorphism is genetically encoded and executed. Addi-tionally, this dataset has already proven valuable in the study of rapidly evolving genes with male-biased expression and in understanding X chromosome evolution [23]. Sex-biased
[image:11.612.50.548.91.103.2]Meta-analysis of Arbeitman et al [20,36] data
Figure 5 (see previous page)
An analysis of Gene Ontology term categories
Figure 6
An analysis of Gene Ontology term categories. The results show categories over-represented in (a) ovary, (b) testis, (c) female soma and (d) male soma queried by the three GO ontologies of biological process (black bars), cellular component (dark gray bars) and molecular function (light gray bars). Histograms represent significant over-representation (P < 0.001) of element species for 116 GO categories. The y axis scale shows P-values of the modified F-statistic (EASE score). The GO terms for each column are: 1, behavior; 2, biosynthesis; 3, cell cycle; 4, cell growth and/or maintenance; 5, cell organization and biogenesis; 6, cell proliferation; 7, chromosome organization and biogenesis (sensu Eukarya); 8, cytoplasm organization and biogenesis; 9, cytoskeleton organization and biogenesis; 10, cytoskeleton-dependent intracellular transport; 11, DNA dependent DNA replication; 12, DNA metabolism; 13, DNA packaging; 14, DNA replication; 15, DNA replication and chromosome cycle; 16, eggshell formation; 17, eggshell formation (sensu Insecta); 18, establishment and/or maintenance of chromatin architecture; 19, G2/M transition of mitotic cell cycle; 20, gametogenesis; 21, insect chorion formation; 22, insemination; 23, intracellular transport; 24, M phase of mitotic cell cycle; 25, macromolecule biosynthesis; 26, mating behavior; 27, metabolism; 28, microtubule-based movement; 29, microtubule-based process; 30, mitotic cell cycle; 31, nuclear organization and biogenesis; 32, nucleobase, nucleoside, nucleotide and nucleic acid metabolism; 33, oogenesis; 34, oogenesis (sensu Insecta); 35, organelle organization and biogenesis; 36, ovarian follicle cell development (sensu Insecta); 37, oviposition; 38, physiological processes; 39, post-mating behavior; 40, protein biosynthesis; 41, protein metabolism; 42, protein modification; 43, proteolysis and peptidolysis; 44, regulation of cell cycle; 45, reproduction; 46, reproductive behavior; 47, S phase of mitotic cell cycle; 48, sexual reproduction; 49, sperm competition; 50, sperm displacement; 51, transport; 52, vitellogenesis; 53, cell; 54, chaperonin-containing T-complex; 55, cytoplasm; 56, cytoskeleton; 57, cytosol; 58, cytosolic large ribosomal subunit (sensu Eukarya); 59, cytosolic ribosome (sensu Eukarya); 60, cytosolic small ribosomal subunit (sensu Eukarya); 61, dynein complex; 62, eukaryotic 43S pre-initiation complex; 63, eukaryotic 48S initiation complex; 64, extracellular; 65, inner membrane; 66, intracellular; 67, large ribosomal subunit; 68, lysosome; 69, lytic vacuole; 70, membrane; 71, microtubule associated complex; 72, microtubule cytoskeleton; 73, mitochondrial inner membrane; 74, mitochondrial membrane; 75, mitochondrion; 76, pre-replicative complex; 77, replication fork; 78, ribonucleoprotein complex; 79, ribosome; 80, small ribosomal subunit; 81, alpha-mannosidase activity; 82, aminopeptidase activity; 83, ATP dependent helicase activity; 84, ATP dependent RNA helicase activity; 85, carbohydrate binding activity; 86, carrier activity; 87, catalytic activity; 88, chaperone activity; 89, chromatin binding; 90, chymotrypsin activity; 91, dynein ATPase activity; 92, endopeptidase activity; 93, enzyme activity; 94, exopeptidase activity; 95, galactose binding activity; 96, hormone activity; 97, hydrolase activity; 98, hydrolase activity, acting on acid anhydrides, involved in cellular and subcellular movement; 99, leucyl aminopeptidase activity; 100, metalloexopeptidase activity; 101, nucleic acid binding; 102, oxidoreductase activity; 103, peptidase activity; 104, RNA binding; 105, RNA dependent ATPase activity; 106, RNA helicase activity; 107, serine-type endopeptidase activity; 108, serine-type peptidase activity; 109, small protein conjugating enzyme activity; 110, structural constituent of chorion (sensu Insecta); 111, structural constituent of ribosome; 112, structural molecule activity; 113, thiolester hydrolase activity; 114, transporter activity; 115, trypsin activity; 116, ubiquitin conjugating enzyme activity.
0 5 10 15 20
0 10 20 30 40
0 5 10 15 20 0 10 20 30 40 50
Ovary
Testis
Female soma
Male soma
1 10 20 30 40 50 60 70 80 90 100 110 116
GO Term Category
EASE Score (10
-X
)
(a)
(b)
(c)
comm
en
t
re
v
ie
w
s
re
ports
refer
e
e
d
re
sear
ch
de
p
o
si
te
d r
e
se
a
rch
interacti
o
ns
inf
o
rmation
expression may also be a convenient tool for understanding functional consequences and mechanistic underpinnings of gene expression neighborhoods.
In broad terms, we identify three large batteries of genes with ovary-biased, testis-biased and soma-biased expression. The germline and soma of Drosophila are the first lineages to sep-arate in the developing embryo, so we tend to think of germ-line versus somatic tissue as being perhaps the most significant dichotomy. In addition to early divergence in the embryo, the germlines of females and males are functionally similar - they undergo meiosis and produce gametes. One
might therefore expect that female and male germ cells would express many genes that are silent in somatic cells. There is a small core of genes showing germline-biased expression (~3%); our data, however, suggest that most of the genes showing germline-dependent expression also show sex-biased expression. Essentially, adult ovary and testis are as different from each other as they are from somatic cells. A major difference between the germline and soma is the absence of gene expression from loci encoding terminal differentiation proteins (for specific adult somatic structures such as eyes and muscles) in the germline.
The lack of a large battery of genes showing germline-bias could also be due to expression of sperm or egg differentiation products that overwhelm the signal from genes expressed in the stem cells, which show no overt sexual dimorphism. Early undifferentiated germ cells from males and females would be expected to have more similar gene expression profiles. How-ever, preliminary global analysis of transcripts in undifferentiated germ cells are also revealing a modest set of genes with germline-biased expression. The germline tran-scription profile is defined by the transcripts from genes encoding somatic terminal differentiation products and by sex. Germline development is under the control of sex deter-mination signals from the time the embryonic genome is acti-vated [70]. Perhaps it is better to think of the male and female germlines as quite distinct entities, rather than lumping them together as 'germline'.
Sex-biased expression in ovaries and testis were by far the most dramatic in terms of both numbers of genes and the degree of sex-bias. While most of this sex-biased expression is clearly explained by expression within the germline, there also appears to be striking germline-dependent expression outside of the gonads. Flies with and without a germline are often used to distinguish between genes that are expressed in the germline from those that are expressed in the soma [30]. Technically, a gene expressed in wildtype adults but not in adults missing a germline is said to be germline-dependent, not germline expressed. In comparing flies without a germ-line to those whose gonads had been removed, we found that there was greater sex-biased expression in the latter. These data suggest that the germline acts at a distance to condition the soma. This does not appear to be due to strain differences, as preliminary analysis of gonadectomized flies of identical zygotic genotypes but which had or were missing germ cells, shows substantial gene expression differences. Thus, it appears that much of the sex-biased expression in the Dro-sophila soma is due to conditioning by the germline, rather than the somatic sex determination hierarchy.
Data mining
A catalog of gene expression data is of limited value if it can-not be easily accessed. In addition to depositing all the array data at GEO, we have run a number of queries and provided the resulting gene lists in the Additional data files. Any of the
[image:13.612.53.295.89.424.2]Distribution of genes with high ovary-, testis-, and soma-biased expression in the genome
Figure 7
Distribution of genes with high ovary-, testis-, and soma-biased expression in the genome. Gene positions are shown on the chromosome arms to scale with the positions of all genes on the five major chromosome arms (fourth and Y chromosomes not shown) presented as single tick marks for each in the upper column (All). The positions of genes represented by element species highly expressed in gonads and somatic tissues are presented in adjacent rows. The element species defined as highly expressed in the three tissue categories were up in multiple pairwise comparisons; ovary-biased (from microarrays versus both testis and female carcass), testis-biased (versus both ovary and male carcass) and somatic-biased (common among male carcass versus testis, and female carcass versus ovary). Asterisks indicate gene neighborhoods identified by Monte Carlo simulations with highly significant P values (*P < 10-3, **P <
10-4, ***P < 10-5).
0
** *
*
*
*
X
2L
3R 3L 2R **
***
*** *** *** ***
***
** **
** **
**
** ***
*
5 10 15 20 25 30
Chromosome length (megabase pairs)
Ovary Testis Soma All
Ovary Testis Soma All
Ovary Testis Soma All Ovary Testis Soma All
lists of element species in the Additional data associated with this manuscript may be browsed in order to confirm the per-formance of the platform with a gene of interest, or for finding a novel expression pattern for a known gene. We have highlighted just a few of the stories that are embedded in the array dataset reported here. To list just a few examples, the preliminary data reported here suggest that germ cells are dosage compensated [24]. The dot fourth chromosome is especially active in the soma. Odorant-binding protein-encoding genes with highly sex-biased expression might be quite interesting candidates in the pheromone response.
It is our hope that this and other datasets generated on this platform will be useful to those who are interested in data mining for candidate genes. Additionally, there was reasona-bly good agreement between the array datasets here and those of Arbeitman et al. [20,36], which suggests that Dro-sophila array data from different laboratories will be directly comparable. This further suggests that array data will be broadly useful to the wider Drosophila community. However, it is also clear that there will be artifacts in array datasets, and indeed in the underlying genome annotations. Strain differences and the presence of genetic markers are also likely
[image:14.612.55.559.87.493.2]Gene neighborhoods
Figure 8
Gene neighborhoods. Monte Carlo simulations (see Materials and methods) were used to identify statistically significant clusters of testis- and soma-biased genes using a series of window sizes ranging from five to 200 consecutive genes. Examples are shown for six gene neighborhoods that were found zero times in 100,000 replicated randomization tests. GADFLY [26] annotation images of the chromosomal regions for each neighborhood are shown with the genes identified by element species showing expression-bias, indicated by red boxes. The normalized intensities are shown below each neighborhood indicating high expression (yellow), moderate (red), low (blue) and below background (black). (a) A testis-biased cluster at cytological position 2L:35D4-F435, (b) a testis-biased cluster at 2R:50B1-50C6, (c) a testis-biased cluster at 2R:56E1-F9, (d) a testis-biased cluster at 2R: 59C3-D6, (e) a soma-biased cluster at 2R:47E1-F5 and (f) a soma-biased cluster at 2R:55C6-C8.
CG13243 CG4767 CG7653 CG31824 CG18096 CG31823 CG7644 CG13244 CG4793 CG12448 CG18063 CG10839 CG13245 CG4838 CG4824 CG4846 CG4891 CG4892 CG4959 CG4959 CG4894 CG12455 CG4993 CG4930 CG4965 CG4935 CG7664 CG4132 CG17329
CG6155 CG13333 CG13334 CG13335 CG13335 CG6191 CG6197 CG18369 CG12464 CG6209 CG13337 CG18368 CG6220 CG17716 CG6280 CG13338 CG13340 CG13338
CG9218 CG16716 CG18367 CG18367 CG15124 CG15905 CG15125 CG11018 CG9854 CG11025 CG15127 CG15127 CG15128 CG15126 CG11797 CG30128 CG11218 CG8462 CG8517 CG12501 CG13873 CG13874 CG8595 CG13872 CG10822 CG8654 CG16898 CG8896 CG11041 CG18416 CG16894
CG3085 CG9882 CG9882 CG30191 CG9877 CG13538 CG9876 CG9873 CG30186 CG3219 CG3215 CG13544 CG12192 CG13545 CG9899 CG30188 CG30188 CG13548 CG13539 CG3162 CG3092 CG13549 CG9871 CG12782 CG13540 CG3134 CG3124 CG13541 CG9868 CG30412 CG9861 CG30417
CG12350 CG12388 CG12387 CG12386 CG12385 CG18444 CG18681 CG18211 CG12351
CG15066 CG18108 CG18107 CG15067 CG15067 CG18106 CG16844 CG15068 CG5154 CG17522 CG5164 CG17523 CG17524 CG17525 CG17527 CG17530 CG17531 CG17533 CG17534
High Moderate Low Missing
(a)
(d)
(b)
(c)
(e)
(f)
Roe1CG13333 CG13334 5' (100000 bp/tick)
5' 3'
3'
5' (100000 bp/tick)
5' 3'
3'
5' (100000 bp/tick)
5' 3'
3'
5' (100000 bp/tick)
5' 3'
3'
5' (100000 bp/tick)
5' 3'
3' 5' (100000 bp/tick)
5' 3'
3'
CG6197 CG18369
CG13335 CG13340
CG13335
BcDNA:GH06193
CG13337 CG18368 fas
CG6209 CG6220 opus{}821
CG6280 CG13338 CG6305
CG12464
lambdaTry betaTry
kappaTry zetaTry
etaTry
thetaTry alphaTry
epsilonTry
CG30031
gammaTry
CG30025 deltaTry
IM1 IM2
CG15066 CG15067
CG16844
CG16836 CG15068
CG15068 CG5154
CG17522
GstE1 Gst3-2 Gst3-1 CG17523
CG17524 CG17525
CG17530
CG17527 CG17531
Testes
Male somatic
Female somatic
Ovaries
Testes
Male somatic
Female somatic
Ovaries
Testes
Male somatic
Female somatic
Ovaries
Testes
Male somatic
Female somatic
Ovaries Testes
Male somatic
Female somatic
Ovaries
Testes
Male somatic
Female somatic
comm
en
t
re
v
ie
w
s
re
ports
refer
e
e
d
re
sear
ch
de
p
o
si
te
d r
e
se
a
rch
interacti
o
ns
inf
o
rmation
to confound results; array data should be viewed with this firmly in mind.
Materials and methods
Animals and treatmentsWe used standard Drosophila techniques throughout. Flies were grown at 25 ± 0.5°C on GIF or PB media (KD Scientific, Columbia, MD, USA) and aged 5-7 days prior to use. Most alleles and transgenes have been previously described and can be found, with references, at FlyBase [26]. Flies wildtype for sex were of the genotype y1 w67c. To study the contribution of the body as a whole and the gonads, flies were dissected and snap frozen as described [19]. To study the germline-dependent gene expression profiles, samples were prepared from the progeny of homozygous tud1 bw1 sp1 females. Flies were dissected to confirm germline loss (tudor1 is not fully penetrant for germlineless-ness, only individuals with atrophic gonads were retained) as above. This sham dissec-tion also facilitates comparisons to gonadectomized samples. The effects of somatic sex determination mutants on sex-biased gene expression included examining sex-transformed flies using doublesex (+/+; dsxM+R45/dsxswe) and transformer 2 (w67c/+;tra2B/Df(2R)trix) mutants. Sibling w67c/ BsY;tra2B/Df(2R)trix were used in a direct comparison for one group of experiments.
Microarray hybridization
An extensive platform description is available [71] and at the Gene Expression Omnibus website [29] under accession number GPL20. RNA isolation, labeling, and hybridization have been previously described [71].
Microarray intensity quantification
Hybridized slides were read on a GenePix 4000 A to generate TIFF images which were imported into GemTools (Incyte Genomics, Palo Alto, CA, USA) for spot finding. Data was nor-malized and corrected in Array Qualifier (Novation Bio-sciences, Palo Alto, CA, USA). Intensities <2.5-fold above local background were discarded. Raw intensity data and cor-rected data from Array Qualifier were loaded into an Access database and analyzed in Excel (Microsoft, Redmond, WA, USA). The GEO data accessions for these hybridizations are: GSM2456, GSM2458, GSM2460, GSM2462, GSM2464, GSM2466, GSM16542, GSM16554, GSM16556, GSM16569, GSM16570, GSM16572, GSM16574, GSM16576, GSM16578, GSM16580, GSM2457, GSM2459, GSM2461, GSM2463, GSM2465, GSM2467, GSM16650, GSM16555, GSM16571, GSM16573, GSM16575, GSM16577, GSM16579, GSM16581, GSM16582, GSM16584, GSM15686, GSM16588, GSM16593, GSM16613, GSM16614, GSM16615, GSM16619, GSM16583, GSM16585, GSM16587, GSM16589, GSM16609.
Analysis of ratios
For analysis of ratios, the Cy3:Cy5 signal for each element was averaged over biological replicate experiments and dye flips
and then averaged from duplicate elements. Elements failing to return a ratio value from duplicates were excluded. Boolean queries were run to generate gene lists of particular interest (for example, high in ovary and female, and low in all others). For analysis by intensity, array channels were cross-normalized in Array Qualifier.
For array to array comparisons, the GPL218 platform table and 40 sample datasets representing 20 biologically repli-cated adult stages were downloaded from the GEO website. For comparison to the GPL20 data, Log2 VALUE data (ratio of experiment to reference sample) from eight sample sets representing four biological replicates for five day adult Can-ton S or 'tud' males and females (GEO accessions GSM3551, GSM3552, GSM3518, GSM3519, GSM3531, GSM3532, GSM3537, GSM3538) were converted to Ln values. The ratios from each biological replicate pair were averaged and these experiment/reference sample ratios were then rearranged into male/female and 'tud' male/'tud' female ratios for paral-lel platform comparison. A total of 2,536 overlapping ele-ments between GPL20 and GPL218 were selected based on Flybase IDs and plotted against the GPL20 counterpart (sam-ple accession: GSM2456, GSM2458, GSM2457, GSM2459, GSM16582, GSM16583) or Northern ratios.
Clustering
To analyze sex-biased gene expression as normalized intensi-ties among multiple microarray experiments, heat diagrams were generated by the Cluster 3.0 for Mac OSX program [72] formatted for OSX by Michiel deHoon [73]. A normalized set of signal intensity data was prepared for Cluster by averaging duplicate spots (the two duplicate features within an array) from 26 cross normalized microarray experiments. The sam-ple columns were fixed, while genes were clustered. A self organizing map (SOM) was made using default parameters (10 clusters). The resulting SOM file was then used to perform k-means clustering. The output file was visualized with JavaTreeview (adapted by Alok Saldanha at Stanford Univer-sity) [74].
A similar heat diagram was processed for analyzing the gene neighborhoods using this normalized dataset. A Treeview-generated image of the normalized intensities was made using an input data file that sorted the data for each gene by position along the chromosome. Data was sorted first by chromosome arm and then by distance along the chromo-some using the first nucleotide of the microarray element amplimer as the positional reference relative to the annotation.