1
“BIM IMPLEMENTATION STRATEGY FRAMEWORK
FOR SMALL ARCHITECTURAL PRACTICES”
The University of Salford School of the Built Environment
2
Contents
Figures ... 12
Abbreviation ... 38
Acknowledgement... 42
Declaration... 43
Abstract ... 44
CHAPTER 1 Introduction ... 46
1.1 1ntroduction ... 46
1.2 Observations ... 51
1.2.1 Observation 1: ... 51
1.2.2 Observation 2: ... 54
1.2.3 Observation 3: ... 54
1.3 Research Problem ... 56
1.4 Research Aim and Objectives ... 58
1.5 Research Questions ... 59
1.6 Research Methodology ... 60
1.7 Contribution to the Body of Knowledge ... 61
1.7.1 Synopsis of the Research Impact ... 61
1.7.2 Scope and Limitations of the Work ... 61
1.8 Structure of Thesis ... 63
1.9 Summary of Chapter ... 65
CHAPTER 2 Small Architectural Practices and their Challenges ... 67
2.1 Introduction ... 67
2.2 The Construction Industry and its Challenges ... 68
2.3 The need for Construction Industry improvement as defined by the UK Government ... 70
2.4 FAST Analysis of how demands on the Construction Industry are to be achieved ... 72
2.5 Challenges facing the Construction Industry ... 73
2.5.1 The need for Effective Management ... 73
2.5.2 The Need to Avoid Wasted Effort ... 74
2.5.3 Portfolio Management ... 76
3
2.5.5 To Operate in a Safe Way ... 79
2.5.6 To Reduce Waste ... 79
2.5.6.1 Material Waste ... 80
2.5.6.2 Water Usage and Waste... 81
2.5.6.3 To Avoid Informational Waste ... 82
2.5.6.4 To Reduce Energy and Carbon Footprint ... 83
2.5.6.5 To Reduce Costs ... 89
2.6 The Tasks and Processes Undertaken by Small Architectural Practices ... 90
2.6.1 Introduction... 90
2.6.2 The Role of the Architect and Architectural Practices ... 90
2.6.2.1 Analysis of Architectural Practices in the UK ... 90
2.6.2.2 The Practice of Architecture ... 92
2.6.3 The Emerging Demands to be Placed on Architectural Practice ... 94
2.6.4 Obsolete Buildings ... 97
2.6.5 Demographic Changes ... 97
2.6.6 The Tasks Undertaken by Architects ... 100
2.6.7 Existing Condition Modelling ... 104
2.6.8 Procurement, Phase Planning and Project Programming ... 104
2.6.9 Site Analysis and Design ... 104
2.6.10 Product selection ... 104
2.6.11 Design Review ... 104
2.6.12 Structural consideration ... 104
2.6.13 Lighting Analysis... 105
2.6.14 Mechanical Analysis ... 105
2.6.15 SAP and Code Analysis... 105
2.6.16 Statutory Submission ... 105
2.6.17 Tender Documentation ... 105
2.6.18 3D Coordination... 106
2.7 The fundamental internal issues that affect the adoption of BIM in Small Architectural Practices ... 106
2.8 Summary of Chapter ... 106
CHAPTER 3 BIM as a New Way of Working ... 108
3.1 Introduction ... 108
4
3.2.1 Defining BIM ... 116
3.2.2 The Role of BuildingSMART ... 125
3.2.3 Prototype Applications ... 126
3.2.4 The Role of Industry Foundation Classes ... 126
3.2.5 The Use of Single Discipline and Federated Models ... 130
3.2.6 Using Shared Workspaces ... 132
3.2.7 The Development and Use of COBie ... 135
3.2.8 BIM as part of Integrated Project Delivery ... 140
3.2.9 Level of Detail ... 141
3.2.10 BIM and Open BIM ™... 144
3.2.11 Standards relevant to BIM and BIM Implementation ... 145
3.2.12 BIM and ICT (Information Communication and Technology) ... 147
3.2.13 The Value of Data and Text in BIM models... 147
3.2.14 The Future of BIM ... 149
3.2.15 UK Government Documentation relevant to BIM and BIM Implementation ... 163
3.2.16 Adoption of BIM from an International Perspective ... 164
3.2.17 The Definition of BIM adopted as part of this Thesis ... 164
3.3 Implementing BIM – Introduction ... 165
3.3.1 National and International documentation relevant to BIM and BIM implementation ... 165
3.3.2 BIM Project Execution Guidance ... 172
3.3.3 BIM Organisation Implementation Guidance... 172
3.3.4 Software tool Guidance ... 172
3.3.5 General Guidance in Books and Journals ... 173
3.3.6 Review of BIM Implementation Strategy Frameworks and identification of their Limitations ... 177
3.3.7 The Barriers to BIM Adoption ... 178
3.3.7.1 Process Concerns ... 181
3.3.7.2 People Barriers to Adoption ... 181
3.3.7.3 Technology Barriers to Adoption ... 183
Surveys documenting the hurdles to BIM adoption ... 183
3.4 The financial barrier to adopting BIM ... 185
5
CHAPTER 4 Benefits of BIM ... 188
4.1 Introduction ... 188
4.2 Using Lean Concepts to define BIM Benefits ... 189
4.3 The Benefits of using BIM in a Small Architectural Practice ... 193
4.4 The Benefits of a Small Architectural Practice adopting BIM to the wider Construction Industry ... 200
4.5 BIM to address sustainability issues ... 205
4.6 BIM and Health and Safety ... 208
4.7 Project Integration, Clash detection and reduced rework ... 209
4.8 Designing Better Buildings ... 211
4.9 Better Cost Control ... 213
4.10 Better Data and Information Transfer ... 213
4.11 Better Life Cycle Management ... 214
4.12 Summary of Chapter 4 ... 216
CHAPTER 5 Research Methodology ... 218
5.1 Introduction ... 218
5.2 Research Philosophy ... 219
5.3 Research Approach ... 221
5.4 Research Strategy ... 224
5.5 Research Process Design ... 231
4.5.1 Research Techniques for Data Collection ... 231
5.5.2 Research Techniques for Data Analysis ... 235
5.6 Ethical Considerations ... 237
5.7 Introduction to the case study company ... 237
5.8 The legacy systems at John McCall Architects ... 241
5.9 The case study company financial status ... 247
5.10 Summary of Chapter 5 ... 248
CHAPTER 6 Initial BIM Implementation Framework ... 250
6.1 Introduction ... 250
6.2 BIM implementation in the context of enterprise architecture ... 251
6.3 Review of business reengineering approaches ... 254
6.4 BIM implementation what type of project is it? ... 257
6
6.6 The Hypothetical BIM implementation strategy framework ... 261
6.7 Summary of Chapter 6 ... 262
CHAPTER 7 Explanation of the Framework used at John McCall Architects, The Diagnosis Stage ... 264
7.1 Introduction ... 264
7.2 Development of the Outline Business Case ... 264
7.3 BIM implementation - Project Structure and Authorization ... 273
7.4 Initial Project Mobilization ... 273
7.5 Defining BIM implementation Project Parameters ... 279
7.6 Analysis of Business objectives and business model generation ... 279
7.7 Analysis of current processes ... 283
7.8 Analysis of Data handling ... 292
7.9 To determine Current Best practice and Benefit Analysis ... 300
7.9.1 Literature Review to determine Best Practice and benefit analysis ... 300
7.9.2 Artifact Review ... 301
7.9.3 How quality objectives can be better met ... 308
7.9.4 Development of the Information Model, Information Structuring and compliance ... 311
7.9.5 SWOT and PESTLE Analysis ... 312
7.9.6 Monitoring of Best Practice Organisations ... 315
7.9.7 Visit to companies to witness best practice ... 315
7.9.8 Stakeholder Review ... 316
7.10 BIM Tool Review / Selection ... 318
7.10.1 BIM Tool review - Introduction ... 318
7.10.2 BIM Tool Review - Requirements ... 321
7.10.3 BIM Tool Review - Activities undertaken in the case study company ... 321
7.10.4 The literature review for the BIM tools ... 327
7.10.5 Hands on testing of BIM tools ... 329
7.10.6 Formal set tests undertaken by expert users ... 330
7.10.7 SWOT analysis of the BIM tools ... 336
7.10.8 Review of other BIM Authoring Software ... 339
7.10.9 Review of BIM eco Tools ... 340
7.10.10 Hardware considerations in BIM tool selection ... 341
7
7.11 Summary of Chapter 7 ... 342
CHAPTER 8 Explanation of the Action Planning Stage ... 347
8.1 Introduction ... 347
8.2 Defining what is to be achieved from BIM implementation ... 347
8.2.1 Defining what is to be achieved – Introduction ... 347
8.2.2 Defining what is required - Actions undertaken at the case study company ... 349
8.2.3 Recommendations on defining what is to be achieved from a BIM adoption ... 350
8.3 Promoting the vision ... 352
8.3.1 Promoting the vision – Introduction ... 352
8.3.2 The requirements of promoting the vision ... 355
8.3.3 Activities undertaken to promote the vision ... 355
8.3.4 Recommendations to improve the promoting of the vision ... 361
8.4 Benchmarking ... 361
8.4.1 Benchmarking - Introduction ... 361
8.4.2 Benchmarking - Activities undertaken at the case study company ... 362
8.5 Developing the BIM implementation plan ... 364
8.6 Determination of hardware and software ... 368
8.7 Development of the staff training plan ... 368
8.8 Determine Pilot or Prototype and roll out projects ... 373
8.9 Preparation for the Prototype Projects ... 373
8.10 Managing PR and Marketing of BIM ... 374
8.11 Purchase of Hardware and Software to undertake the prototype projects ... 374
8.12 Initial Hardware and software configuration ... 374
8.13 Summary of Chapter 8 ... 375
CHAPTER 9 Action Taking Stage: BIM Implementation Role Out ... 377
9.1 Introduction ... 377
9.2 Training Design and Development ... 379
9.3 Training of the BIM Champion ... 385
9.4 Undertaking Prototype Projects - The Build London Live Competition ... 386
9.5 Undertaking Prototype Projects - The Grow Home House Design ... 392
9.6 Undertaking Prototype Projects - The Leathers lane Prototype ... 393
8
9.8 Undertaking Prototype Projects - Investigation of thermal models ... 403
9.9 Review of Prototype Projects ... 405
9.10 Execution of Staff Training ... 408
9.10.1 Training execution – Introduction ... 408
9.10.2 Training Execution - Actions taken at the case study company... 409
9.10.2.1 Outsourced BIM Training ... 409
9.10.2.2 Internal Training ... 411
9.10.2.3 Self-Study ... 412
9.10.2.4 Recommendation Training Execution ... 413
9.11 Project Procedures - Standards for using BIM ... 414
9.12 The BIM execution plan the BIM manual and the BIM capability Matrix ... 415
9.12.1 The BIM Execution Plan ... 416
9.12.2 The BIM Capability Matrix ... 418
9.12.3 Development of the BIM Manual ... 419
9.13 Lean Optimization of the BIM Tool ... 426
9.13.1 Lean Optimisation of the BIM Tool - Introduction ... 426
9.13.2 Setting up appropriate working environments within the BIM tools ... 428
9.13.3 Setting up automation within the BIM tools ... 430
9.13.4 Setting up view controls and material rendering ... 432
9.13.5 Taking advantage of software features ... 435
9.13.6 Using models and multi models ... 437
9.13.7 Internal Collaboration ... 440
9.13.8 Defining the layer structure ... 441
9.13.9 Object Library Development ... 442
9.14 Validation Methods ... 452
9.15 Setting up a BIM group ... 453
9.16 Quality Procedures ... 453
9.17 Definition of BIM roles and responsibilities ... 454
9.18 Developing Interoperability ... 455
9.19 Ensuring the necessary insurances and indemnity is in place ... 457
9.20 Undertaking live projects - Introduction ... 458
9.20.1 MillaChip Phase 3 ... 459
9
9.21 Summary of Chapter 9 ... 470
CHAPTER 10 Explanation of the evaluation stage ... 472
10.1 Introduction ... 472
10.2 Post Project Review ... 472
10.3 Identifying new uses for the capabilities developed ... 474
10.4 Stabilise success / standardise process and implement method ... 474
10.5 Setting up Continuous Improvements ... 475
10.6 Verify if improvement principles are correct ... 477
10.7 Recommendations for the case study company ... 480
10.8 Summary of Chapter 10 ... 480
CHAPTER 11 Review of the BIM implementation Framework ... 482
11.1 Introduction ... 482
11.2 Development of an improved framework ... 483
11.3 Amended stages of the BIM Implementation Framework ... 487
11.3.1 Stage 1 Approvals and Controls ... 487
11.3.2 Stage 2 Investigation and definition ... 489
11.3.3 Stage 3 What is to be achieved, promoting the vision and developing a benchmarking strategy ... 491
11.3.4 Stage 4 Development of the BIM implementation plan ... 492
11.3.5 Stage 5 Mobilization for prototype projects ... 493
11.3.6 STAGE 6 Undertaking Prototype Projects ... 494
11.3.7 Stage 7 Mobilization for undertaking the live projects ... 495
11.3.8 Stage 8 Undertaking live projects using BIM ... 496
11.3.9 Stage 9 BIM implementation Review ... 497
11.4 Summary of Chapter 11 ... 497
CHAPTER 12: CONCLUSION ... 499
12.1 Introduction... 499
12.2 Achievement of the Research Aim and Objectives ... 500
12.3 The Contribution to Knowledge... 501
12.4 The Main Conclusions ... 505
12.5 Recommendations for Future Improvements ... 507
12.6 Conclusion... 509
References ... 511
11
Tables
Table 3.01 Concepts behind BIM 116
Table 3.02 Definitions of BIM 118
Table 3.03 – Appendix A- Extract from the Government Strategy Action (Revised July 2012) Item 7
Table 3.04 Analysis of BIM Guidelines (Staub-French 2011) 171 Table 3.05 Showing the academic papers written addressing the major
areas affecting BIM adoption. The relevance of several more recent papers will be documented in due course. (Youngsoo Jung 2010)
175
Table 3.06 BIM Project execution guides as listed in the Pennsylvania State University BIM execution guide (Appendix H)
176
Table 3.07 Sources of resistance to change (Eccles, 1994, cited in Buchanan and Badham, 1999, p.199)
182
Table 3.08 BIM Hurdles (FMI/CMAA 2007) 184
Table 3.09 Building Surveyor’s scoring of the relative importance of barriers to take up BIM
184
Table 4.01 Synergies between BIM and Lean Construction (Sacks et al 2010)
192
Table 4.02 BIM enables Lott + Barber to Save Time and increase productivity (Autodesk 2007)
194
Table 4.03 BIM Object Information Categories and the uses that information
197
Table 4.04 Analysis of the technical, operational and business capabilities of BIM (adapted from Aranda-Mena 2008)
199
Table 4.05 BIM benefits (FMA/CMAA 2007) 201
Table 4.06 Construction Industry Problems and BIM solutions 205 Table 5.01 Research Philosophy and research methods (Adapted from
Galliers 1992; Mingers, 2003)
225
Table 6.01 Activities required to bring about organizational change (Tzortzopoulos 2004)
256
12 undertake action research as part of a BIM implementation
Table 7.01 Non BIM, BIM and Intelligent BIM Artifacts 307 Table 7.02 Review of how better quality objectives can be achieved at
John McCall Architects
311
Table 8.01 BIM objectives MoSCoW Chart 351
Table 10.01 Review of Key performance indicators 479 Table 11.01 Revised and improved BIM implementation framework 487 Table 12.01 Summary of research (journals, conferences and book
chapters) publications (Appendix B)
581
Figures
PageRelating to Chapter 1
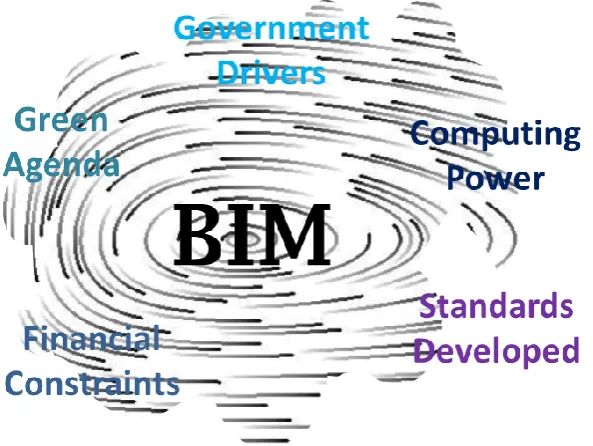
Figure 1.01 BIM at the heart of the storm 46
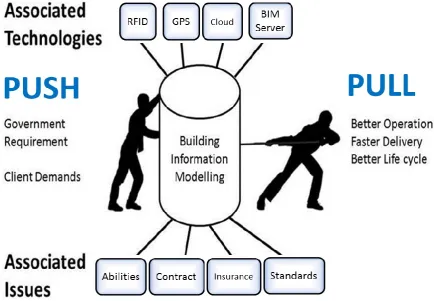
Figure 1.02 Internal and external factors effecting the adoption of BIM 48 Figure 1.03 Timing expected to Green BIM Market Penetration
(according to non-green BIM companies) (McGraw Hill Construction 2010)
49
Figure 1.04 Chart showing how computer power has and is predicted to double every 18 months (Carrier 2012)
49
Figure 1.05 How methods of communication have changed as computing power has grown (Carrier 2012)
50
Figure 1.06 The Five stages in the decision innovation process (adapted from Rogers 1962)
50
Figure 1.07 Market Adoption Model indicating the likely adoption of BIM over time (Moore, 1999)
51
Figure 1.08 Trends showing searches for the term BIM (note the news reference volume in 2012) (Google Trends 30/6/2012)
52
Figure 1.09 The change from CAD to BIM at Architectural Firm (20 staff) Neeley Lofrano San Francisco (Neeley 2010)
52
13 2012 -2020 (Machinchick 2012)
Figure 1.12 Views on adopting BIM adapted from NBS survey 2010 (Hamil, 2010)
54
Figure 1.13 Building information modelling (BIM) framework for practical implementation showing frequency of research (Jung et al 2010)
55
Figure 1.14 The gap this research is to address 56 Figure 1.15 A diagram of transitional research 57 Figure 1.16 The Technology Readiness Model (Ocean energy industry
2013)
57
Figure 1.17 Research Objectives 58
Figure 1.18 Graph of performance against time when implementing new business practices (ANGL 2012)
59
Figure 1.19 The CIFE Horseshoe method of Transitional Research (Kunz 2007)
60
Figure 1.20 Showing area cover by this research 62
Figure 1.21 Structure of Thesis 64
Relating to Chapter 2
Figure 2.01 Challenges to be overcome by the architect 67 Figure 2.02 Cost and Time predictability of construction projects in the
UK (2011 Industry Performance Report, Construction Excellence)
68
Figure 2.03 Profitability and Productivity on construction projects in the UK (2011 Industry Performance Report, Construction Excellence)
69
Figure 2.04 Issues and Problems within the Construction Industry (findings from literature review)
69
Figure 2.05 Findings of the Egan Report (1998) 70 Figure 2.06 How have we done against Egan’s targets? (Wolstenholme
2009)
71
14 Government 2013)
Figure 2.08 Concept of a FAST analysis (Wixson, J. 1999) 72 Figure 2.09 - Appendix A - A FAST Analysis undertaken to better
understand the needs of the construction industry
562
Figure 2.10 How to improve the construction industry generated by FAST analysis
73
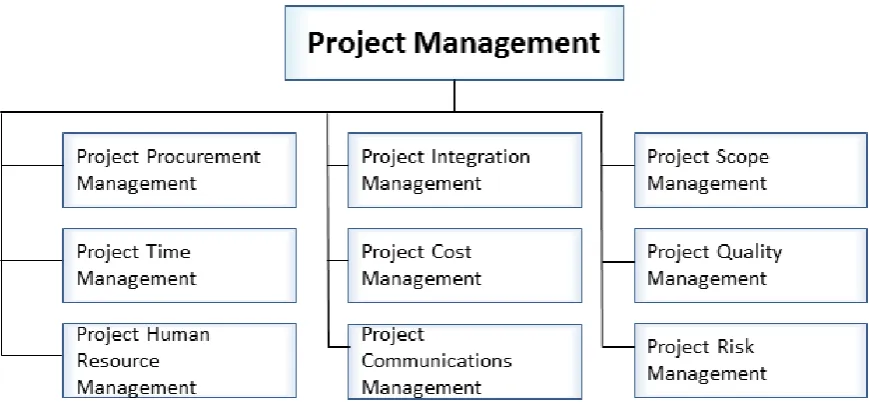
Figure 2.11 A Project Management Framework (PMI 2001) 74 Figure 2.12 A large portion of the money spent in the construction
industry is wasted, especially when compared to the manufacturing industry(Eastman et al 2008)
74
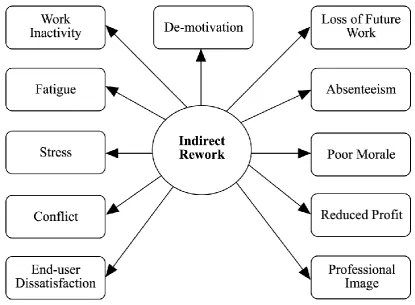
Figure 2.13 The consequences of rework on the project team (Love 2002)
75
Figure 2 14 Jobs won as percentage of jobs chased (Collander 2012) 76 Figure 2.15 Types of non-productive time in an architectural office 77 Figure 2.16 Electronic Document use in 2007 in US construction
(FMI/CMAA 2007)
77
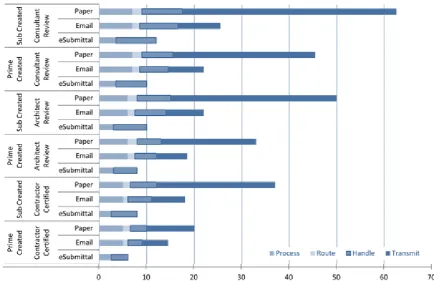
Figure 2.17 The Value Added Analysis of the Construction Submittal Process (East , Love 2011)
78
Figure 2.18 Number of fatal injuries by main industry, averaged from 2007/08 to 2011/12 (HSE 2013)
79
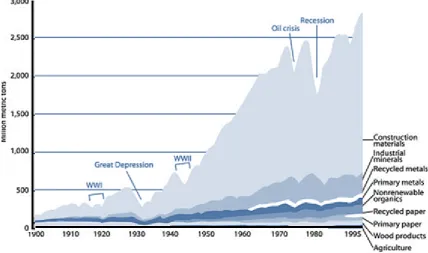
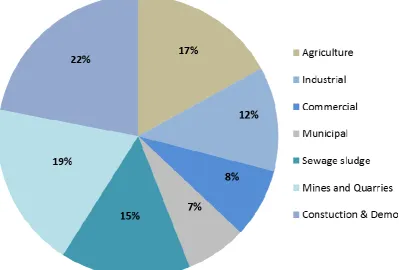
Figure 2.19 Use of raw materials curve, US, 1900 ‐ 1995 (Matos 1998) 80 Figure 2.20 Types of waste generated by weight in the UK in 1999
(DETR, 2000)
81
Figure 2.21 Showing the comparable water usages in Bangladesh, UK, Malawi and the USA (BBC 2012)
82
Figure 2.22 Average single family residential water use (USA) (Knight 2011)
82
Figure 2.23 Data normally lost using traditional contracts and traditional methods
83
Figure 2.24 Changes in global average temperature, global average sea level and northern hemisphere snow cover (Soloman 2007)
84
Figure 2.25 Global warming estimations of past and future global warming (Soloman 2007)
15 Figure 2.26 The three of areas sustainability illustrate interdependence
of the elements (Adams 2006)
85
Figure 2.27 UK sectorial CO2 emissions to 2050 on an 80% emission reduction path (Committee on Climate Change 2008)
85
Figure 2.28 Challenges of sustainable construction in a global context (Huovila et al 1998)
86
Figure 2.29 Total energy consumption per sector (MacArthur 2010) 87 Figure 2.30 Final energy consumption by fuel 1970 to 2010 in the UK
shown using thousand tonnes of oil equivalent (Source: Department of Energy and Climate Change - Digest of UK Energy Statistics Annex, Table 1.1.5)
87
Figure 2.31 Estimate of carbon footprint of UK construction 2007 (Department of Business Innovation and Skill 2010)
88
Figure 2.32 Carbon dioxide emissions of the code for sustainable homes (Barrett 2007)
88
Figure 2.33 Total carbon emissions when different levels of code for sustainable homes is applied for a two bedroom flat (RIBA 2009)
89
Figure 2.34 The architectural practice as an entity 90 Figure 2.35 Number of employees (as a percentage) in Chartered
Architectural Firms
91
Figure 2.36 Reported main drivers of innovation among broader innovators in construction (BIS Community Innovation Survey 2011)
92
Figure 2.37 The architect within the development process 92 Figure 2.38 Changes continually taking place within the architectural
professions
93
Figure 2.39 Knowledge need during the architectural design process 94 Figure 2.40 The building requirements normally to be met by architects
(Whole Building Guide 2013)
95
Figure 2.41 The challenges facing an architectural company (adapted from Fridstein 2012)
95
16 Figure 2.43 The Age of Housing Stock in the UK (Source: CLG Live
tables, table 110: Year Built by Region)
97
Figure 2.44 Household estimates and projections by household type, England Source : CLG Live Table 402 (Goodier 2010)
98
Figure 2.45 Disability Prevalence and the Need for Assistance by Age: 2010
98
Figure 2.46 Live births: England and Wales 1900 – 2010 (Blastland 2012)
99
Figure 2.47 Share of Immigrants in the UK Working – Age Population, 1979 to 2007 (Somerville 2009)
99
Figure 2.48 Tasks performed by Architects (source
http://www.aapei.com/pdfs/RAIC-Architectural-Fees.pdf)
101
Figure 2.49 The core of the architectural project process 102 Figure 2.50 – Appendix A – Stakeholder Interaction Diagram 563 Figure 2.51 The major activities performed by architects to achieve
effective project delivery
103
Relating to Chapter 3
Figure 3.01 - Appendix A – BIM literature review mindmap
Figure 3.02 New demands and new tools leading to improved results 108 Figure 3.03 The Media affects our thinking (Thomas 2013) 109 Figure 3.04 Using 3d to better explain concepts (Hall 2013) 109 Figure 3.05 The move from documents to data and modeling 110 Figure 3.06 Buildings being modeled to exhibit different characteristics 110
Figure 3.07 BIM for better results 111
Figure 3.08 What a system of the future might look like (Richens 1984) 112 Figure 3.09 Showing the differences between fixed, semi-parametric and
fully parametric modelling
114
Figure 3.10 Informational islands that have historically existed in the AEC industries (Hannus 1995)
114
Figure 3.11 An example of BIM being used for services modeling (Prince 2010)
17 Figure 3.12 Showing the relationship of BIM with other concepts 118 Figure 3.13 Reduction of the words Building, Information and Modelling
(Succar 2008)
118
Figure 3.14 Solution Components of BIM (Kiviniemi 2010) 120 Figure 3.15 Different ways of looking at BIM (Maunula 2008) 122 Figure 3.16 BIM as an intelligent building model with integrated
collaboration (Sebastian 2010)
123
Figure 3.17 The three imperatives of BIM (adapted from Amor 2011) 123 Figure 3.18 BuildingSMART standards triangle (Liebich 2011) 124 Figure 3.19 BIM viewed as a sociotechnical system with technological
base of social components (Kennerley 2012)
125
Figure 3.20 The BuildingSMART Logo 125
Figure 3.21 The IFC fields used to describe a doors elements simplified 127 Figure 3.22 - Appendix A – IFC Door Full schema
Figure 3.23 IFC categories that can be used in BIM objects (adapted from ISO 16739)
128
Figure 3.24 Levels of use of different IFC categories 2010 (Smith 2010) 129 Figure 3.25 Interoperability results and problems for a Wall generated in
Revit (Choi 2012)
130
Figure 3.26 A typical multi model workflow from the Senaatti Properties BIM Guides
131
Figure 3.27 Federated Wall Information using distributed information management (Suomi 2012)
131
Figure 3.28 DRUM – Distributed Information management (Suomi 2012) 132 Figure 3.29 BS1192 Showing how different forms of information may be
shared on a project
133
Figure 3.30 Diagram of a shared workspace (source Mott MacDonald) 134 Figure 3.31 A screen shot of the Asite CBIM portal 134 Figure 3.32 The concept of BIM 360 Glue (Autodesk 2013) 135 Figure 3.33 The development of COBie (Stephens 2012) 135 Figure 3.34 The standard tables that go to makeup COBie 136 Figure 3.35 - Appendix A - The COBie Responsibility Matrix (Building
18 Figure 3.36 - Appendix A - Visualization of the current COBie UK 2012
standards (BIM Gateway 2012)
Figure 3.37 The Cabinet Office Building Information Modelling Workflow (Bew et al 2012)
137
Figure 3.38 COBie tables to be completed at various project stage (Teicholz 2013)
137
Figure 3.39 A standard COBie template displayed in DDS software 138 Figure 3.40 Cobie Tables and the additional informational needs to
perform FM functions
139
Figure 3.41 Suggested extension to COBie with FMie to meet Facilities management needs (Aarsethl 2013)
139
Figure 3.42 Integrated Project Delivery (AIA 2007) 140 Figure 3.43 BIM as one part of Integrated Project Delivery (adapted from
Autodesk 2009)
141
Figure 3.44 Changes in the contractual relationships using IPD (Wilson and Dal Gallo 2013)
141
Figure 3.45 Examples of Objects showing different levels of detail (Ikerd 2013)
142
Figure 3.46 The E202 BIM Protocol AIA (2008) 143 Figure 3.47 Level of Detail Aligned with the COBie drops (The digital
plan of work and assemblies 2013)
144
Figure 3.48 The concepts behind Open BIM (Graphisoft Connect 2012) 145 Figure 3.49 Showing how the development of BIM relates to the
development of standards (BIM Task Group 2012)
146
Figure 3.50 – Appendix A - IT applications within the AECOO process (APCC)
Figure 3.51 Distinguishing different types of information (Hjelseth 2009) 148 Figure 3.52 Appropriate location of information (Mordue 2013) 149 Figure 3.53 The changes brought about by BIM (Fox 2006) 150 Figure 3.54 The development of BIM Level 1, Level 2, Level 3
(Department of Business, Innovation and Skills 2011)
150
19 Figure 3.57 The use of RFID Tags in the project lifecycle (Motamedi
2011)
153
Figure 3.58 The evolution of the human computer interface (Fernando 2012)
154
Figure 3.59 Development of contextual adaptive systems to aid decision support (Bai 2012)
154
Figure 3.60 Developing BIM by linking it to a case base reasoning library (Motowa 2013)
155
Figure 3.61 Classification of knowledge representations (Owen and Horvath 2002)
155
Figure 3.62 Types of Knowledge Representation traditionally used in the product development process ( Chandrasegaran 2012)
156
Figure 3.63 Rise of the digital information age (Vastag 2011) 157 Figure 3.64 The growth in the percentage of data stored on the cloud by
small and medium size companies. (Pham 2011)
158
Figure 3.65 Approaches to cloud computing (based on Varkonyi 2011) 158 Figure 3.66 Data from multiple sources populating multiple interfaces 159 Figure 3.67 Navisworks BIM software being used to visualize clash
detection
160
Figure 3.68 Setting up rule based checking for building access standards in Solibri Model Checker
160
Figure 3.69 An example of rule based checking using Bluethink house designer (Khemlani 2009)
161
Figure 3.70 The scope of visual analytics related to BIM (adapted from Keim 2008)
161
Figure 3.71 Form models, statistical models and process models all assisting in decision support (contains work by Eppler and Burkhart 2005)
162
Figure 3.72 Increasing the value of information through analytics (Richardson 2013)
162
20 Figure 3.76 Issue arising from the government strategy report and their
relationship to BIM (2011)
166
Figure 3.77 BIM guidelines and standards for different regions (Staub-French)
167
Figure 3.78 BIM Guidelines Positioning (Hooper 2010) 170 Figure 3.79 BIM competency sets (adapted from Succar 2010) 178 Figure 3.80 The Reasons why projects fail (KPMG 2010) 178 Figure 3.81 The Lazy User Model or concept of product diffusion (Collan
2007)
179
Figure 3.82 Identification of the challenges and strategies to adopt BIM by the Singapore Building Construction Authority (Kam 2011)
180
Figure 3.83 The New Software Effect on Productivity (Autodesk Inc, 2007)
180
Figure 3.84 Reduction in time spent to produce stage D information on schools (Robinson 2010)
180
Figure 3.85 Survey of how drawing work is done (NBS BIM survey 2012) 185
Relating to Chapter 4
Figure 4.01 The difference between creating a BIM system and using BIM to achieve benefits (Berard 2012)
188
Figure 4.02 Different ways to perceive value across the lifecycle of a construction project (Tillmann 2012)
188
Figure 4.03 The different cases in relation to BIM 189 Figure 4.04 Comparison of the automotive and aircraft industry with the
construction industry (Grassi and Zorgno 1999)
190
Figure 4.05 The Four Components of Lean Implementation (Rubrick 2013)
190
Figure 4.06 Elements that improve ROI for BIM users by discipline type (McGraw Hill Construction 2012)
193
Figure 4.07 Manpower savings at Ayers / Saint / Gross by using BIM (Brix 2005)
21 Figure 4.08 Benefits in terms of project hours comparing the first, the
second and third BIM projects undertaken using Revit (Aedas 2011)
195
Figure 4.09 The key benefits of Building Information modelling 196 Figure 4.10 The benefits of BIM from the perspective of different
stakeholders (Chelson 2010)
196
Figure 4.11 Capabilities affected by BIM adoption 198 Figure 4.12 Change that can occur with the adoption of BIM 202 Figure 4.13 The use of BIM for Sustainability analysis (adapted from
Azhar 2009)
206
Figure 4.14 Use of BIM tools for eco analysis throughout the building lifecycle (IES 2010)
206
Figure 4.15 The GLITNE methodology (Strand-Hanssen 2008) 207 Figure 4.16 A range of Eco tools used with BIM models (Azhar 2009) 207 Figure 4.17 Digital Broadcasting Contents Centre energy assessment
(Kim 2011)
208
Figure 4.18 System in development to use BIM for warning of health and safety issues
208
Figure 4.19 The development of a BIM based safety checking system (Zhang 2013)
209
Figure 4.20 Screen shot of the NBS Create Interface 210 Figure 4.21 Overlaying BIM models to show what has been inserted and
what has changed
210
Figure 4.22 The Kaust Solar Chimney construction sequence (Courtesy of OGER International and Gehry Technologies)
211
Figure 4.23 Automatic rule-based checking of building designs (Eastman 2009)
212
Figure 4.24 Structure of a BIM base rule checking system (Nawari 2012) 213
Figure 4.25 Metcalf’s Law 214
Figure 4.26 Using BIM automation to assist in the infrastructure lifecycle process (Meridian Systems 2008)
215
Figure 4.27 A BIM lifecycle costing system developed by Rider Levett Bucknall (Patchell 2012)
22 Figure 4.28 A BIM lifecycle costing system developed by Rider Levett
Bucknall (Patchell 2012)
216
Relating to Chapter 5
Figure 5.01 Research Onion (adapted from Saunders et al, 2006) 218 Figure 5.02 Research process for this study -Research Onion (adapted
from Saunders et al, 2006)
219
Figure 5.03 Philosophical choices for research (Lähdesmäki et al, 2010) 220 Figure 5.04 Factors affection the choice of research approach 223 Figure 5.05 Possible Research Strategies (Lähdesmäki et al, 2010) 227 Figure 5.06 Action research as unfreezing, changing and refreezing in a
new form
227
Figure 5.07 Action Research Cycle 226
Figure 5.08 Action Research (Stephenson 2012) 228
Figure 5.09 Research Process Design 230
Figure 5.10 Possible Data Collection Strategies (Lähdesmäki et al, 2010)
231
Figure 5.11 Choice of Data Collection Methods for social sciences (Sridhar 2008)
231
Figure 5.12 Knowledge Requirement Analysis diagram 232 Figure 5.13 Example of analysis of Data and Knowledge Acquisition 233 Figure 5.14 Deciding the best method to acquire knowledge 234 Figure 5.15 Possible Data Analysis Strategies (Lähdesmäki et al, 2010) 235 Figure 5.16 The Data Analysis Process (Seidel, 1998) 236 Figure 5.17 Visualization formats for different knowledge management
tasks
237
Figure 5.18 Projects typical of those undertaken by John McCall Architects
239
Figure 5.19 Example of the existing organization structure at John McCall Architects
240
Figure 5.20 Example of the staffing structure used to undertake an Architectural Project
23 Figure 5.21 Network diagram for John McCall Architects 242 Figure 5.22 Sketchup software demonstration IFC capabilities using the
IFC2SKP plugin
242
Figure 5.23 A comparison of terms commonly used in Microstation and AutoCAD , AutoCAD being the most widely adopted CAD software (Aarhus 2005)
244
Figure 5.24 A typical Microstation V8 interface showing the development of coordinated housing elevations
245
Figure 5.25 Methods of changing John McCall Architects file format to remove the task of file translation
246
Figure 5.26 John McCall Architects, cash in the bank, net worth, current liabilities and current assets up to 2011 (Companycheck 2012)
248
Relating to Chapter 6
Figure 6.01 Major developments in the history of enterprise architecture (Hagan 2004)
252
Figure 6.02 How business may change to an improved enterprise architecture (Hagan 2004)
253
Figure 6.03 BIM and its possible links to other data systems used within architectural practice
254
Figure 6.04 Definition of different types of projects (Obeng 1994) 257 Figure 6.05 Defining change as the basis of developing the BIM
execution plan
261
Relating to Chapter 7
Figure 7.01 How to measure the benefits of BIM a case study approach (Barlish 2011)
265
Figure 7.02 Process to be undertaken as part of the business case review workshop
266
24 objectives
Figure 7.04 The Strategic Alignment Model (Adapted from Henderson and Venkatraman 1994)
267
Figure 7.05 The associative benefits of adopting BIM 268 Figure 7.06 Use of metrics to evaluate the level of success of a BIM
adoption
269
Figure 7.07 NBIMS CMM Chart (McCuen 2006) 270 Figure 7.08 The normal flow of an A3 sheet design 272 Figure 7.09 - Appendix A - A sheet using the A3 method to
describe the business case for moving to BIM
Figure 7.10 Why Organisation use Consultants (adapted from Ringland and Skaukat 2004)
274
Figure 7.11 The advert posted to attract the BIM Champion for the BIM implementation project at John McCall Architects
274
Figure 7.12 The selection criteria used at John McCall architects to select the BIM champion
275
Figure 7.13 The necessary BIM Champion skills as documented in the Preliminary BIM learning outcomes framework (July 2012) related to BIM maturity tasks
276
Figure 7.14 BIM Competency Sets v1.1 (Succar 2010) 277 Figure 7.15 BIM knowledge being spread by staff trained by the BIM
champion
278
Figure 7.16 The open innovation process using an external technology base (Chesbrough 2003)
279
Figure 7.17 Example of a non-completed business model canvas 280 Figure 7.18 John McCall Architects Customer segments 281 Figure 7.19 The value proposition of most architectural practices 282 Figure 7.20 Business model canvas created subsequent to the action
research being undertaken at John McCall Architects
283
Figure 7.21 The move from CAD to BIM transferring existing knowledge 284 Figure 7.22 The review of the layers used in Microstation and
consideration if they should be applied when using ArchiCad 285
25 Figure 7.24 Rich pictures used at method of documenting and
understanding the processes used at John McCall Architects 286
Figure 7.25 An example of a mind map generated during the analysis of John McCall Architects Processes
287
Figure 7.26 The proposed draft outline of the new RIBA plan of work (RIBA 2012)
288
Figure 7.27 An example of the result of value stream mapping 289 Figure 7.28 - Appendix A - Process Map developed of the
informational interactions
Figure 7.29 Investigation of existing process 291 Figure 7.30 Further analysis undertaken on the architectural process
map to identify the benefits of using BIM
292
Figure 7.31 The Skanska BIM model (Jeffrey 2012) 293 Figure 7.32 Data duplicated and store in multiple file types at John
McCall Architects
294
Figure 7.33 Showing different file types and the duplicate data they contain
292
Figure 7.34 3D BIM graphical data model and BIM project support model 295 Figure 7.35 - Appendix A - A3 analysis for system for electronic
document management
Figure 7.36 - Appendix A - A3 sheet produced showing the justification for development of the project database
Figure 7.37 - Appendix A - The structure of the database developed
Figure 7.38 The overall structure of a practice database defined 296 Figure 7.39 Showing the principle of a database being used to maintain
quality information
297
Figure 7.40 - Appendix A - Project Database developed as a result of the data handling analysis undertaken at John McCall Architects
Figure 7.41 A diagram of the inputs and multiple outputs from the database developed at John McCall Architects
298
26 databases at John McCall Architects
Figure 7.43 Methods adopted to determine best practice 300 Figure 7.44 Records taken of the artifact review of the Edith Street
Project
303
Figure 7.45 The architect providing different model output to different parties
304
Figure 7.46 Artifacts produced during the architectural development process
304
Figure 7.47 Shows a typical planning submission drawing set produced using CAD by John McCall Architects
305
Figure 7.48 The different areas of SWOT analysis (adapted from BIM Sphere 2013)
313
Figure 7.49 A diagram of those issues covered in the PESTLE analysis at John McCall Architects
314
Figure 7.50 External stakeholder diagram for an architectural practice 316 Figure 7.51 The process of meeting stakeholder requirements 317 Figure 7.52 Showing how affinity diagrams can be generated from
stakeholder feedback
318
Figure 7.53 The ISO 9126 Standard to evaluate software quality 319 Figure 7.54 Major areas of consideration when selecting a BIM tool 320 Figure 7.55 Internal and External components of a BIM tool review 321 Figure 7.56 Comparative usage of CAD and BIM software (NBS 2013) 322 Figure 7.57 Screen shot of the BIM Design Tool List from the Georgia
Tech BIM Wiki (Georgia Tech 2012)
323
Figure 7.58 Questions to be asked when analyzing an BIM tool for Architectural Practice
325
Figure 7.59 An example of a review of different BIM authoring tools (information from Google Trends 1/12/2012) and the related growth of interest in BIM and Revit software in the UK (information from Google trends 1/12/2012)
326
Figure 7.60 Part of a PowerPoint presentation analyzing the capability of different BIM software’s
328
27 interfaces of the BIM software reviewed
Figure 7.62 Reviewing the hardware and operating systems needed by different BIM software
329
Figure 7.63 The BIM authoring tool test process used at John McCall Architects
330
Figure 7.64 Test undertaken to evaluate the BIM System to select 332 Figure 7.65 The results of the 3 hour test using ArchiCad software 333 Figure 7.66 Test model produced using Revit software 334 Figure 7.67 Test models produced using Allplan software 334 Figure 7.68 Review of the three BIM Tools tested at John McCall
Architects
335
Figure 7.69 - Appendix A - Comparative review of BIM authoring tool capabilities
Figure 7.70 BIM SWOT analysis undertaken at John McCall Architects on the BIM tools being reviewed
338
Figure 7.71 Table of BIM tool cost analysis 336 Figure 7.72 A comparison of Autodesk Revit LT 2013 and Autodesk
Revit 2013 (JTB World 2012)
340
Figure 7.73 Comparing different types of eco software (Source HCC, Atlanta, Azhar 2009)
341
Figure 7.74 Elements to be used to assist in definition of the future state 343 Figure 7.75 Showing predicated company expansion of workload as part
of BIM adoption
343
Figure 7.76 Areas which require a Gap Analysis to be undertaken 344
Relating to Chapter 8
Figure 8.01 Constraints for innovation (Brown 2009) 348 Figure 8.02 Using the MoSCoW technique to define BIM functional
requirements
349
Figure 8.03 Changing the contribution of members of staff engaged in a BIM implementation (Agile 2007)
352
28 2006)
Figure 8.05 The change from Amotivated to Intrinsically Motivated (Bisset 2009)
354
Figure 8.06 Changing the mind set to adopt BIM (Hermund 2009) 355 Figure 8.07 The process of building a vision (Senge 1994) 357 Figure 8.08 CAD vs BIM – A visual aid (source unknown) 358 Figure 8.09 The persuasive story pattern adopted for many of the BIM
implementation presentation at John McCall Architects
359
Figure 8.10 Sample slides from vision building presentations given at John McCall Architects
359
Figure 8.11 Slide from presentation showing Lean wastes as a justification for adopting BIM (GoLeanSixSigma 2013)
360
Figure 8.12 Showing how the analysis of the current situation and an understanding of best practice feed into the improvement plan
365
Figure 8.13 The step process to define the BIM Implementation Plan 366 Figure 8.14 Items to be included in a BIM implementation Plan 366 Figure 8.15 - Appendix A - Framework for analysis of BIM
competency sets (adapted from Succar 2010)
Figure 8.16 - Appendix A - A simple Program Used at John McCall Architect to implement BIM
Figure 8.17 Types of BIM training (Rinella 2012 Anshen & Allen Architects)
368
Figure 8.18 The range of skills required by different role as part of a BIM implementation (The AEC (UK) BIM Protocol V2 2012)
369
Figure 8.19 Annual investments in BIM at David Miller Architects (Miller 2011)
370
Figure 8.20 The forgetting curve (Ebbinghaus 1775) 371 Figure 8.21 The knowledge of the BIM to that needs to be developed
(Adapted from Sierra (2006)
372
29 Figure 9.01 Issues related to Prototyping (Hillgren,P. Seravalli, A.
Emilson, A. 2011)
377
Figure 9.02 Training options for BIM 379
Figure 9.03 Proposed areas of training for Production Staff when adopting BIM
380
Figure 9.04 Shows the different decision making needs at different levels within an architectural practice
381
Figure 9.05 Different level of staff ability 381
Figure 9.06 The Addie Model (Gupta 2012) 382
Figure 9.07 Analysis of best methods of knowledge acquisition (Dale, 1868)
382
Figure 9.08 Software Training presentations given as part of a BIM adoption
383
Figure 9.09 Teaching staff how to login to the BIM software 383 Figure 9.10 Training on the ArchiCad Interface given at John McCall
Architects
384
Figure 9.11 Training given at John McCall Architects on the different file types used in ArchiCad 13 and when these files should be used
384
Figure 9.12 A training slide from the project mark-up presentation given to senior members of staff at John McCall Architects
385
Figure 9.13 An example of the subjects cover at the Archicad University Training schools
386
Figure 9.14 A 2d plan of housing development first sketched up in AutoCad software
387
Figure 9.15 Model developed in EliteCad of residential element for the Build London Live Competition
389
Figure 9.16 The 3DMD site for the Build London Live competition showing build sequence using Synchro software
390
Figure 9.17 A screen shot of the Asite BIM collaboration platform used during the Build London Live competition
391
Figure 9.18 The first prototype model produced of the Grow home using Archicad
30 Figure 9.19 An ArchiCAD wall and pointer showing the distance and
angle parameters
393
Figure 9.20 An important lesson learnt while undertaking the Leathers Lane Project was how to use the trace option
394
Figure 9.21 Generation of the kitchen designs from individual objects 395 Figure 9.22 The second prototype a cut away model of Leathers Lane
produced using ArchiCad
395
Figure 9.23 Leathers Lane, work in progress, ground floor plan and axonometric view of model and cross section view
396
Figure 9.24 Ariel view of the constructed Leathers Lane Facility (source Google Maps)
397
Figure 9.25 Process and Cultural change (Maccleamy 2004) 397 Figure 9.26 The site allocated for the Salford House4life competition 399 Figure 9.27 The material palette used for the Salford Home 4 life
competition
399
Figure 9.28 The combined housing models being used to tested out the resultant urban form
396
Figure 9.29 An example of a low resolution render taken as the design progressed
396
Figure 9.30 The high rise flat units being combined to assess the combined visual form
400
Figure 9.31 Plan developed for the courtyard house used on the Salford House 4 Life competition
401
Figure 9.32 Salford Homes for Life Competition render using Artlantis software looking East
401
Figure 9.33 Salford Homes for Life Competition render using Artlantis software looking West
402
Figure 9.34 View showing the single storey dwellings with roof top gardens
402
Figure 9.35 Block plan of single storey models used to build up the master model of the Salford 4 Life design model
403
Figure 9.36 Testing of IES software for thermal investigation of BIM models
31 Figure 9.37 Diagrams showing the need to simplify BIM models into
simpler volumes so that suitable result could be achieve using eco analysis software
405
Figure 9.38 A coloured 3D model printed using the Z-Corp process 408 Figure 9.39 A selection of 3D printer outputs reviewed at John McCall
Architects
408
Figure 9.40 Outsourced training being undertaken at John McCall Architects
409
Figure 9.41 Information concerning the BRE accredited BIM training courses
411
Figure 9.42 Powerpoint presentations provided by ArchiCad as part of this BIM Curriculum
413
Figure 9.43 Help and training available direct from the ArchiCad 16 software
413
Figure 9.44 How project specific working practices are defined in an architectural practice
415
Figure 9.45 Example of a process map developed for a housing project (These were developed after undertaking the case study research)
417
Figure 9.46 (a) Tool-activity matrix (b) BIM Tool compatibility chart (London 2008)
418
Figure 9.47 The list of design applications in use at HOK, and an
explanation of the different categories in which they belong. (Khemlani 2008)
419
Figure 9.48 BIM File Organisation (Heng 2011) 420 Figure 9.49 An example of the main contents of the BIM manual
developed for John McCall Architects
421
Figure 9.50 An image taken from the Norwegian Home Builder’s Manual (2011)
422
Figure 9.51 A screen shot from the contents page of the BIM manual developed for John McCall Architects
423
Figure 9.52 A screen shot of an example page from the John McCall Architects BIM manual
32 Figure 9.53 An example of how multiple criteria come into play when
selecting the appropriate way to construct a BIM model
425
Figure 9.54 Methods of BIM software Optimisation used at John McCall Architects
427
Figure 9.55 Showing initial decisions to be made when setting up a BIM system
428
Figure 9.56 Showing the difference between net area and usable area 429 Figure 9.57 Files that it was necessary to customise at John McCall
Architects to optimise the use of the ArchiCAD software
430
Figure 9.58 Setting up predefined view sets, sheet sets and issue sets to save time when working in Archicad
431
Figure 9.59 Development of an automated title block generated from project information
432
Figure 9.60 Setting up predefined model views to save time when working in Archicad
433
Figure 9.61 A tabled used to decide what should and should not be shown within the predefined model views
433
Figure 9.62 Setting the model view definitions for fills in John McCall Architects
434
Figure 9.63 Showing brickwork configured and not configured to the Lightworks rendering engine in ArchiCad 13
435
Figure 9.64 The floor construction add on tool for ArchiCad which makes the design of foundation easier
436
Figure 9.65 Example of roof design develop using the roof maker add on in ArchiCad
436
Figure 9.66 The RAL colour add on to be used with ArchiCad 436 Figure 9.67 Addon tools available for download and use in ArchiCad 437 Figure 9.68 Diagram showing the use of Units and sub units to create a
BIM master model (Please note this approach maybe suitable in some circumstances and not in others.)
439
Figure 9.69 Directory Structure of Project BIM Files developed at John McCall Architects
439
33 Architects
Figure 9.71 Showing model sharing using an ArchiCad teamwork server 440 Figure 9.72 Amended ArchiCad 13 layer structure adopted at John
McCall Architects
441
Figure 9.73 Setting up layer combinations specific to certain types of drawings produced in ArchiCad
442
Figure 9.74 Explaining the development of an information rich BIM object
443
Figure 9.75 The potential saving by developing shared object libraries 443 Figure 9.76 Use of the standard library, the company library and a
custom project library to provide objects for an individual project, a system used at John McCall Architects
444
Figure 9.77 The process of developing a BIM model and time savings possible on repeat BIM projects
444
Figure 9.78 Examples of Course, Medium and Fine object views 445 Figure 9.79 An example of a BIM library of furniture developed to comply
with lifetime home requirements
446
Figure 9.80 The ArchiCad object menu for inputting IFC data into objects 447 Figure 9.81 A screen shot taken of the NBS National BIM Library which
now provides a range of BIM object suitable for use in a range of BIM Tools (NBS 2012)
448
Figure 9.82 Showing how traditional CAD details where developed as object or component types within the BIM authoring tool
449
Figure 9.83 Part of a presentation given to discuss the object libraries that should be created at John McCall Architects
451
Figure 9.84 Enhanced details from the energy savings trust 451 Figure 9.85 Design Review Checklist developed at John McCall
Architects to visually check designs
452
Figure 9.86 Screen shot of the John McCall Architects quality system located on the companies intranet
453
Figure 9.87 Using multi skilled operatives when using BIM 454 Figure 9.88 The type of BIM adoption at John McCall Architects
(adapted from Fox and Hietenen 2005)
34 Figure 9.89 An example of datamapping (Levring 2011) 456 Figure 9.90 Show direct data exchange and data upload to a modelling
collaborative system
457
Figure 9.91 A taxonomy of legal limitations in BIM (Turk Ž 2011) 458 Figure 9.92 The site plan of Millachip Phase 3 generated from a BIM
model
460
Figure 9.93 Drawings produced on the Millachip Phase 3 project 460 Figure 9.94 The standard object key developed as part of the Millachip
Phase 3 project
461
Figure 9.95 Areas for the Millachip phase 3 project automatically generated from the model
461
Figure 9.96 The 3d BIM model being used to help resolve detailing issues on the Millachip Phase 3 project
462
Figure 9.97 One of the bungalows produced for the Millachip project showing investigation of the roof wall interface
462
Figure 9.98 An email on Millachip Phase 3 including a 3d image from a BIM model being used to resolve detailing issues with other disciplines
463
Figure 9.99 The first commercial project Millachip Court Phase 3 produced using ArchiCad
463
Figure 9.100 Being able to visualize the kitchen design while testing out alternative kitchen arrangements
464
Figure 9.101 Investigation of solar studies generated from archicad models
464
Figure 9.102 A standard set of 2d details drawn for the Millachip phase 3 project
465
Figure 9.103 Filtering the model on the Millachip Phase 3 project to just send the structural elements to the structural engineer
465
Figure 9.104 Automatically generating wall schedules from the BIM model 466 Figure 9.105 An elevation from the Millachip project using the John
McCall Architects predefined line weights and styles
466
35 Figure 9.108 The Broomlane development completed 468 Figure 9.109 An example of an experiment to make the BIM model of
Broomlane look like a watercolour sketch
469
Figure 9.110 Use of the Broomlane model to communicate with subcontractors
469
Figure 9.111 Use of Virtual Building Explorer in 3d mode at John McCall Architects
470
Relating to Chapter 10
Figure 10.01 Projects where knowledge acquired through doing is not effectively transferred
476
Figure 10.02 Projects where knowledge acquired through doing is effectively transferred
476
Figure 10.03 How the time taken to undertake tasks can be reduced though a process of action reflection and application of improved methods
477
Relating to Chapter 11
Figure 11.01 Original and revised stages for BIM implementation 482 Figure 11.02 The relationship of stage, activities and tasks in the BIM
adoption process (BIM implementation components from Succar 2011)
484
Figure 11.03 Flowchart of Stage one Setting up approvals and controls for a BIM implementation project
489
Figure 11.04 Flowchart of Stage 2 Value Stream Analysis 490 Figure 11.05 Flowchart of Stage 3 Defining Vision 492 Figure 11.06 Flowchart of Stage 4 Planning the execution of a BIM
implementation
493
Figure 11.07 Flowchart of Stage 5 the mobilization stage of BIM implementation
494
36 Figure 11.09 Flowchart of Stage 7 Implementation – Active Project
Mobilization
496
Figure 11.10 Flowchart of Stage 9 Review of the BIM implementation project
497
Relating to Chapter 12
Figure 12.01 The flowchart of the BIM implementation Framework 505
Appendix A
Tables
Table 3.03a Extract from the Government Strategy Action (Revised July 2012) Item 7
560 Table 3.03b Extract from the Government Strategy Action (Revised July
2012) Item 7
561
Figures
Figure 2.09 A FAST Analysis undertaken to better understand the needs of the construction industry
562 Figure 2.50 Interchanges between architects and other disciplines –
Analysis by author
563 Figure 3.01 BIM Anatomy – Literature Mindmap v 1.0 (Hooper 2012) 564 Figure 3.22 The IFC fields used to describe a doors instance (Building
Smart 2012)
565 Figure 3.35 The COBie Responsibility Matrix (Building Smart 2012) 566 Figure 3.36 Visualization of the current COBie UK 2012 standards (BIM
Gateway 2012)
567 Figure 3.50 IT applications within the AECOO process (APCC) 568 Figure 6.06 A simple Program Used at John McCall Architect to
implement BIM
569 Figure 6.07 Part of a program developed for a BIM implementation
project at John McCall Architects
570 Figure 7.09 A sheet using the A3 method to describe the business case
for moving to BIM
571 Figure 7.28 Process Map developed of the informational interactions
37 of the project database
Figure 7.37 The structure of the database developed 575 Figure 7.38 Project Database developed as a result of the data handling
analysis undertaken at John McCall Architects 576 Figure 7.67 Comparative review of BIM authoring tool capabilities 577 Figure 8.13 Framework for analysis of BIM competency sets Sheet 1
(adapted from Succar 2010) 578
Figure 8.14 A simple Program Used at John McCall Architect to implement BIM
579 Figure 8.15 Part of a program developed for a BIM implementation
project at John McCall Architects 580
Appendix B
38
Abbreviation
ACA Association of Consultant Architects
ADDIE Analysis, Design, Development, Implementation, and Evaluation AEC Architecture Engineering and Construction
AECOO Architecture Engineering Construction Owner and Operation AIA American Institute of Architects
APCC Australasian Procurement and Construction Council Inc. ARMA Association of Record Administrators
BCIS Building Cost Information Service
BEIIC Built Environment and Innovation Council BEP BIM Execution Plan
BI Business Intelligence
BIM Building Information Modeling
BIS Department for Business Innovation and Skills BRE Building Research Establishment
BREEAM BRE Environmental Assessment Method BPD Building Performance Database
BPR Business Process Reengineering BRIC Brazil, Russia, India and China, BRM Benefit Realization Management C2C Cradle to Cradle
CABE Commission for Architecture and the Built Environment CAD Computer Aided Design or Computer Aided Drafting CAFM Computer Aided Facilities Management
CAPEX Capital expenditures CBA Choosing by Advantages CBR Case Based Reasoning
CDM Construction Design and Management Regulations CE Concurrent Engineering
CIFE Centre for Integrated Facility Engineering CIS/2 CIMSteel Integration Standards
CITE Construction Industry Trading Electronically
CMAA Construction Management Association of America CMMI Capability Maturity Model Integration
CNC Computer numerical control CO2 Carbon Dioxide
COBIT Control Objects for Information and related Technology COBie Construction Operations Building Information Exchange CONCOPS Concept of Operations
CORENET Construction and Real Estate Network COTS Commercial of the shelf software CPD Continued Professional Development
CPIC Construction Project Information Committee CURT Construction Users Roundtable
CRC Cooperative Research Centre
39 DDA Disability Discrimination Act
DDD Dimension Driven Design DDS Decision Support System DfM Design for Manufacture
DRUM Distributed Transactional Building Information Management EIS Executive Information System
ESF European Social Fund ER Exchange Requirement
FAST Functional Analysis System Technique
FMie Facilities Management Information Exchange GUID Globally Unique Identifier
GPS Global Positioning System GSA General Services Administration GSL Government Soft Landings HOK Hellmuth, Obata + Kassabaum
IBDM Integrated BIM and Document Management ICIM Interoperable Carbon Information Modelling I-CMM Interactive Capability Maturity Model
ICT Information Communication and Technology IDM Information delivery manual
IES Integrated Environmental Solutions ISO International Standards Organization IAI Industry Alliance for Interoperability
ICT Information Communication and Technology IDM Informational delivery manual
IFC Industrial Foundation Class
IFD International framework for dictionaries IIBA International Institute of Business Analysis ILM Institute of Leadership and Management InfoVis Information Visualization
IPD Integrated Project Delivery ISD Information system development IT Information Technology
JMA John McCall Architects JOC Job Order Contracting
KIBS Knowledge Intensive Business Services KKD Knowledge discovery and data mining KPI Key Performance Indicator
KTP Knowledge Transfer Partnership LESAT Lean Enterprise Self-Assessment Tool LOD Level of Detail
MCS Modelling Collaborative Systems MPS Model Progression Specification MoSCoW Must, Should, Could, Won’t MVD Model View Definition
NASA National Aeronautics and Space Administration NBS National Building Specification
NCE New Civil Engineer
40 NIST National Institute of Standards and Technology
NPT Non Productive Time OAS Office Automation System OD Organizational Development OGC Office of Government Commerce ONS Office of National statistics
OPEX Operational expenditure
NBIMS National Building Information Modeling Standard (USA) NBS National Building Specification
NIST National Institute of Standards and Technology
P3M3 Portfolio, Programme and Project Management Maturity Model PC Personal Computer
P-CMM® People Capability Maturity Model
PESTLE Political, Economic, Legislative, Social, Technological, Environmental PLIM Project Lifecycle Information Management
PLM Project Lifecycle Management
(PM)² Project Management Process Maturity Model PPC2000 Project Partnering Contract 2000
PPR Post Project Review
PRINCE 2 Projects in Controlled Environments PSets Property Sets
RAIC Royal Architectural Institute Canada R & D Research and Development
RFI Request for information
RFID Radio Frequency Identification RIBA Royal Institute of British Architects RICS Royal Institution of Chartered Surveyors
ROHSEI Return on Health, Safety and Environmental Investments ROI Return on Investment
RUCAPS Really Universal computer aided production system
RUP The Rational Unified Process (RUP) is an iterative software
development process framework created by the Rational Software Corporation
SAP Standard Assessment Procedure SBS Sick building syndrome
SIC Standard Industrial Classification SME Small to Medium Sized Enterprise SMM Standard Method of Measurement SPIE Specifier Property Information Exchange
SPICE Standardized Process Improvement for Construction Enterprises STEP Standard for the Exchange of Product model data
STL Standard Tessellation Language SUDS Sustainable urban drainage system
SWOT Strengths, Weaknesses, Opportunities and Threats TRADA Timber Research and Development Association TQM Total Quality Management
TVD Target Value Design UI User Interface
UK United Kingdom
41 USACE United States Corps of Engineers
USCG United States Coastguard USGBC U.S. Green Building Council VA Value Analysis
VBA Visual Basic for Applications VBE Virtual Building Environments VDC Virtual Design and Construction VR Virtual Reality
VPN Virtual Private Network
42
Acknowledgement
This thesis reflects the generosity of many people who have offered technical advice, professional expertise and enthusiasm over the period this thesis has been developed.
Firstly I would like to express my deepest appreciation to Doctor Yusuf Arayici, my supervisor and advisor. He has generously provided his invaluable insights, inspiring ideas, constant guidance, and warm encouragement. At various points within the development of this thesis Dr. Arayici provided critical guidance and advice.
I would like to give my great thanks to Professor Lauri Koskela, my co-advisor. He has generously given his time and shared his experience with me. His knowledge in the area of process improvement has provided an important foundation to my research. He has always available when I need help and guidance in the development of my research.
The basis of this thesis was developed through action research at John McCall Architects. Particular thanks must be given to Colin Usher (director) and Karen O’Reilly (architect and KTP supervisor) at John McCall Architects and the many staff who contributed. With their advice and direction was possible to gain an understanding of the problems and issues faced by small architectural organizations. I would also like to thank those at the University of Salford and the numerous conferences I have attended who have provided wisdom and insight into the area of my research.
I would also like to thank Gary Hope managing director of Infra Projects for his insight and vision of how to effectively integrate BIM into a project focused environment.
Thanks is also be given to the KTP staff and advisor and the Technology Strategy board which funded the Knowledge Transfer Partnership. The KTP provided the forum for the main bulk of research at John McCall Architects.
43
Declaration
I certify that this thesis is my own original work. It does not contain any material previously published or written by another person without due reference in the text. All the research has been conducted by the PhD candidate and no portion of the research referred to in this thesis has been submitted in support of an application for another degree or qualification at this or any other university or other institute of learning.
44
Abstract
BIM (Building Information Modeling) is a new radically different emerging approach to design, construction and facilities management. BIM promises to better facilitate the building development, construction and building operation. In this thesis the domain of small architectural practices is considered and how BIM can be implemented to address the problems both of operational and product efficiency and effectiveness.
Research has indicated that guidance on how small architectural practices should implement BIM is lacking (Jung et al 2010). This lack of guidance is one of the reasons why small architectural practices are disinclined to adopt BIM. There is a growing need for more knowledge on how BIM technology and processes can be and should be adopted and what happens when BIM technologies and processes are implemented and used in the practice of architecture.
The aim of this thesis is to develop a BIM implementation strategy framework for small architectural practices.
To identify of the problems and issues of BIM implementation in a small architectural practice, a two years of case study using action research was undertaken. This involved instigating, participating and observing the implementation of BIM within a small architectural practice. Both the internal and external benefits to the architectural practice were considered. The findings of this BIM implementation research were then recorded and reviewed providing a structured approach to BIM implementation. From this process of review and reflection a revised improved framework and suggested methods for BIM adoption was developed and documented. At each stage of the BIM implementation recommendations are made. The research was undertaken as part of a Knowledge Transfer Partnership between the University of Salford, John McCall Architects (a small architectural practice) and the researcher and author of this thesis. Though being actively involved in the BIM implementation it was possible to understand the issues and document the actions that were taken as part of the BIM adoption. The major limitation of this research is the focus on a single company as the source of evidence and research.
45