International Journal of Emerging Technology and Advanced Engineering
Website: www.ijetae.com (ISSN 2250-2459, ISO 9001:2008 Certified Journal, Volume 5, Issue 1, January 2015)
572
Estimation of Optimum Current for White Light Emitting Diode
(WLED) Luminary
Priyanka Jaiswal
1, C. K. Dwivedi
2 1,2Department of Electronics and Communication, University of Allahabad
Abstract— The physical verification of variation of life (as
defined by TM-21 method) with respect to operating current in commonly available White Light Emitting Diodes for practical environmental conditions is done. The optimum values of continuous current for useful life of more than 10 years continuous run has been determined by practical observations taken in a time span of around three months. The optimum values of suitable currents in LED based luminaries for long reliable life is suggesting. It is found that 7 milliampere is the optimum current at which LED can perform efficiently with long useful operational life.
Keywords— Luminary, Optimum Current, Reliable life,
Useful Operational Life, White Light Emitting Diode
I. INTRODUCTION
Different manufacturers introduced different kinds of electronic devices every year in consumer‘s market. Manufactures specified the rated value of parameters for the electronic device. These parameters are measured by the manufacturing company at certain specific conditions. When consumer used these devices then practical conditions like temperature, humidity, pressure etc. are not matched with those specific conditions under which the product is tested. In many cases life dependency of devices on value of continuous average current is not taken into consideration and current which is higher than optimum value is used due to value engineering. This results a deviation from the rated life of product that leads to dissatisfaction in the consumer‘s mind about the quality of the product. This is one of the reasons for unpopularity of luminaries using Light Emitting Diode (LED) although it has attractive features such as high efficiency, low cost, long life time and environmental benefits. For general lighting applications, nowadays White Light Emitting Diode (WLED) is preferred because of their record efficiencies in excess of 250 lmW-1(Lumen per watt) this value is the practical limit of WLED based light source because of 5% photopic sensitivity limit of human eye [1]. WLED have longer theoretical lifetime [2]. As a semiconductor based device, the reliability of WLED have limitations due to several physical mechanisms. The conduction and recombination mechanisms of the LED junction dominate the forward bias behavior of LEDs [3].
The junction temperature of LED increases due to the current flowing through the junction as well as due to ambient heat. The lumen depreciation rate of WLED is higher for current –induced junction temperature rise than the ambient heat induced junction temperature rise. The reason of this lumen depreciation is the blacking the phosphor gradually from center and yellowing the epoxy and packaging lens [4]. By driving higher current through WLED, higher illumination intensity is produced as LED is a current driven device. The degradation rate of illumination intensity increases with the increment in Direct Current (DC) drive current [5].This DC current stress results the decrement in reliability and useful life time of WLED [6,7]. Operating the LEDs at much lower current increases the cost and size. So determination of optimum current of LED is necessary to optimize the performance and useful life with the power saving capability. The goal of this study is estimate the optimum value of DC current for WLED by using the life time prediction method. By operating WLED at this optimum value of current, consumers can get the benefits of WLED luminary.
International Journal of Emerging Technology and Advanced Engineering
Website: www.ijetae.com (ISSN 2250-2459, ISO 9001:2008 Certified Journal, Volume 5, Issue 1, January 2015)
573 WLEDs are safe for human health by eliminating harmful risks of human‘s eye retinal exposures [9]. WLEDs provide warm white light color spectrum which is convenient for human vision in indoor (reading, writing, house work etc.) as well as for outdoor (street, office building etc.) lighting applications.
IES TM-21-11 is the technical mandate for long- term lumen-maintenance projections by specifying the extrapolation of measured lumen depreciation data points of LED light sources by IES LM-80-08 method [10,11]. Jiajie Fan et al. [12] introduced Degradation-data-driven method (DDDM) to analyze the lumen maintenance data of high power WLEDs, based on the general degradation path model.
In this paper, the optimum current is estimated by predicting the useful life time of WLEDs operated at different value of DC drive current. The sufficient luminous intensity necessary for human vision, less increase in junction temperature and long useful lifetime are the criteria of optimum current selection for WLEDs.
II. EXPERIMENT
The commercially available WLED are commonly nitride based. In this study 5 mm GaAlN double hetero junction WLED are used that generate warm white color spectrum by the use of phosphor. All WLEDs used in experiment are supplied from the same manufacturer in a single batch. The purpose of this study is to help the designers of LED luminaries in making of energy efficient lighting systems that will provide the expected result by proper selection of DC drive current.
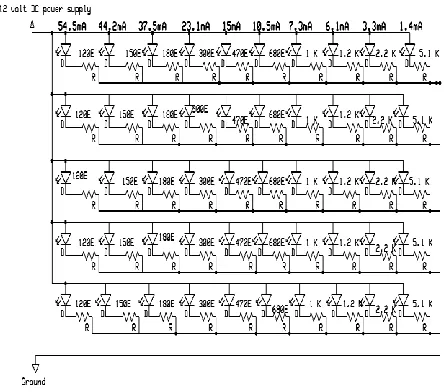
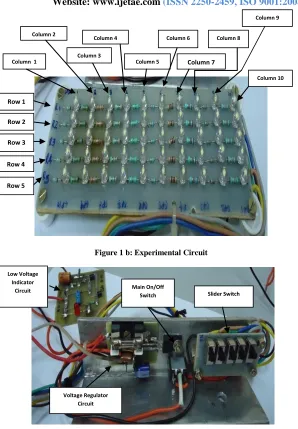
For this study, an experimental circuit is designed. The fifty WLEDs are placed in the fashion of 10 columns and 5 rows on the Printed Circuit Board (PCB) without an additional heat sink as shown in Fig.1 a and Fig.1 b. All WLEDs are individual i.e. they are not connected to each other in any combination. The 12 volts of DC power supply is used for driving the WLEDs with a voltage regulator circuit as shown in Fig. 2. A low voltage indicator circuit supports this DC power supply.
The indicator will turn ON when the input voltage of regulator circuit goes below 12 volts. The stabilized output voltage of 10.76 volts of voltage regulator circuit is used to drive all WLEDs.
The ten columns of WLEDs are derived by constant DC current of values 54.5mA, 44.2mA, 37.5mA, 23.1mA, 15mA, 10.5mA, 7.3mA, 6.1mA, 3.3mA and 1.4mA individually. The current for each column is decided by the value of resistor connected in series with all WLEDs individually.
All five WLEDs of each column are derived by same value of DC drive current. It is done to check the repetition of result five times as all are similar type WLEDs and derived by the same DC current.
[image:2.612.333.555.376.572.2]The value of illumination intensity of each WLED is measured by the luminance meter. For this the luminance meter is placed over WLED at a fixed distance. Five slider switches are used to turn ON /OFF the five rows during the experimental process as shown in Fig. 2.
International Journal of Emerging Technology and Advanced Engineering
Website: www.ijetae.com (ISSN 2250-2459, ISO 9001:2008 Certified Journal, Volume 5, Issue 1, January 2015)
[image:3.612.17.315.123.552.2]574
Figure 1 b: Experimental Circuit
Figure 2: 12 volt DC power supply with Regulator Circuit and Low Voltage Indicator Circuit
A. Experimental Procedure
Initially all the WLEDs were in OFF state. As explained above that each row in the experimental circuit has ten WLEDs and each WLED in that row is driven by specific value of DC current. By this manner, we can observe the rate of lumen depreciation with the burning time of WLED at ten different DC drive currents 54.5mA, 44.2mA, 37.5mA, 23.1mA, 15mA, 10.5mA, 7.3mA, 6.1mA, 3.3mA and 1.4mA. The value of illumination intensity is measured by Luminance meter. It takes 18 seconds (sec) to take the measurement of illumination intensity of a single WLED manually by luminance meter.
Step 1: At first, only the first row was turned ON by the slider switch and rests of the four rows were in the OFF state. The illumination intensity of all ten WLEDs of first row was measured by keeping luminance meter over WLEDs in a serial manner from left to right as shown in Fig. 1 b.
Step 2: Now, second row of WLEDs was turned ON by
slider switch while the first row was still ON. The illumination intensity value of each WLED in the second row was recorded in the same manner as performed with the first row.
Step 3: This process was repeated for rest of the three rows by turning ON each row one by one while keeping the WLEDs of previous rows in ON state. At the end of the process, all WLEDs will be in the ON state. By this process, the values of illumination intensity of WLED for ten different DC drive currents were recorded five times. It will check the repeatability of the result.
Step 4: As mentioned above that the 18 sec is the time
allotted for each WLED to take the measurement conveniently. So the total time elapsed in the measurement of fifty WLEDs was 900 sec or 15 minutes (min). After taking the measurement of last WLED (right most of fifth row), again light output of first WLED (left most of first row) was recorded by luminance meter just after 15 min from the starting time. The value of illumination intensity was measured simply by keeping luminance meter over all WLEDs individually in left to right direction (horizontally) and from first to last row (vertically) as all WLEDs were in ON state.
At the end of this step the value of illumination intensity of all WLEDs after 15 minutes from the starting time has been recorded. The burning time of all WLEDs will be same by the application of this procedure and data of lumen depreciation rate of all WLEDs will be recorded at regular intervals of 15 minutes individually for the first 15 hours of operation. The WLED based lighting systems generally suffered by thermal stress when they are used in real world application. This arises due to intermittent supply of power supplied to the lighting system. To consider this effect in our experiment, the power supplied to the experimental circuit by DC power supply was switched OFF and ON at random interval of time for first 15 hours of operation. This will not disturb the repeatability of the result because the burning period of all WLEDs will be same.
Step 5: From the sixteenth hour of operation, all WLEDs
were kept continuously ON as long burning period of WLED is required to predict the optimum current useful to get the long lifetime of WLED.
Row 1
Row 2
Row 3
Row 4
Row 5 Column 1
Column 2
Column 3 Column 4
Column 5 Column 6
Column 7 Column 8
Column 9
Column 10
Low Voltage Indicator
Circuit
Voltage Regulator Circuit
Main On/Off
International Journal of Emerging Technology and Advanced Engineering
Website: www.ijetae.com (ISSN 2250-2459, ISO 9001:2008 Certified Journal, Volume 5, Issue 1, January 2015)
575 The output data were recorded at random interval of time for all WLED individually as described in step 4.
The normalized value of illumination intensity with respect to burning time period of WLEDs was plotted individually for all WLEDs as shown in Fig. 4. Then linear least square curve fitting was used on these plots. The point where the lumen depreciation curve intercepts the Y axis in the curve fitted plot, as shown in Fig. 5, was considered as standard value of lumen intensity to estimate the optimum current for LED luminaries. The maximum normalized value 1 is not taken as standard value. This is because the illumination intensity of WLED is high during the initial few seconds of operation due to lower junction temperature of WLED. Gradually the junction temperature reaches a stabilized value at which the illumination intensity becomes constant; this value is taken as standard value. Depending on the standard value of illumination intensity, the useful life time of each WLED was extrapolated. As every five WLEDs, of a single column, were operated at the same value of DC drive current so by taking the mean of useful life time value of these five WLEDs, the average useful lifetime of WLED operated at a particular value of DC drive current was calculated. Based on these data, the optimum current for long useful life time of WLED luminaries was estimated.
III. RESULT AND DISCUSSION
The residue dopants of WLED junction are activated due to high current stress. This will increase the illumination intensity. Due to the creation of donor defects, the luminous intensity of LED decreases in exponential manner with aging [13]. The DC voltage applied to WLED should be constant otherwise the variation in DC drive current will vary the illumination intensity to a great extent. Hence the result will not be consistent. The lumen depreciation curves of WLEDs with burning time are shown in Fig. 3. A small variation in illumination intensity was noticed during the experiment among similar type of WLEDs those were operated at same value of DC drive current. This is due to the issues related to manufacturing process.
0 200 400 600 800 1000 1200
0 200 400 600 800 1000 1200
Burning time of WLEDs ( in hours)
Il
lu
m
in
a
ti
o
n
I
n
te
n
s
it
y
o
f
W
L
E
D
(
i
n
l
u
x
)
WLEDs operated at 54.5mA of constant DC current
WLED of Row 1 WLED of Row 2 WLED of Row 3 WLED of Row 4 WLED of Row 5
0 200 400 600 800 1000 1200
0 100 200 300 400 500 600 700 800 900 1000
Burning time of WLEDs ( in hours)
Il
lu
m
in
a
ti
o
n
I
n
te
n
s
it
y
o
f
W
L
E
D
(
i
n
l
u
x
)
WLEDs operated at 44.2mA of constant DC current
WLED of Row 1
WLED of Row 2 WLED of Row 3 WLED of Row 4
International Journal of Emerging Technology and Advanced Engineering
Website: www.ijetae.com (ISSN 2250-2459, ISO 9001:2008 Certified Journal, Volume 5, Issue 1, January 2015)
576
0 200 400 600 800 1000 1200
0 100 200 300 400 500 600 700 800 900
Burning time of WLEDs ( in hours)
Il
lu
m
in
a
ti
o
n
I
n
te
n
s
it
y
o
f
W
L
E
D
(
i
n
l
u
x
)
WLEDs operated at 37.5mA of constant DC current
WLED of Row 1 WLED of Row 2 WLED of Row 3 WLED of Row 4 WLED of Row 5
0 200 400 600 800 1000 1200
0 100 200 300 400 500 600 700
Burning time of WLEDs ( in hours)
Il
lu
m
in
a
ti
o
n
I
n
te
n
s
it
y
o
f
W
L
E
D
(
i
n
l
u
x
)
WLEDs operated at 23.1mA of constant DC current
WLED of Row 1 WLED of Row 2 WLED of Row 3 WLED of Row 4 WLED of Row 5
0 200 400 600 800 1000 1200
0 50 100 150 200 250 300 350 400 450 500
Burning time of WLEDs ( in hours)
Il
lu
m
in
a
ti
o
n
I
n
te
n
s
it
y
o
f
W
L
E
D
(
i
n
l
u
x
)
WLEDs operated at 15mA of constant DC current
WLED of Row 1 WLED of Row 2 WLED of Row 3 WLED of Row 4 WLED of Row 5
0 200 400 600 800 1000 1200
0 50 100 150 200 250 300 350 400
Burning time of WLEDs ( in hours)
Il
lu
m
in
a
ti
o
n
I
n
te
n
s
it
y
o
f
W
L
E
D
(
i
n
l
u
x
)
WLEDs operated at 10.5mA of constant DC current
International Journal of Emerging Technology and Advanced Engineering
Website: www.ijetae.com (ISSN 2250-2459, ISO 9001:2008 Certified Journal, Volume 5, Issue 1, January 2015)
577
0 200 400 600 800 1000 1200
0 50 100 150 200 250 300
Burning time of WLEDs ( in hours)
Il
lu
m
in
a
ti
o
n
I
n
te
n
s
it
y
o
f
W
L
E
D
(
i
n
l
u
x
)
WLEDs operated at 7.3mA of constant DC current
WLED of Row 1 WLED of Row 2 WLED of Row 3 WLED of Row 4 WLED of Row 5
0 200 400 600 800 1000 1200
0 50 100 150 200 250
Burning time of WLEDs ( in hours)
Il
lu
m
in
a
ti
o
n
I
n
te
n
s
it
y
o
f
W
L
E
D
(
i
n
l
u
x
)
WLEDs operated at 6.1mA of constant DC current
WLED of Row 1 WLED of Row 2 WLED of Row 3 WLED of Row 4 WLED of Row 5
0 200 400 600 800 1000 1200
0 20 40 60 80 100 120 140
Burning time of WLEDs ( in hours)
Il
lu
m
in
a
ti
o
n
I
n
te
n
s
it
y
o
f
W
L
E
D
(
i
n
l
u
x
)
WLEDs operated at 3.3mA of constant DC current
WLED of Row 1 WLED of Row 2 WLED of Row 3 WLED of Row 4 WLED of Row 5
0 200 400 600 800 1000 1200
0 10 20 30 40 50 60
Burning time of WLEDs ( in hours)
Il
lu
m
in
a
ti
o
n
I
n
te
n
s
it
y
o
f
W
L
E
D
(
i
n
l
u
x
)
WLEDs operated at 1.4mA of constant DC current
[image:6.612.259.559.138.611.2]WLED of Row 1 WLED of Row 2 WLED of Row 3 WLED of Row 4 WLED of Row 5
International Journal of Emerging Technology and Advanced Engineering
Website: www.ijetae.com (ISSN 2250-2459, ISO 9001:2008 Certified Journal, Volume 5, Issue 1, January 2015)
578 As explained in Experimental procedure that to examine the effect of intermittent power supply on WLED based lighting system used in real world application, for initial fifteen hours of operation the DC power supply was switched OFF and ON at random interval of time. It was observed that after each switch ON state of DC power supply the illumination intensity of WLED was higher than the value of illumination intensity recorded just before switched OFF state of DC power supply. Mainly two factors may be responsible for this kind of behavior of WLED.
1. Due to thermal inertia the junction temperature takes finite time to become stabilize.
2. Diminishing of detrimental Electro Static Discharge (ESD) effect during relaxation period (switch OFF period of DC power supply).
It was also observed that sometimes the value of illumination intensity of WLED was higher than its first recorded data (zero burning time of WLED). This behavior will pose risk for eye sensitive applications and also damage the die and reliability of WLED. This behavior was significantly observed for WLEDs those were operated at DC current less than 15 mA. As WLED is very sensitive to static electricity and surge voltage so ESD effect may be responsible for it. While working with ESD sensitive devices, a grounding mat or tool is necessary to protect components from damaging by neutralization of static charges.
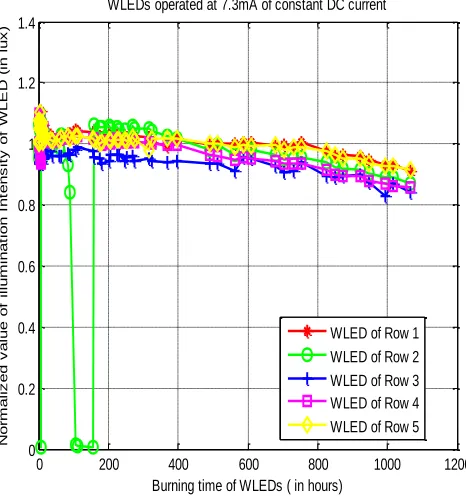
Some WLEDs were catastrophically failed during experimental process. The failed period varies for different WLEDs operated at different DC current. This kind of defect cannot be recognized at first glance, it occurs at any time during burn-in period of WLED. This may be due to ESD effect or imperfection in components material, structure and assembly related stresses. The last seven LEDs of second row turned off after 112 hours of operation. The defect was investigated after switching off the power supply and found that it was due to cracked track of printed circuit board. After repairing, the experiment procedure was continued.
0 200 400 600 800 1000 1200
0 0.1 0.2 0.3 0.4 0.5 0.6 0.7 0.8 0.9 1
Burning time of WLEDs (in hours)
N
o
rm
a
li
z
e
d
v
a
lu
e
o
f
il
lu
m
in
a
ti
o
n
I
n
te
n
s
it
y
o
f
W
L
E
D
(
in
l
u
x
)
WLEDs operated at 54.5mA of constant DC current
WLED of Row 1 WLED of Row 2 WLED of Row 3 WLED of Row 4 WLED of Row 5
0 200 400 600 800 1000 1200
0 0.1 0.2 0.3 0.4 0.5 0.6 0.7 0.8 0.9 1
Burning time of WLEDs ( in hours)
N
o
rm
a
li
z
e
d
v
a
lu
e
o
f
il
lu
m
in
a
ti
o
n
I
n
te
n
s
it
y
o
f
W
L
E
D
(
i
n
l
u
x
)
WLEDs operated at 44.2mA of constant DC current
International Journal of Emerging Technology and Advanced Engineering
Website: www.ijetae.com (ISSN 2250-2459, ISO 9001:2008 Certified Journal, Volume 5, Issue 1, January 2015)
579
0 200 400 600 800 1000 1200
0 0.1 0.2 0.3 0.4 0.5 0.6 0.7 0.8 0.9 1
Burning time of WLEDs (in hours)
N o rm a li z e d v a lu e o f il lu m in a ti o n I n te n s it y o f W L E D ( in l u x )
WLEDs operated at 37.5mA of constant DC current
WLED of Row 1 WLED of Row 2 WLED of Row 3 WLED of Row 4 WLED of Row 5
0 200 400 600 800 1000 1200
0 0.2 0.4 0.6 0.8 1 1.2 1.4
Burning time of WLEDs ( in hours)
N o rm a li z e d v a lu e o f il lu m in a ti o n I n te n s it y o f W L E D ( in l u x )
WLEDs operated at 23.1mA of constant DC current
WLED of Row 1
WLED of Row 2 WLED of Row 3 WLED of Row 4 WLED of Row 5
0 200 400 600 800 1000 1200
0 0.2 0.4 0.6 0.8 1 1.2 1.4
Burning time of WLEDs ( in hours)
N o rm a li z e d v a lu e o f il lu m in a ti o n I n te n s it y o f W L E D ( i n l u x )
WLEDs operated at 15mA of constant DC current
WLED of Row 1 WLED of Row 2 WLED of Row 3 WLED of Row 4 WLED of Row 5
0 200 400 600 800 1000 1200
0 0.2 0.4 0.6 0.8 1 1.2 1.4
Burning time of WLEDs ( in hours)
N o rm a li z e d v a lu e o f il lu m in a ti o n I n te n s it y o f W L E D ( i n l u x )
WLEDs operated at 10.5mA of constant DC current
International Journal of Emerging Technology and Advanced Engineering
Website: www.ijetae.com (ISSN 2250-2459, ISO 9001:2008 Certified Journal, Volume 5, Issue 1, January 2015)
580
0 200 400 600 800 1000 1200
0 0.2 0.4 0.6 0.8 1 1.2 1.4
Burning time of WLEDs ( in hours)
N o rm a li z e d v a lu e o f il lu m in a ti o n I n te n s it y o f W L E D ( in l u x )
WLEDs operated at 7.3mA of constant DC current
WLED of Row 1 WLED of Row 2 WLED of Row 3 WLED of Row 4 WLED of Row 5
0 200 400 600 800 1000 1200
0 0.2 0.4 0.6 0.8 1 1.2 1.4
Burning time of WLEDs ( in hours)
N o rm a li z e d v a lu e o f il lu m in a ti o n I n te n s it y o f W L E D ( i n l u x )
WLEDs operated at 6.1mA of constant DC current
WLED of Row 1 WLED of Row 2 WLED of Row 3 WLED of Row 4 WLED of Row 5
0 200 400 600 800 1000 1200
0 0.2 0.4 0.6 0.8 1 1.2 1.4
Burning time of WLEDs ( in hours)
N o rm a li z e d v a lu e o f il lu m in a ti o n I n te n s it y o f W L E D ( in l u x )
WLEDs operated at 3.3mA of constant DC current
WLED of Row 1 WLED of Row 2 WLED of Row 3 WLED of Row 4 WLED of Row 5
0 200 400 600 800 1000 1200
0 0.2 0.4 0.6 0.8 1 1.2 1.4
Burning time of WLEDs ( in hours)
N o rm a li z e d v a lu e o f il lu m in a ti o n I n te n s it y o f W L E D ( in l u x )
WLEDs operated at 1.4mA of constant DC current
[image:9.612.64.297.144.393.2]WLED of Row 1 WLED of Row 2 WLED of Row 3 WLED of Row 4 WLED of Row 5
International Journal of Emerging Technology and Advanced Engineering
Website: www.ijetae.com (ISSN 2250-2459, ISO 9001:2008 Certified Journal, Volume 5, Issue 1, January 2015)
International Journal of Emerging Technology and Advanced Engineering
Website: www.ijetae.com (ISSN 2250-2459, ISO 9001:2008 Certified Journal, Volume 5, Issue 1, January 2015)
[image:11.612.47.308.135.361.2]582
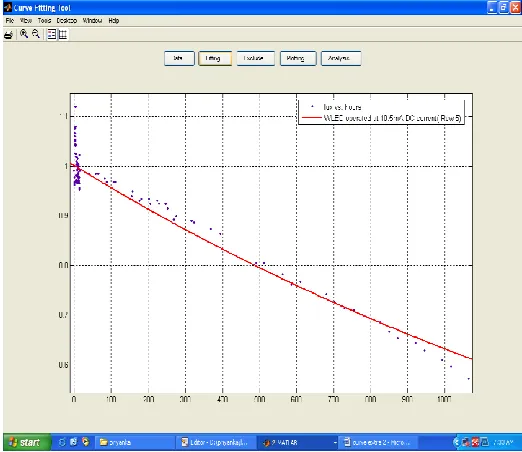
Figure 5: Least Square Curve Fitting of WLED operating at 10.5 mA
The linear least square curve fitting is applied on normalized plot of all WLEDs individually as shown in Fig. 5. The average useful life time of WLED operated at particular value of DC drive current is obtained by taking the average of useful .life time of all five WLEDs operated at same DC drive current.
The recommended light output required in WLED based illuminating applications is 70 percent lumen maintenance as the color stability and uniformity in intensity are the requirements for general lighting application. In this study, 70 percent of the standard value is used. As stated above that some errors were occurred during the experimental process, the data points corresponding to those errors will not satisfy least square curve fitting and deviate our estimation of optimum current for long life time of WLED so those data points were excluded. Finally the data points are extrapolated to estimate the useful operational life of WLED.
0 200 400 600 800 1000 1200 1400
0.55 0.6 0.65 0.7 0.75 0.8 0.85 0.9 0.95 1
N
o
rm
a
li
z
e
d
v
a
lu
e
o
f
il
lu
m
in
a
ti
o
n
i
n
te
n
s
it
y
o
f
W
L
E
D
(
in
l
u
x
)
Analysis of fit "WLED operated at 10.5mA DC current(Row 1)" for dataset "lux vs. hours"
Burning time of WLED (in hours)
WLED operated at 10.5mA DC current(Row 1) 95% prediction bounds
lux vs. hours
0 200 400 600 800 1000 1200
0 0.2 0.4 0.6 0.8 1 1.2 1.4
N
o
rm
a
li
z
e
d
v
a
lu
e
o
f
il
lu
m
in
a
ti
o
n
i
n
te
n
s
it
y
o
f
W
L
E
D
(
in
l
u
x
)
Analysis of fit "WLED operated at 10.5mA DC current (Row 2)" for dataset "lux vs. hours"
Burning time of WLED (in hours)
WLED operated at 10.5mA DC current (Row 2) 95% prediction bounds
[image:11.612.332.564.143.386.2]International Journal of Emerging Technology and Advanced Engineering
Website: www.ijetae.com (ISSN 2250-2459, ISO 9001:2008 Certified Journal, Volume 5, Issue 1, January 2015)
583
0 200 400 600 800 1000 1200
-0.2 0 0.2 0.4 0.6 0.8 1 1.2
N
o
rm
a
li
z
e
d
v
a
lu
e
o
f
il
lu
m
in
a
ti
o
n
i
n
te
n
s
it
y
o
f
W
L
E
D
(
in
l
u
x
)
Analysis of fit "WLED operated at 10.5mA DC current (Row 3)" for dataset "lux vs. hours"
Burning time of WLED (in hours)
WLED operated at 10.5mA DC current (Row 3) 95% prediction bounds
lux vs. hours
0 200 400 600 800 1000 1200
0.4 0.5 0.6 0.7 0.8 0.9 1
N
o
rm
a
li
z
e
d
v
a
lu
e
o
f
il
lu
m
in
a
ti
o
n
i
n
te
n
s
it
y
o
f
W
L
E
D
(
in
l
u
x
)
Analysis of fit "WLED operated at 10.5mA DC current (Row 4)" for dataset "lux vs. hours"
Burning time of WLED (in hours)
WLED operated at 10.5mA DC current (Row 4) 95% prediction bounds
lux vs. hours
0 200 400 600 800 1000 1200
0.5 0.6 0.7 0.8 0.9 1 1.1 1.2
N
o
rm
a
li
z
e
d
v
a
lu
e
o
f
il
lu
m
in
a
ti
o
n
i
n
te
n
s
it
y
o
f
W
L
E
D
(
in
l
u
x
)
Analysis of fit "WLED operated at 10.5mA DC current( Row 5)" for dataset "lux vs. hours"
Burning time of WLED (in hours)
WLED operated at 10.5mA DC current( Row 5) 95% prediction bounds
[image:12.612.335.568.142.383.2]lux vs. hours
Figure 6: Analysis of WLED Life Time by Extrapolation of Fitted Curve
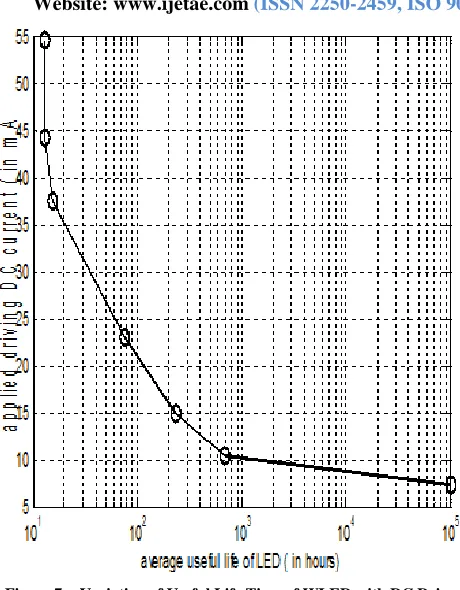
The variation of average useful life period of WLED with applied DC current is shown in Table I. Its graphical representation is shown in Fig. 7. It is observed that the operational life of WLED increases exponentially with decrease in DC drive current. This graph indicates that WLED operated at 7mA of DC drive current, have useful life period of more than 10 years. The values of drive current less than 7 mA also show long useful life so it is not necessary to show them. These values are not well predictable due to higher experimental errors. It is due to limited resolution of luminance meter and other equipments used in the experiment.
TABLEI
CALCULATED VALUE OF LIFE TIME OF WLEDWITH DCDRIVE
CURRENT
Average useful life of WLED( in hours)
DC drive current( in mA)
13 54.5
13 44.2
15.6 37.5
76 23.1
234 15
691.8 10.5
[image:12.612.61.303.144.383.2]International Journal of Emerging Technology and Advanced Engineering
Website: www.ijetae.com (ISSN 2250-2459, ISO 9001:2008 Certified Journal, Volume 5, Issue 1, January 2015)
[image:13.612.53.283.123.418.2]584
Figure 7: Variation of Useful Life Time of WLED with DC Drive Current
The 20 mA DC current is the recommended value by manufacturers to drive WLED efficiently with claimed life of 50,000 to 100,000 hours of operation. It is verified by the experimental result that this value of DC current should be 7 mA which is nearly one third of the recommended value 20mA.It is observed that WLED operated at 7mA of DC current will glow for more than 10 years (100,000 hours) of continuous run so its useful life may lead to 20 to 30 years by considering 8 to 12 hours per day operation.
In another qualitative analysis, 45 WLEDs were kept in continuous ON state for 14 years. All these WLEDs were supplied from same manufacturer in single batch. It was observed that illumination intensity of only two WLEDs became dim with aging but rest of them have not shown any appreciable difference in their illumination intensity.
IV. CONCLUSION
It has been analyzed in this study that WLEDs which are operated at 7mA of DC current have practical operational life of more than 10 years. They provide sufficient light output needed in general illumination with added advantage of less harmful for eye safety sensitive application. This value of current is much smaller than the value recommended by manufacturers which is 20mA.
The WLED luminary based lighting system will be operated at this optimum current then overall system reliability will improve and useful life of more than 10 years may be obtained.
Acknowledgement:
One of the authors (P.J) is grateful to University Grant Commission (UGC)-New Delhi for providing Research Scholarship for present research work at University of Allahabad-India. P.J would like to thank Electronic Controls, Allahabad for making the Printed Circuit Board and Shakshi Srivastava, (University of Illinois, Urbana Champaign) for her contribution during the experimental process.
REFERENCES
[1] Murthy,T.W, Maximum Spectral Luminous Efficacy of White Light, J.Appl.Phy., 2012.
[2] Zehnder U, Weimer A, Strauss U, Fehrer M, Hahn B, Lugauer H. J and Harle V, ―Industrial production of GaN and InGaN-light emitting diodes on SiC-substrates‖, J. Cryst. Growth , 2001, P. 497-502.
[3] G Meneghesso, M Maneghini and E Zanoni, ―Recent results on the degradation of White LEDs for lighting‖, J. Appl. Phys. (2010) [4] Gu. Y, N. Narendran, and J.P. Freyssinier.‖White LED Performance.
Fourth International Conference on silid state lighting‖, Proceedings of SPIE, 2004.
[5] Nadarajah.N, Nishantha .M, Andrew. B, Richard.P and Martin. O,‖ Characterizing White LEDs for general illumination applications‖, Lighting Research Center, Ransselaer Polytechnic Institutre, Troy, NY , SPIE‘s photonics west conference, January23-28, 2000, P. 3938-39.
[6] D.L. barton, M.Osinski, P.Perlin, C.J. Helms, and N.H. Berg,‖ Life tests and failure mechanisms of GaN/AlGaN/InGaN light emitting diode‖, Proc. SPIE,1998, vol. 3279, P. 17-27.
[7] F. Manyakhin, A.Kovalev, and A.E Yunovich,‖ Aging mechanisms of InGaN/AlGaN/GaN light emitting diodes operating at high currents‖ MRS Internet J. Nitride Semicond. Res.1998, vol. 3, P. 53. [8] www.ledmagazine.com ,‖ India identifies LED lighting as key
technology to control energy demand‖, October 2011, P. 23-25. [9] F.Behar-Cohen,C.Martinsons, F.Vienot, G.Zissis, A.Barlier-Salsi,
J.P Cesarini, O.Enouf, M.Garcia, S.Picaud, D.Attia; ―Light-emitting diodes (LED) for domestic lighting: Any risks for the eye‖;Progress in Retinal and Eye Research, 2011,P. 239-257; www.elsevier.com/locate/prer.
[10] www.ledmagazine.com,‖ The elusive ‗life‘ of LEDs: How TM-21 contributes to the solution,November/December‖, 2011,P. 37-39. [11] www.ledmagazine.com, TM-21 seeks methods for
lumen-maintenance prediction, February 2011, P. 37-39.
[12] Jiajie. F, Kam C.Y, and Michael. P; ―Lifetime estimation of High power White LED using Degradation-Data-Driven Method‖, IEEE transactions on device and materials reliability,2012, vol. 12, No. 2. [13] Jianzheng .H, Lianqiao .Y, Lan. K and Moo W.S, ― The aging