Genetic diversity of common toads (Bufo
bufo) along the Norwegian coast : disjunct
distribution of locally dominant
haplotypes
Tuncay, SS, Roth, S, Bardakci, F and Jehle, R
Title
Genetic diversity of common toads (Bufo bufo) along the Norwegian coast
: disjunct distribution of locally dominant haplotypes
Authors
Tuncay, SS, Roth, S, Bardakci, F and Jehle, R
Type
Article
URL
This version is available at: http://usir.salford.ac.uk/47478/
Published Date
2018
USIR is a digital collection of the research output of the University of Salford. Where copyright
permits, full text material held in the repository is made freely available online and can be read,
downloaded and copied for noncommercial private study or research purposes. Please check the
manuscript for any further copyright restrictions.
Genetic diversity of common toads (Bufo bufo) along the
Norwegian coast: disjunct distribution of locally dominant
haplotypes
Serap Şenol Tuncay
1, Steffen Roth
2, Fevzi Bardakci
1, Robert Jehle
3,41Department of Biology, Adnan Menderes University, Aydin 09100, Turkey
2The Natural History Collections, University Museum of Bergen, Bergen N-5020, Norway
3School of Environment and Life Sciences, University of Salford, Manchester M5 4WT, United Kingdom
Herpetological Journal
FULL PAPERPublished by the British Herpetological Society
Little is known about the phylogeographic history of amphibian populations along the western Fennoscandinavian coast. In the present study, we focus on the common toad (Bufo bufo) and document the spatial distribution of mitochondrial DNA (cytb) haplotypes at 20 localities along its coastal Norwegian range. Two common haplotypes (out of eight haplotypes in total) were represented by 142 out of the 154 (92%) investigated individuals. However, they were shared at only three localities and clustered at two separate geographic regions each. The most common haplotype (55% of individuals) has previously been found to be abundant across central and eastern Europe, whereas the second most common haplotype (37% of individuals) has so far only been recorded in Sweden. The disjunct distribution of genetic lineages is in line with an assumption that the Norwegian coastline was postglacially colonised both from the south as well as across mountain passes from the east. Our data support previous studies on the phylogeography of Fennoscandinavia that revealed that post-glacial recolonisation patterns led to a pronounced spatial structure of local populations.
Key words: phylogeography, Fennoscandinavia, cytb, mitochondrial DNA, Bufonidae
INTRODUCTION
T
he historical biogeography of Europe is markedly shaped by glacial cycles. While initial seminal studies identified the Mediterranean peninsulas as the most important refugia during cold periods (Hewitt, 1996; 2000), subsequent research revealed a more complex picture with further important refugial areas in central and eastern Europe (e.g. Stewart & Lister, 2001; Babik et al., 2004; Schönswetter et al., 2005). Fennoscandinavia in northern Europe is generally characterised by a post-glacial recolonisation of lineages that arrive either via existing land connections from the east or via the Baltic Sea, leading to secondary contact zones between two distinct sets of populations for some species (e.g. Taberlet et al., 1995; Kontula & Väinölä, 2001). In addition, specific islands along the Norwegian coastline may represent isolated northern refugia for plants and mammals (Fedorov & Stenseth, 2001; Printzen et al., 2003; Brunhoff et al., 2006).Due to their low vagility and water dependency, amphibians are particularly spatially structured and are therefore excellent models for phylogeographic and conservation genetic investigations (Beebee, 2005; Zeisset & Beebee, 2008; McCartney-Melstad & Shaffer, 2015). The most comprehensive studies on the phylogeography of Fennoscandinavian amphibians were conducted on brown frogs (Rana temporaria and
R. arvalis), which confirmed a post-glacial recolonisation
both via the Baltic Sea as well as from the east (Palo et al., 2004; Knopp & Merilä, 2009; Cortázar-Chinarro et al., 2017). Other anurans such as the pool frog (Pelophylax
lessonae) only reside in southern Fennoscandinavian
areas, where they represent distinctly northern clades (e.g. Zeisset & Hoogesteeger, 2018).
The common toad Bufo bufo (Linnaeus 1758, Anura, Bufonidae) is widely distributed from Western Europe to Asia and is among the European amphibians with the northernmost occurrences (Sillero et al., 2014). However, while its species delimitation and phylogeography has recently attracted significant attention at the continental scale (e.g. García-Porta et al., 2012; Recuero et al., 2012; Arntzen et al., 2017), the specific biogeographic history of
B. bufo in Fennoscandinavia has received little attention
so far. In Norway, B. bufo generally occurs in the south of the country as well as along the western coastline, where it reaches 68.01° in latitude; it is currently absent in inland areas of higher altitudes (Pedersen & Dolmen, 1994; Artsdatabanken, 2015; Roth et al., 2016; Syvertsen, 2016). The aim of the present study is to determine the spatial genetic structure of B. bufo populations along the Norwegian coast using mtDNA cytochrome b (cytb) haplotypes and to integrate the revealed patterns of variation into previously published haplotype distributions across the species’ range. In particular, we investigate whether the Norwegian coast is inhabited by
S. Tuncay et al.
a single or several genetic lineages attributable to post-glacial recolonisation routes (the latter was observed for other anurans at a wider Fennoscandinavian scale: Palo et al., 2004; Knopp & Merilä, 2009; Cortázar-Chinarro et al., 2017). We also investigate whether a post-glacial recolonisation from southern refugia is reflected in a south-north decline in genetic variation, which is expected to arise through serial genetic bottlenecks during range expansion (Hewitt, 1996).
MaTeRIal aND MeThODs
Field work was conducted in spring 2007 and 2008, broadly across the entire distribution of B. bufo along the Norwegian coast (Fig. 1). In total, 154 samples across 20 localities spanning over 1000 km of latitude were included. Eleven localities were situated on the mainland and nine localities were situated on offshore islands; for two localities (Sandness, SAH, and Hitra, HI), 2 or 3 populations at a geographic distance not exceeding individual migration capabilities (about 2 km) were pooled (Table 1, Fig. 1). DNA was collected from toe clips (opportunistically from fresh roadkills and deceased individuals) and skin swabs from adults using cotton buds, supplemented with a maximum of two sacrificed
tadpoles for each locality. Sample size per locality ranged between 1 and 21; to maximise geographic coverage under logistic constraints, numbers were generally lower when localities were at closer geographic proximity (such as around the city of Bergen, see the insert in Figure 1). Samples were stored in 96% ethanol immediately in the field.
[image:3.595.57.528.43.433.2]Total genomic DNA was extracted using the Purelink DNA isolation kit according to the manufacturer’s protocol (Invitrogen Corporation, Carlsbad, CA). A 722bp long fragment of the mtDNA cytb region (excluding primers) was amplified using PCR primers described in Recuero et al. (2012) (F: ATCTACCTTCACATCGGACGAG, R: AGTTTRTTTTCTGTGAGTCC). PCR was performed in 25 µl reaction volumes containing 50 ng DNA, 1x Taq DNA polymerase buffer, 2 mM MgCl2 (25 mM; Fermentas, MBI), 0.2 mM dNTPs (0.05 mM each; Fermentas, MBI), 0.5 U Taq DNA polymerase (Fermentas, MBI) and 0.1 μM of each primer. The amplification conditions were 2 min at 96°C, followed by 37 cycles of 30 s at 94°C, 45 s annealing at 53°C, and 1 min 30 s at 72°C, followed by a final 5 min at 72°C. PCR products were purified using the Purelink PCR purification kit (Invitrogen Corporation, Carlsbad, CA) following the manufacturer’s protocol and visualised by electrophoresis in 1.5 % agarose gels
stained with Safe ViewTM Nucleic Acid Stains (abm) and photographed with a Vilber Loumart gel documentation and visualisation system. Sequencing was carried out single-stranded by Macrogen Corporation (Netherlands) using the Big Dye Terminator Cycle Sequencing Kit (Applied Biosystems) and an ABI 3730XL capillary sequencer.
Together with the 154 new sequences generated in this study, we also considered further cytb sequences previously deposited in the GenBank database (Genbank UID: 353256652, Recuero et al., 2012, n = 325). Sequences were aligned using Clustal W (Thompson et al., 1994) in BioEdit ver 7.1.3.0 (Hall, 1999). Haplotype numbers (h), haplotype diversities (Hd), and nucleotide diversities (π, Nei, 1987) were estimated using DNAsp ver. 5.10 (Rozas et al., 2003). To investigate genetic structuring in Norway, we performed an Analysis of Molecular Variance (AMOVA, Excoffier et al., 1992) based on alternative grouping of populations using Arlequin 3.5 (Excoffier & Lischer, 2010). Significance was determined based on 10000 permutations and we show the five population groupings explaining the highest amount of variation. To quantify genetic differences between populations, pairwise genetic distances values between Norwegian populations (FST) were calculated also in Arlequin, using sequential Bonferroni corrections for adjustment of statistical levels of multiple tests (Holm, 1979). Principal component analysis (PCA) performed using GenAlex ver 6.501 (Peakall & Smouse, 2012) for the eight populations
with n > 8 (DØ, EGE, HI, KRF, MAS, ØY, SAH, and VOU) revealed whether principle components characterising genetic properties of populations are reflected in their spatial settings. To illustrate the population share across haplotypes, and to distinguish between ancestral and derived haplotypes, Network 4.6.1.3 (Fluxus Technology Ltd.-http://www.fluxus-engineering.com/sharenet.htm) was used to compile a median-joining (MJ) network. The best substitution model selected by the Akaike information criterion (AIC) was TrN+G implemented in MODELTEST 3.7 (Posada & Crandall, 1998). Whether genetic variation of B. bufo populations in Norway is subject to non-random processes such as selection or demographic population contraction or expansion was determined using Tajima’s selective neutrality as well as Fu and Li’s neutrality test using DNAsp (Tajima, 1989; Fu & Li, 1993).
ResUlTs
All newly produced sequences have been deposited in Genbank (accession numbers KX230483- KX230490 for Haplotypes 1-8). Among these sequences, we found 715 monomorphic and seven segregating sites across the 154 B. bufo individuals, with four singleton variable sites and three parsimony informative sites defining eight haplotypes. The majority of individuals were represented by two haplotypes (Haplotype 1: 55% of individuals, Haplotype 2: 37% of individuals), which were
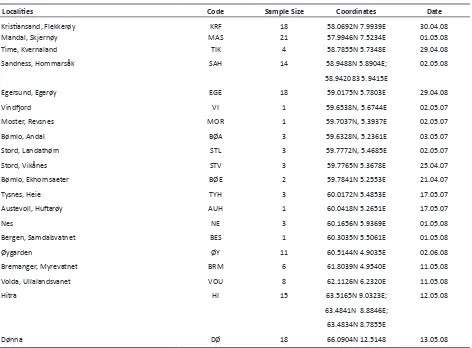
Localities Code Sample Size Coordinates Date
Kristiansand, Flekkerøy KRF 18 58.0692N 7.9939E 30.04.08
Mandal, Skjernøy MAS 21 57.9946N 7.5234E 01.05.08
Time, Kvernaland TIK 4 58.7855N 5.7348E 29.04.08
Sandness, Hommarsåk SAH 14 58.9488N 5.8904E; 02.05.08
58.942083 5.9415E
Egersund, Egerøy EGE 18 59.0175N 5.7803E 29.04.08
Vindfjord VI 1 59.6538N, 5.6744E 02.05.07
Moster, Revsnes MOR 1 59.7037N, 5.3937E 02.05.07
Bømlo, Andal BØA 3 59.6328N, 5.2361E 03.05.07
Stord, Landathørn STL 3 59.7772N, 5.4685E 02.05.07
Stord, Vikånes STV 3 59.7765N 5.3678E 25.04.07
Bømlo, Ekhornsaeter BØE 2 59.7841N 5.2553E 21.04.07
Tysnes, Heie TYH 3 60.0172N 5.4853E 17.05.07
Austevoll, Huftarøy AUH 1 60.0418N 5.2651E 17.05.07
Nes NE 3 60.1656N 5.9369E 01.05.08
Bergen, Samdalsvatnet BES 1 60.3035N 5.5061E 01.05.08
Øygarden ØY 11 60.5144N 4.9035E 02.06.08
Bremanger, Myrevatnet BRM 6 61.8039N 4.9540E 11.05.08
Volda, Ullalandsvanet VOU 8 62.1126N 6.2320E 11.05.08
Hitra HI 15 63.5165N 9.0323E; 12.05.08
63.4841N 8.8846E; 63.4834N 8.7855E
[image:4.595.67.539.75.423.2]Dønna DØ 18 66.0904N 12.5148 13.05.08
shared in only three localities (KRF, TIK, ØY; Fig. 1, Table 2). Remarkably, both haplotypes were clustered at two separate regions across our study area. Haplotype 1 was dominant in two populations south of Stavanger (SAH and EGE) as well as in the northernmost populations (AUH, BES, ØI, BRM, VOU, HI, and DØ), whereas Haplotype 2 predominated in the southernmost localities (KRF and MAS) as well as around the city of Bergen (VI, MOR, BØA, STL, BØE, TYH). Four further haplotypes were represented by a single individual across three localities, in addition to two site-specific haplotypes represented by two and six individuals each, respectively (Table 2). Corresponding to haplotype numbers and distributions, overall measures of haplotype and nucleotide diversities in Norway were estimated as 0.560 and 0.001, respectively. Tajima’s D was not significantly
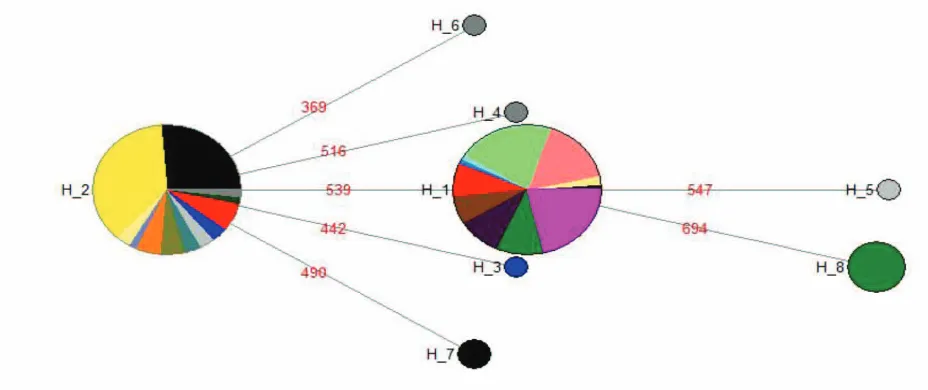
negative (D = -1.08, p > 0.05), suggesting a lack of selection on the cytb locus across all Norwegian populations. Fu and Li’s test was however significantly negative (D = -2.54, p < 0.05; F = -2.42, p < 0.05), suggesting either positive selection or population expansion of Norwegian populations. Genetic differentiation among localities was overall high (FST: 0.71, p<0.001, see Supplementary Materials, Table 1 for pairwise comparisons between populations). The disjunct distribution of major haplotypes resulted in main principle components which do not represent geographic settings (Fig. 2). The first axis explained > 99% of the observed variation and distinguished all populations fixed for Haplotype 1 (SAH, EGE, VOU and DØ) from populations dominated by or fixed for Haplotype 2 (KRF, MAS, ØY and HI). The five most likely groupings revealed by the AMOVA explained at least 59.91% of the observed variation (Table 3). The highest support was found for a grouping that identified six population clusters, three of which corresponded to the distribution of the two common haplotypes as outlined above; the remaining three clusters encompassed the populations around Bergen which are represented by low sample sizes. Other groupings comprised at least five clusters, and all groupings contained two identical clusters comprised of the five southernmost localities (Table 3). The haplotype network presents Haplotype 2, which comprises the two southernmost populations as well as the populations around Bergen, as ancestral (Fig. 3).
Integrating our findings into existing knowledge of mtDNA cytb haplotype distribution across the range of
B. bufo (Recuero et al., 2012) revealed that the common
Haplotype 1 is widespread in eastern Europe, whereas our second-most common Haplotype 2 as well as S. Tuncay et al.
KRF Mas TIK sah eGe VI MOR BØa sTl sTV BØe TYh aUh Ne Bes ØY BRM VOU hI DØ H*
H_1 1 2 14 18 1 1 7 6 8 9 18 AGGATAT H_2 15 21 2 1 1 3 3 1 2 2 2 4 AGGACAT
H_3 1 AAGACAT
H_4 1 AGGGCAT
H_5 1 AGGATGT
H_6 1 GGGACAT
H_7 2 AGAACAT
H_8 6 AGGATAC
[image:5.595.63.532.78.212.2]h 3 1 2 1 1 1 1 1 1 3 1 2 1 2 1 2 1 1 2 1
Table 2. Haplotype distributions across B. bufo sampling localities in Norway. h: number of haplotypes; *Seven polymorphic sites (invariable sites excluded)
Group Va FsC FsT FCT
[image:5.595.33.533.286.368.2]1. KRF, MAS●TIK, SAH, EGE●VI, MOR, BØA●STL, STV, BØE●TYH, AUH, NE, BES ● ØY, BRM, VOU, HI, DØ 60.32 0.33** 0.73** 0.60** 2. KRF, MAS●TIK, SAH, EGE●VI, MOR, BØA, STL, STV, BØE●TYH, AUH, NE, BES, ØY ● BRM, VOU, HI, DØ 60.17 0.31** 0.73** 0.60** 3. KRF, MAS●TIK, SAH, EGE●VI, MOR, BØA, STL, STV, BØE●TYH, AUH●NE, BES, ØY ● BRM, VOU●HI●DØ 60.09 0.28** 0.71* 0.60* 4. KRF, MAS●TIK, SAH, EGE●VI, MOR, BØA●STL, STV, BØE●TYH, AUH ● NE, BES ● ØY, BRM, VOU, HI, DØ 60.03 0.33** 0.73** 0.60** 5. KRF, MAS●TIK, SAH, EGE●VI, MOR, BØA●STL, STV, BØE●TYH, AUH, NE, BES, ØY ● BRM, VOU, HI, DØ 59.91 0.38** 0.73** 0.60** Table 3. Analysis of Molecular Variance (AMOVA) of B. bufo samples distributed in Norway. *: p < 0.05; **: p < 0.001. Groupings are shown in descending amount of overall variation explained, and different groups are separated with the symbol ●. Va: Percentage variation, FSC: differences between localities within groups, FST: genetic differences within localities, FCT: genetic differences between groups.
[image:5.595.58.286.377.504.2]Haplotype 8 (represented by six individuals at a second northernmost locality) have previously been found only in Sweden (Supplementary Materials, Table 2). Our five rare haplotypes (Haplotypes 3-7, represented by one or two individuals each) have not previously been found elsewhere in the species’ range.
DIsCUssION
Our findings from coastal Norwegian mtDNA haplotypes in B. bufo are generally in line with previous studies on Fennoscandinavian amphibians, which revealed pronounced spatial genetic structuring linked to a post-glacial recolonisation which took place from different directions (Palo et al., 2004; Knopp & Merilä, 2009; Cortázar-Chinarro et al., 2017). The significant diversity of haplotypes harboured by the study area also conforms to a previous spatially more-restricted study, which revealed high levels of genetic variation at the level of nuclear microsatellite markers (Roth & Jehle, 2016). Our study is, however, hampered by low sample sizes for some of the localities, which, jointly with their rather uneven spatial distribution, precludes a fine-scale capture of genetic variation at local levels. Four of the eight encountered haplotypes are represented by a single individual and have not been previously found elsewhere in Europe. As we were unable to repeat amplification and sequencing of these samples we cannot entirely rule out the possibility that these four haplotypes may be the result of PCR or sequencing errors, but consider it unlikely. Although introductions of B. bufo to offshore islands are occasionally reported (Dolmen & Seland, 2016), we assume that our populations are generally of natural origin (see also Roth & Jehle, 2016).
In contrast to previous work that covered larger areas in Sweden and Finland (e.g. Knopp & Merilä, 2009;
see also e.g. Taberlet et al., 1995 for an early study on mammals), we did not reveal a single zone dividing northern populations from their southern counterparts. It is noteworthy that Haplotype 1, represented by more than half of our study individuals and common in central and eastern Europe, has not previously been found among eight B. bufo individuals from Sweden (Recuero et al., 2012). This suggests that this haplotype represents a genetic lineage that might have colonised the Norwegian coast from the Baltic Sea, an area that is also at closer geographic proximity to our study area than eastern land bridges into Fennoscandinavia. Haplotypes 2 and 8, together comprising 41% of our study individuals, have previously been found in adjacent Sweden but so far remained unreported elsewhere across the B. bufo range (Recuero et al., 2012). We were however unable to draw any conclusive inferences about their origins compared to the other haplotypes observed, as Haplotype 2 was characterised as ancestral whereas Haplotype 8 was characterised as distal in the MJ network. Denser sampling and a consideration of additional mitochondrial and nuclear loci is desirable to reveal whether Fennoscandinavia is inhabited by unique genetic lineages of B. bufo.
[image:6.595.71.535.100.295.2]Amphibian species residing in Norway are generally distributed across southern parts of the country as well as along the coast (e.g. Dolmen, 1982; Sillero et al., 2014). The significant signature of population expansion based on Fu and Li’s neutrality test is generally in line with the hypothesis that B. bufo recolonised our study area after cold periods. Our study did however not reveal a gradual reduction of genetic variation towards northern regions in line with the assumption that recolonisation took place only uni-directionally from south to north. That the post-glacial recolonisation did not take place exclusively northward is also supported by the disjunct alternating
distribution of the two dominant haplotypes, which, due to their fixed nature in the majority of localities where they occur, is unlikely caused by for example incomplete lineage sorting. Mutations arising during expansions would also lead to range-edge haplotypes being distally positioned in a haplotype network. This is the case for Haplotype 8, which is only found towards the northern edge of the B. bufo range (HI).
Based on distribution data of urodeles, Dolmen (1982) already suggested that amphibians might have reached the central Norwegian coast also from Jämtland in Sweden through mountain passes during temporarily more favourable climatic conditions during the Atlantic (5500-300 B.C.) and/or sub-boreal (3000 – 500 B.C.) age (see also Gislen & Kauri, 1959, as well as, for example, O’Brien et al. (2015) for another range expansion by a Northern European amphibian at similar spatial and temporal scales). Indeed, the distribution of Haplotypes 2 and 8 would be in line with the hypothesis that genetic lineages documented for Sweden reached central Norway around Bergen, as well as Hitra more than 500 km further north, across the currently unoccupied terrain of the Scandinavian mountain range. Wider sampling across Norway and Sweden is required to for example reveal why Haplotype 2 is also dominant at the two southernmost localities.
aCKNOwleDGeMeNTs
The study was carried out in conformity with the Norwegian legislation (forsøksdyrforskriften). We are grateful to Donal Smith for his help with compiling Figure 1.
ReFeReNCes
Arntzen, J.W., de Vries, W., Canestrelli, D. & Solano, I. (2017). Hybrid zone formation and contrasting
outcomes of secondary contact over transects in common toads. Molecular Ecology 26, 5663-5675. Artsdatabanken (2015). Nordpadde Bufo bufo. Species map service 1.6. http://artskart.artsdatabanken.no/
FaneArtSok.aspx.
Babik W., Branicki W., Sandera, M., Litvinchuk, S., Borkin L. J., Irwin, J. T. & Rafinski, J. (2004). Mitochondrial phylogeography of the moor frog, Rana arvalis.
Molecular Ecology 13, 1469–1480.
Beebee, T.J.C. (2005). Conservation genetics of amphibians. Heredity 95, 423–427.
Brunhoff, C., Yoccoz, N. G., Ims, R. A. & Jaarola, M. (2006). Glacial survival or late glacial colonization? Phylogeography of the root vole (Microtus oeconomus) in north-west Norway. Journal of Biogeography 33, 2136-2144.
Cortázar-Chinarro, M., Lattenkamp, E. Z., Meyer-Lucht, Y., Luquet, E., Laurila, A. & Höglund, J. (2017). Drift,
selection, or migration? Processes affecting genetic differentiation and variation along a latitudinal gradient in an amphibian. BMC Evolutionary Biology 17, 189. Dolmen, D. (1982). Zoogeography of Triturus vulgaris and T. cristatus (Laurenti) (Amphibia) in Norway, with notes
on their vulnerability. Fauna Norvegica Ser. A 3, 12-25. Dolmen, D. & Seland, J. (2016). How fast do amphibians
disperse? Introductions, distribution and dispersal of the common frog Rana temporaria and the common toad Bufo bufo on a coastal island in Central Norway.
Fauna Norvegica 36, 33-46.
Excoffier, L., Smouse, P. E. & Quattro, J.M. (1992). Analysis of molecular variance inferred from metric distances among DNA haplotypes: Application to human mitochondrial DNA restriction data. Genetics 131, 479–491.
Excoffier, L., & Lischer, H. E. L. (2010). Arlequin suite ver 3.5: A new series of programs to perform population genetics analyses under Linux and Windows. Molecular
Ecology Resources 10, 564–567.
Fedorov, V.B. & Stenseth, N.C. (2001). Glacial survival of the Norwegian lemming (Lemmus lemmus) in Scandinavia: inference from mitochondrial DNA variation. Proceedings of the Royal Society of London
B 268, 809–814.
Fu, Y.-X. & Li, W.-H. (1993). Statistical tests of neutrality of mutations. Genetics 133, 693–709.
García-Porta, J., Litvinchuk, S.N., Crochet, P.A., Romano, A., Geniez, P.H., Lo-Valvo., M., Lymberakis, P. & Carranza, S. (2012). Molecular phylogenetics and historical biogeography of the westpalearctic common toads (Bufo bufo species complex). Molecular Phylogenetics
and Evolution 63, 113-130.
Gislen, T. & Kauri, H. (1959). Zoogeography of the Swedish amphibians and reptiles with notes on their growth
and ecology. Acta Vertebratica 1, 193-397.
Hewitt, G. M. (1996). Some genetic consequences of ice ages, and their role in divergence and speciation.
Biological Journal of the Linnean Society 58, 247–276.
Hewitt, G. M. (2000) The genetic legacy of the Quaternary ice ages. Nature 405, 907–913.
Holm, S. (1979). A simple sequentially rejective multiple test procedure. Scandinavian Journal of Statistics 6,
65–70.
Hall, T. A. (1999). Bioedit: a user friendly biological sequence aligment editor and analysis program for Windows 95/98/NT. Nucleic Acids Symposium Series 41, 95–98. Knopp, T. & Merilä, J. (2009). The postglacial recolonization of northern Europe by Rana arvalis as revealed by microsatellite and mitochondrial DNA analyses.
Heredity 102, 174-181.
Kontula T. & Väinölä R. (2001). Postglacial colonization of northern Europe by distinct phylogeographic lineages of the bullhead, Cottos gobio. Molecular Ecology 10, 1983–2002.
McCartney-Melstad E., Shaffer H. B. (2015). Amphibian molecular ecology and how it has informed
conservation. Molecular Ecology 24, 5084–5109. Nei, M. (1987). Molecular evolutionary genetics. New York, NY: Columbia University Press.
O’Brien, C. D., Hall, J. E., Orchard, D., Barratt, C., Arntzen, J. W. & Jehle, R. (2015). Extending the natural range of a declining species: Genetic evidence for native great crested newt (Triturus cristatus) populations in the Scottish Highlands. European Journal of Wildlife
Research 61, 27-33.
Palo, J. U., Schmeller, D., Laurila, A., Primmer, C. R., Kuzmin, S. I. & Merilä, J. (2004). High degree of population
Ecology 13, 2631–2644.
Peakall, R. & Smouse, P. E. (2012). GenAlEx 6.5: genetic analysis in Excel. Population genetic software for teaching and research-an update. Bioinformatics 28, 2537–2539.
Pedersen, J. & Dolmen, D. (1994). Dønna - ny nordgrense for padde i Norge. Fauna 47, 177.
Posada, D. & Crandall, K. A. (1998). Modeltest: testing the model of DNA substitution. Bionformatics 14, 817–
818.
Printzen, C., Ekman, S. & Tønsberg, T. (2003). geography of Cavernularia hultenii: evidence of slow
genetic drift in a widely disjunct lichen. Molecular
Ecology 12, 1473–1486.
Recuero, E., Canestrelli D., Voros J., Szabo K., Poyarkov N. A., Arntzen J. W., Crnobrnja Isailovic J., Kidov A. A., Cogalniceanu D., Caputo F. P., Nascetti G. & Martínez-Solano I. (2012). Multilocus species tree analyses resolve the radiation of the widespread Bufo
bufo species group (Anura, Bufonidae). Molecular Phylogenetics and Evolution 62, 71–86.
Roth, S. & Jehle, R. (2016). High genetic diversity of common toad (Bufo bufo) populations under strong natural fragmentation on a northern archipelago.
Ecology and Evolution 6, 1626–1636.
Roth, S., Dolmen, D., Nes, K., Olsen, O., Wangen, G. & Scheidt, U. (2016). Large populations of the common toad Bufo bufo in Norway. Herpetology Notes 9, 325-330.
Rozas, J., Sanchez-Del Barrio, J.C., Messeguer, X. & Rozas, R. (2003). DnaSP: DNA polymorphism analyses by the coalescent and other methods. Bioinformatics 19, 2496–2497.
Schönswetter, P., Stehlik, I., Holderegger, R. & Tribsch, A. (2005). Molecular evidence for glacial refugia of mountain plants in the European Alps. Molecular
Ecology 14, 3547–3555.
Sillero, N., Campos, J., Bonardi, A., Corti, C., Creemers, R., Crochet, P.-A., Crnobrnja-Isailović, J., Denoël, M.,
Ficetola, G. F., Gonçalves, J., Kuzmin, S., Lymberakis, P., de Pous, P., Rodríguez, A., Sindaco, R., Speybroeck, J., Toxopeus, B., Vieites, D. R. & Vences M. (2014). Updated distribution and biogeography of amphibians and reptiles of Europe. Amphibia-Reptilia 35, 1-31. Stewart, J. R. & Lister, A. M. (2001). Cryptic northern refugia and the origins of the modern biota. Trends in Ecology
and Evolution 16, 608–613.
Syvertsen, P.O. (2016). The common toad Bufo bufo in Nordland County, northern Norway. Fauna 69,
108-112.
Taberlet, P., Swenson, J. E., Sandegren, F. & Bjärvall, A. (1995). Localization of a contact zone between two highly divergent mitochondrial DNA lineages of the brown bear (Ursus arctos) in Scandinavia. Conservation
Biology 9, 1255–1261.
Tajima, F. (1989). Statistical method for testing the neutral mutation hypothesis by DNA polymorphism. Genetics
123, 585–595.
Thompson, J.D., Higgins, D.G. & Gibson T.J. (1994). CLUSTAL W: improving the sensitivity of progressive multiple sequence alignment through sequence weighting, position-specific gap penalties and weight matrix choice. Nucleic Acids Research 22, 4673–4680. Zeisset, I. & Beebee, T. J. C. (2008). Amphibian geography: a model for understanding historical
aspects of species distributions. Heredity 101, 109– 119.
Zeisset, I. & Hoogesteger, T. (2018). A reassessment of the biogeographic range of northern clade pool frogs (Pelophylax lessonae). Herpetological Journal 28, 63-72.