R E S E A R C H
Open Access
A comprehensive evaluation of assembly
scaffolding tools
Martin Hunt
1*, Chris Newbold
2,1, Matthew Berriman
1and Thomas D Otto
1Abstract
Background:Genome assembly is typically a two-stage process: contig assembly followed by the use of paired sequencing reads to join contigs into scaffolds. Scaffolds are usually the focus of reported assembly statistics; longer scaffolds greatly facilitate the use of genome sequences in downstream analyses, and it is appealing to present larger numbers as metrics of assembly performance. However, scaffolds are highly prone to errors, especially when generated using short reads, which can directly result in inflated assembly statistics.
Results:Here we provide the first independent evaluation of scaffolding tools for second-generation sequencing data. We find large variations in the quality of results depending on the tool and dataset used. Even extremely simple test cases of perfect input, constructed to elucidate the behaviour of each algorithm, produced some surprising results. We further dissect the performance of the scaffolders using real and simulated sequencing data derived from the genomes ofStaphylococcus aureus,Rhodobacter sphaeroides,Plasmodium falciparumandHomo sapiens. The results from simulated data are of high quality, with several of the tools producing perfect output. However, at least 10% of joins remains unidentified when using real data.
Conclusions:The scaffolders vary in their usability, speed and number of correct and missed joins made between contigs. Results from real data highlight opportunities for further improvements of the tools. Overall, SGA, SOPRA and SSPACE generally outperform the other tools on our datasets. However, the quality of the results is highly dependent on the read mapper and genome complexity.
Background
Obtaining a genome sequence is a vital component for detailed molecular analysis of an organism and for sev-eral thousands of species, genome projects are now
un-derway or complete [1]. Through the process ofde novo
assembly, a genome is pieced together computationally, from overlapping randomly sequenced reads. Depending on several factors, including the depth of sequence coverage, sequencing methodology and complexity of the genome, the sequence can be assembled into a vari-able, but large number of contigs. The more fragmented the assembly is, the harder the downstream analysis be-comes. Analysing gene order and synteny, carrying out comparative or functional genomics or investigating pat-terns of recombination all rely heavily on obtaining an assembly with good continuity.
Contig sizes are determined by the under-representation of sequences, due to coverage variation or sequencing bias, read lengths, sequencing technology and the exist-ence of repeats in the genome. However, assembly con-tinuity can be vastly improved by linking contigs together into scaffolds. This study compares the accuracy of methods that use paired sequences obtained from each end of DNA templates to bridge over regions of the gen-ome that are difficult to sequence or assemble. Depending on the design of sequencing libraries, paired reads can bridge over gaps in sequence ranging from hundreds to tens of thousands of base pairs, to order and orientate contigs as well as to estimate the length of gaps. However, a combinatorial problem arises from repeat sequences. Re-peats are often collapsed or mis-assembled during the as-sembly process, so that a scaffolder must resolve the numerous links arising from each repetitive contig. Unfor-tunately, scaffolding does not scale linearly and is compu-tationally intractable [2].
* Correspondence:mh12@sanger.ac.uk
1
Parasite Genomics, Wellcome Trust Sanger Institute, Wellcome Trust Genome Campus, Cambridge CB10 1SA, UK
Full list of author information is available at the end of the article
The scaffolding problem can be formalised using graph theory, with contigs corresponding to nodes of the graph, and linking read pairs corresponding to edges. The avail-able scaffolding tools take different approaches to produce approximate solutions. In addition to ordering and orien-tation, the expected distance between linking reads, known from the library construction, can be used to esti-mate the distance between contigs so that sequence gaps in the output scaffolds will be approximately of correct length. When used, this distance information is usually encoded into the scaffolding graph by assigning lengths to the edges. The ideal output from a scaffolder is one scaf-fold per chromosome of the genome, with gaps of the cor-rect lengths separating each contig.
The increased availability of next generation sequen-cing (NGS) technology has driven intensive development of algorithms that assemble efficiently and, with varying success, scaffold millions of short sequencing reads into
genome sequences. Recent studies that benchmarked de
novo assemblers and analysed assembly quality, GAGE
[3], Assemblathon [4] and Assemblathon2 [5], all re-ported large variations between assemblers, datasets and assembler parameters. Although most assemblers include a built in scaffolding algorithm, it is standard practice to perform an independent run of scaffolding immediately
after de novo assembly to further improve continuity.
Bambus [6], the first stand-alone scaffolding tool, was published in 2004 and consequently was not developed with large NGS datasets in mind. In this study we evalu-ated the contemporary scaffolders Bambus2 [7], GRASS [8], MIP [9], Opera [10], SCARPA [11], SOPRA [12] and SSPACE [13] and the scaffolding modules from the assem-blers ABySS [14], SGA [15] and SOAPdenovo2 [16] (see Table 1). We have made all our scripts freely available so that the results can be reproduced and any new scaffold-ing tools can easily be analysed usscaffold-ing our methods.
The first stage of any scaffolding algorithm is to decide where each read should be placed, if at all, in the input contigs. All the algorithms we tested use an existing read mapping tool to place reads in the assembly. Significant effort has been invested in tools that can efficiently map NGS sequencing reads to a genome sequence and there are many mappers now available [17]. Some scaffolders perform this read mapping for the user, by bundling one or both of the popular mappers BWA [18] or Bowtie [19] with the software, or in the case of SOAPdenovo2,
use SOAP2′s own mapper. Other scaffolders require the
user to run the mapping and provide a SAM or BAM [20] file of reads mapped to contigs, so that the user is free to choose any read mapper that outputs a compat-ible format.
Once the positions of reads in contigs have been deter-mined, scaffolding can be undertaken. Bambus uses a greedy algorithm, joining together contigs with the most
links first and ignoring subsequent edges that conflict with an existing join. SSPACE takes a similar approach, but starts building the first scaffold from the longest contig and continues to make joins as long as the majority of read pairs support the join. The other scaffolders do not use greedy algorithms but instead construct a graph and use a variety of methods to manipulate the graph and simplify the problem by partitioning the graph and solving each subgraph, or by changing the constraints on the graph.
Bambus2 first identifies repetitive contigs and removes them from the scaffolding graph, but retains contigs arising from variants, then orders and orients the contigs into scaffolds and finishes with a variant detection stage. SOPRA iteratively removes inconsistent linking informa-tion (edges of the graph) and contigs (nodes of the graph) that give rise to spurious links, using statistical optimisations to make the method practical. These steps are repeated until there are no more contigs to be re-moved and the graphs nodes and edges are all consist-ent. Opera solves the problem exactly, at the expense of dropping constraints on contig distances. Conversely, ABySS limits its search for inter-contig links using an upper limit on the allowed distance between any two contigs. SCARPA determines the orientation and then ordering of contigs in two separate stages, using restric-tions that make the computation tractable and unlike the other scaffolders, includes a verification step that breaks contigs that appear to be mis-assembled. SGA uses a very conservative approach by essentially disal-lowing any conflicts in the graph, thereby avoiding heu-ristics at the expense of missing valid joins. MIP partitions the graph into subgraphs of restricted size and transforms each of these into a Mixed Integer Program-ming problem. Each subproblem is solved exactly be-cause its size is limited and the constraint of contig orientation is not imposed. GRASS also uses Mixed In-teger Programming but, like SOPRA, works iteratively to produce a final set of scaffolds.
Results
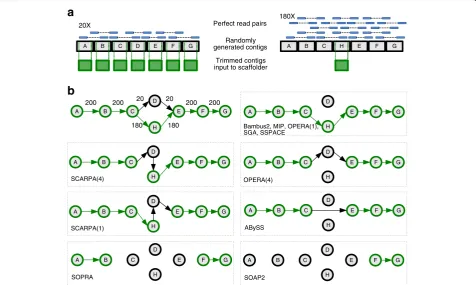
We assessed the scaffolding tools using a variety of input data and found large variations in the results, depending on the scaffolder and mapping tool used, the genome being analysed and insert size of the library. In order to under-stand more about the behaviour of each scaffolder, we first constructed 11 simple test cases (Figure 1, Additional file 1: Figures S1-S3). We then went on to use larger datasets from four different genomes of varying size and GC content (Tables 2 and 3). These comprised Illumina reads from theStaphylococcus aureus,Rhodobacter sphaeroides,
the human chromosome 14 GAGE datasets and the
Plas-modium falciparum clone 3D7 reference genome [21].
Table 1 Scaffolding tools
Scaffolder Version Publication datea Citationsb Method Install Run Read mapper Comments
ABySS 1.3.6 27/02/2009 764c Graph + o User’s choice
Bambus2 3.1.0d 16/09/2011 37 Graph - - User’s choice Hard to install and run. Scripting work needed to prepare input for running scaffolding
GRASS 0.003 06/04/2012 1 Graph - - BWA/NovoAlign Hard to install and did not produce scaffolds
MIP 0.5 13/10/2011 16 Graph o - User’s choice A few dependencies required, significant work needed to prepare input files
Opera 1.2 19/09/2011 30 Graph + o Bowtie/BWA
SCARPA 0.22 29/12/2012 3 Graph + o User’s choice
SGA 0.9.43 07/12/2011 74c Graph - o User’s choice Several dependencies to install
SOAPdenovo2 r223 27/12/2012 47c Graph o - SOAP2 Little documentation on how to run scaffolder module alone
SOPRA 1.4.6 24/06/2010 41 Graph + - User’s choice Scripting work needed to prepare input for running scaffolding
SSPACE 2 (basic) 07/12/2010 151 Greedy + + Bowtie/BWAe Extremely easy to install and run a
Date the article was first available online. b
Retrieved from Google scholar 11 December 2013. c
Citations will include general assembly, not just scaffolding. d
Bambus2 is part of the AMOS package. AMOS version 3.1.0 was used, but with latest goBambus2 script from the AMOS git repository. e
BWA only available with a paid version of the software.
A B C
D
E F G
H 180 180
20 20 200
200 200 200
A B C
D
E F G
H
Bambus2, MIP, OPERA(1), SGA, SSPACE
A B C
D
E F G
H
OPERA(4)
A B C
D
E F G
H
SCARPA(1)
A B C
D
E F G
H
SCARPA(4)
A B C
D
E F G
H
SOAP2
A B C
D
E F G
H
SOPRA
Randomly generated contigs
Trimmed contigs input to scaffolder
a
Perfect read pairs 180X
A B C H E F G
20X
A B C D E F G
b
A B C
D
E F G
H
ABySS
[image:3.595.60.537.399.684.2]Table 2 Summary of datasets
Dataset Size
(Mb) % GC
Potential joins
Number of reads (millions)
Read length
Insert
sizea Percent reads mapped(fwd/rev) Maximumread coverage Bowtie -v 0 Bowtie -v 3 Bowtie2 BWA
S. aureusperfect 2.8 32 27 0.76 76 505 96 96 95 95 97 97 97 97 40
27 0.76 76 2,795 96 96 95 95 97 97 97 97 40
940 0.76 76 505 95 94 94 94 96 96 96 96 40
940 0.76 76 2,995 95 94 94 94 97 96 96 96 40
S. aureusGAGE 2.9 32 167 3.5 37 3,385 35 35 56 54 55 54 53 52 49
R. sphaeroidesGAGE 4.6 68 570 2.1 101 3,695 17 11 36 32 69 68 35 30 62
P. falciparum3D7 de novo 23.3 19 9,302 52.5 76 645 70 67 73 70 79 77 76 74 267
9,302 12.0 75 2,705 27 25 31 30 43 42 33 32 33
Human chromosome 14 GAGEb 88.2 40 19,935 22.7 101 2,865 46 19 68 29 90 55 69 30 38
19,935 2.4 57-82 34,500 47 6 73 48 93 85 79 56 3
a
Calculated from Bowtie2 mapping to contigs. b
Excluding the 19 Mb of Ns at the start of the sequence.
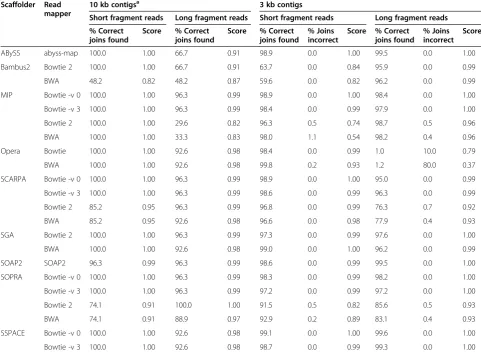
Table 3 Results summary of simulated data
Scaffolder Read mapper
10 kb contigsa 3 kb contigs
Short fragment reads Long fragment reads Short fragment reads Long fragment reads
% Correct joins found
Score % Correct joins found
Score % Correct joins found
% Joins incorrect
Score % Correct joins found
% Joins incorrect
Score
ABySS abyss-map 100.0 1.00 66.7 0.91 98.9 0.0 1.00 99.5 0.0 1.00
Bambus2 Bowtie 2 100.0 1.00 66.7 0.91 63.7 0.0 0.84 95.9 0.0 0.99
BWA 48.2 0.82 48.2 0.87 59.6 0.0 0.82 96.2 0.0 0.99
MIP Bowtie -v 0 100.0 1.00 96.3 0.99 98.9 0.0 1.00 98.4 0.0 1.00
Bowtie -v 3 100.0 1.00 96.3 0.99 98.4 0.0 0.99 97.9 0.0 1.00
Bowtie 2 100.0 1.00 29.6 0.82 96.3 0.5 0.74 98.7 0.5 0.96
BWA 100.0 1.00 33.3 0.83 98.0 1.1 0.54 98.2 0.4 0.96
Opera Bowtie 100.0 1.00 92.6 0.98 98.4 0.0 0.99 1.0 10.0 0.79
BWA 100.0 1.00 92.6 0.98 99.8 0.2 0.93 1.2 80.0 0.37
SCARPA Bowtie -v 0 100.0 1.00 96.3 0.99 98.9 0.0 1.00 95.0 0.0 0.99
Bowtie -v 3 100.0 1.00 96.3 0.99 98.6 0.0 0.99 96.3 0.0 0.99
Bowtie 2 85.2 0.95 96.3 0.99 96.8 0.0 0.99 76.3 0.7 0.92
BWA 85.2 0.95 92.6 0.98 96.6 0.0 0.98 77.9 0.4 0.93
SGA Bowtie 2 100.0 1.00 96.3 0.99 97.3 0.0 0.99 97.6 0.0 1.00
BWA 100.0 1.00 92.6 0.98 99.0 0.0 1.00 96.2 0.0 0.99
SOAP2 SOAP2 96.3 0.99 96.3 0.99 98.6 0.0 0.99 99.5 0.0 1.00
SOPRA Bowtie -v 0 100.0 1.00 96.3 0.99 98.3 0.0 0.99 98.2 0.0 1.00
Bowtie -v 3 100.0 1.00 96.3 0.99 97.2 0.0 0.99 97.2 0.0 1.00
Bowtie 2 74.1 0.91 100.0 1.00 91.5 0.5 0.82 85.6 0.5 0.93
BWA 74.1 0.91 88.9 0.97 92.9 0.2 0.89 83.1 0.4 0.93
SSPACE Bowtie -v 0 100.0 1.00 92.6 0.98 99.1 0.0 1.00 99.6 0.0 1.00
Bowtie -v 3 100.0 1.00 92.6 0.98 98.7 0.0 0.99 99.3 0.0 1.00
a
[image:4.595.56.538.370.724.2]datasets because they were relatively more fragmented, maximising the possibility for the scaffolders to make joins.
We included P. falciparum because it has an extremely
low GC content of 19% and often poses quite a challenge to assembly algorithms despite its relatively small size of 23 MB. In addition to real data, four perfect datasets were generated from theS. aureusreference genome.
GRASS did not join any contigs together in any of
the test cases or using the S. aureus genome. It either
crashed or wrote ‘scaffolds’ that simply consisted of
the input contig sequences. Therefore it was not ana-lysed any further.
Read mapping
As described earlier, some of the scaffolders run the read mapping for the user using either BWA or Bowtie (ex-cept for SOAPdenovo2). Every scaffolder was run using its default settings. However Opera and SSPACE run Bowtie using slightly different settings with one more permissive than the other (see Materials and methods for details). To be consistent, for each scaffolder wher-ever possible both settings of Bowtie were used in addition to one run each with BWA and Bowtie2 [22], so that up to four runs of each scaffolder were carried out. Reads were mapped for ABySS using its own map-per (abyss-map) with the default settings.
The way in which the read mappers were run meant that BWA maps a read if there were up to two mis-matches in its first 32 bases and if it could map to more than one position, one of those positions was chosen at random. Bowtie2 also places repetitive reads ran-domly but only reports reads mapped with a minimum alignment score that depends on the length of the read. Bowtie mapped any read that matched to only one position, and either had no mismatches (when using the option -v 0) or up to three mismatches (when using -v 3). Table 2 and Additional file 2: Table S1 show the difference in numbers of reads mapped for each dataset and read mapper. For example, on human chromosome 14 Bowtie -v 0 mapped just 6% of the re-verse read of each pair, whereas Bowtie2 mapped 85% of those reads. However, because more relaxed map-ping parameters produce more erroneously mapped reads, the number of mapped reads does not correlate with scaffolding accuracy.
All the scaffolders except SGA and SOAPdenovo2 need the forward and reverse paired reads to be inde-pendently mapped to contigs and only after mapping is the fact that each read has a mate used as linking infor-mation. SGA is an exception because it requires the user to map the reads as true paired reads. However, Bowtie does not report reads within a pair that map to different contigs and so yields no scaffolding information. For this reason, only Bowtie2 and BWA were used to map reads
when running SGA. Although Bambus2 can take linking data from any source, it was non-trivial to convert the linking information from mapped reads into the re-quired format. For this reason only Bowtie2 and BWA were used with Bambus2, since a BAM file could be converted using a script from the ABySS package.
Evaluation metrics
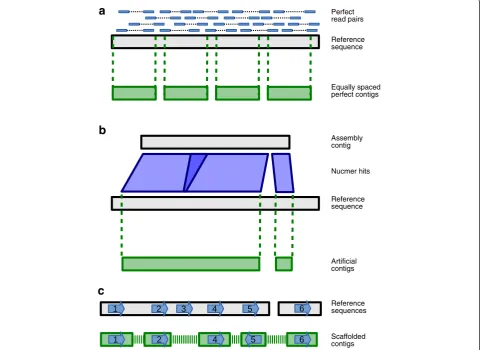
To test the accuracy of each scaffolding algorithm in de-tail, we generated test contigs that contained no errors and could be tracked using unique sequence tags (see Materials and methods, Figure 2 and Additional file 1: Figure S5), but still resembled real contigs that would be produced by an assembler. Since the tags were unique within the dataset they allowed the order, orientation and distance of the contigs to be determined within the scaffolds output by each tool.
The quality of each scaffolder was assessed using the following five key metrics (see Figure 2 and Materials and methods for a complete explanation).
Correct joins - a pair of contigs correctly joined with
the tags in the expected orientation and separated by the correct distance.
Incorrect joins - where contigs from different
loca-tions, in the wrong orientation or separated by the incorrect distance were joined together.
Skipped tags - two contigs were correctly joined, but
separated by a gap that should contain another contig.
Lost tags - a tag that was completely absent from
the output of the scaffolder.
Running time - the total CPU time used, including
any pre-processing stages and read mapping.
Within each dataset, a score between 0 and 1 was cal-culated for each metric by scaling the scores so that the best tool scored 1 and the worst scored zero. For ex-ample, taking correct joins, the tool that produced the most correct joins scored 1, the tool that made the few-est correct joins scored 0 and the scores of the other tools were scaled between those values. Within each dataset, a single summary score, between 0 and 1, was calculated for each tool by summing weighted scores and dividing by the total of the weights. For example, weighting all five metrics equally with a weight of 1 would mean summing the scores and then dividing by 5. Note that an overall score of 1 for a particular tool and dataset does not mean that it produced the ideal answer, but that it was not outperformed by another tool.
summary scores for each tool on each dataset was obtained by weighting the metrics with a range of values intended to emphasise accuracy (see Materials and methods for de-tails). In addition to considering combinations of weights, we singled out the weighting of 80, 160, 160, 40 and 1 for correct joins, incorrect joins, lost tags, skipped tags and running time, which represents our opinion of the relative importance of the metrics and heavily penalises errors.
Small test cases
The 11 test cases consisted of simple input and used simulated perfect Illumina read pairs together with contigs of random sequence and neutral GC content. This revealed the different approaches that were taken by each scaffolder depending on the available choices (Figure 1, Additional file 1: Figures S1-S3). Each test was repeated five times, with an independently generated set of input data, to account for any randomness within the methods of the tools. We expected that all of the
scaffolders would solve these tests in a sensible way by using the majority of read pair evidence whenever pos-sible and would not make any obvious errors. Figure 1, which is test 11 in Additional file 1, exemplifies these tests, where most of the joins between contigs are unam-biguous but a scaffolder must choose between two op-tions for other joins.
The simplest part of test 11 was to join contigs A-B-C and E-F-G, where there was high supporting read coverage and no ambiguities (see also tests 1 and 2 in Additional file 1). All scaffolders except SOPRA and SOAPdenovo2 successfully made these joins. The remaining differences in behaviour demonstrated how the tools dealt with the choice between C-D-E or C-H-E, with the latter option having nine times more read pair evidence. First, we note that SCARPA gener-ated errors by joining either C-D-H-E or C-H-D-E and this behaviour was consistent throughout all similar
tests (Supplementary tests 6–10). Opera chose either
Reference sequences
Scaffolded contigs Perfect read pairs
Reference sequence
Equally spaced perfect contigs
Assembly contig
Reference sequence
Arti cial contigs Nucmer hits
a
b
[image:6.595.58.539.92.442.2]c
C-D-E or C-H-E, demonstrating that it did not make use of the read coverage to resolve conflicts but instead chose seemingly at random.
In every test, Bambus2, MIP, SGA and SSPACE all elected to follow the path of most evidence, when present, but differed when there was equal support for two choices. In test 9, which only differs from test 11 by having equal read pair evidence for C-D-E and C-H-E (see Additional file 1: Figure S3), SSPACE stopped folding at the ambiguity by not placing D or H in a scaf-fold. MIP chose the same path in all five iterations, suggesting that it uses some heuristic to make its choice. SGA appeared to choose its path randomly, outputting either C-D-E or C-H-E in the five iterations. ABySS skipped D and H, choosing C-E instead, suggesting that ABySS knew the scaffolding path, but decided to skip the nodes because of the heterozygosity.
SOPRA and SSPACE behaved predictably on all the test cases, with both tools consistently making no joins whenever there were two options with equal evidence. Bambus2 behaved similarly to SSPACE, with two excep-tions (tests 2 and 6). However, SOPRA made fewer joins than SSPACE and the most likely explanation for this is that its algorithm involves removing nodes (contigs) from the graph as well as edges (read pair links). This means that a contig that could be joined to more than two other contigs (for example contig C in Figure 1a) would be removed from the graph and so not placed in a scaffold.
Simulated datasets
Two sets of simulated contigs and reads were generated
from the S. aureus reference genome that was used in
the GAGE study (Figure 2a), excluding its two plasmid sequences. Perfect contigs of lengths 3 kb and 10 kb, separated by gaps of 50 bp and 300 bp, respectively, were made. Perfect Illumina read pairs were sampled from the reference sequence with uniform coverage and mean insert size of 500 bp and 3 kb. The combinations of perfect reads and contigs gave four datasets for testing the scaffolders.
Overall, the tools performed well on the simulated data-sets, with many tools reconstructing the entire sequence correctly (Table 3, Additional file 2: Table S3, Additional file 1: Figures S6-S9). However, each dataset had at least one combination of tool, mapper and mapping parameters that performed badly. The simplest test was that which used 10 kb contigs with simulated libraries that contained 500 bp inserts. Every tool produced the correct answer with at least one read mapper, making every available join between contigs with no errors. The most notable results on this dataset were those of Bambus2 and SOPRA, both of which showed large variations depending on the read mapper. SOPRA produced a perfect result if Bowtie was
used to map the reads, but missed 26% of the potential joins if Bowtie2 or BWA was used instead. As can be seen in Table 2, Bowtie2 and BWA mapped more reads than Bowtie demonstrating that more mapped reads does not necessarily lead to better scaffolds. Using the same contigs but simulated libraries with a 3 kb insert size resulted in slightly worse output, with most tools making 25 or 26 of the possible 27 joins. This time SOPRA with Bowtie2 was the only scaffolding run that produced a completely perfect result.
Using the 3 kb contigs there were 940 potential contig joins that could be made, and this posed more of a chal-lenge to the scaffolders, particularly using the 3 kb insert reads (Table 3). Excluding Bambus2 and Opera, on aver-age, 97% of the possible joins were correctly made by each tool when using the 500 bp insert data. When the 3 kb insert reads were used instead, this number dropped to 94%. In contrast, Bambus2 found 62% of joins using the short insert data, but this number in-creased to 96% on the long insert reads. Opera only identified 1% of the joins from the long insert reads.
The effect of read mapping tools and parameters is already visible in the simulated data. For example, the percent of perfect joins found by SCARPA on the 3 kb contigs with 3 kb insert reads ranged from 76% to 96%, depending on the read mapping parameters (Table 3).
SOPRA’s values ranged from 91% to 98% when using the
500 bp insert reads. Moreover, for both tools the run that found the most correct joins was also the most ac-curate, making no incorrect joins.
Genome scale data
The results of scaffolding realistic data are presented below, broken down by dataset. In each case, real sequencing read pairs were used to scaffold artificial contigs generated from real genome assemblies, con-structed as follows (see Materials and methods and Figure 2b for complete details). Each real contig from a genome assembly was aligned to the reference genome and the sequence of each match in the reference was used as an artificial contig. Any artificial contigs with sequence overlap that were generated from the same assembly contig were merged. It was necessary to use artificial contigs in order to track their placement in the output from each scaffolder.
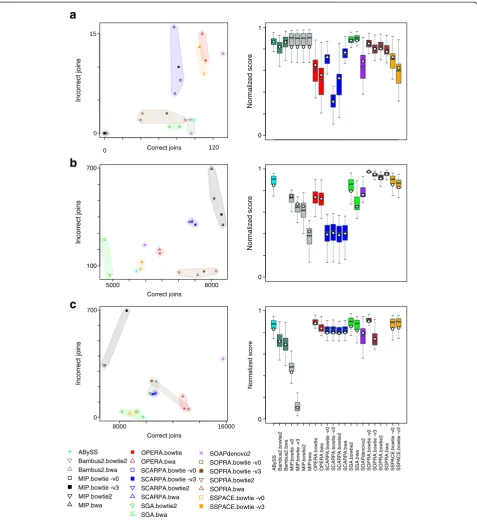
Summary data and plots of theP. falciparum,S. aureus and human datasets are given in Figure 3 and Table 4 (see Additional file 2: Table S3 and Additional file 1: Figures S10-S17 for complete data and plots).
S. aureus
The ‘shortjump’ reads, with a fragment size of approxi-mately 3.4 kb, were used to scaffold artificial contigs
aureusdataset. There were 167 potential joins from the input contigs and the proportion of those that were found correctly ranged from almost no joins up to 78%, with an average of 51%. This average value excludes MIP
because on this dataset it failed to join almost any con-tigs, regardless of the mapper used. This flattered its ap-parent quality when considering different combinations of scoring weights (Figure 3a) because no joins meant
[image:8.595.60.538.88.612.2]100 700
a
b
c
Correct joins Correct joins Correct joins Incorrect joins Incorrect joins Incorrect joins ABySS Bambus2.bowtie2 Bambus2.bwa MIP.bowtie -v0 MIP.bowtie -v3 MIP.bowtie2 MIP.bwa OPERA.bowtie OPERA.bwa SCARPA.bowtie -v0 SCARPA.bowtie -v3 SCARPA.bowtie2 SCARPA.bwa SGA.bowtie2 SGA.bwa SOAPdenovo2 SOPRA.bowtie -v0 SOPRA.bowtie -v3 SOPRA.bowtie2 SOPRA.bwa SSPACE.bowtie -v0 SSPACE.bowtie -v3 A B y S S B a mb u s 2 .bo w ti e2 Ba m b u s 2 .b w a MI P .bow ti e -v 0 MI P .bow ti e -v 3 M IP .b o w ti e 2 MI P .b w a O P ER A .bow ti e O P E RA. b w a SC A R P A .b ow ti e -v0 S CA RP A .b ow ti e -v 3 SC AR P A .b o w ti e2 SC AR P A .b wa S G A. b ow ti e2 SG A .b w a SOA P de no vo 2 S O PR A .b ow tie -v 0 SO P R A .b ow ti e -v 3 SO P R A. b o w ti e 2 SOP R A. bw a S S P A C E .b ow ti e -v 0 S SP A C E .b o w ti e -v3 Normalized score Normalized score Normalized score 0 0 0 1 1 1that it made no errors. Excluding MIP, the most conser-vative tools were SGA and Bambus2 (Figure 3a). SGA found 43% to 50% of the joins depending on the mapper, with an error rate of 1%. Bambus2 had one run where it found 57% of the potential joins with no false positives. At the other extreme, SOAPdenovo2 correctly identified 78% of the joins at the cost of an 8% error rate (Figure 3a), which was the average across all tools (ex-cluding MIP). Every scaffolder skipped over some possible joins, with Opera having the most skipped tags (20).
Overall, using our specific scoring that penalises errors (Box plot Figure 3a and Additional file 2: Table S3), SGA, ABySS and Bambus2 generated the best results. However, the boxplots also show that, depending on the scoring system, the results do change considerably.
The dependence on the mapping is immediately evi-dent from Figure 3a. The error rates of SCARPA, SSPACE and Opera were affected by the mapping, but they showed relatively little variation in the number of correct joins. On the other hand, the number of correct joins made by SOPRA showed more variation than the error rate. On this dataset Bowtie with no
mismatches (−v 0) performed better than with three
mismatches (−v 3) on the tools where this could be
changed (MIP, SCARPA, SOPRA and SSPACE).
R. sphaeroides
The complete results for this dataset are given in the Additional file 1: Figure S11 and (Additional file 2: Tables S2 and S3). However we remark here that
simi-larly to S. aureus, SGA was the most conservative,
SOAPdenovo2 was the most aggressive, with a better than average error rate, and there was a heavy depend-ence on the mapping parameters. This is the only data-set on which SCARPA performed particularly well when compared with the other scaffolders.
P. falciparum
Contigs were made for input to the scaffolders using de
novo assembly contigs from one set of short fragment
[image:9.595.55.542.98.445.2](645 bp) Illumina read pairs. The short fragment read pairs and a second set of Illumina reads with a fragment size of 2.7 kb were used for scaffolding. This meant that we could test the scaffolders in three different ways, by
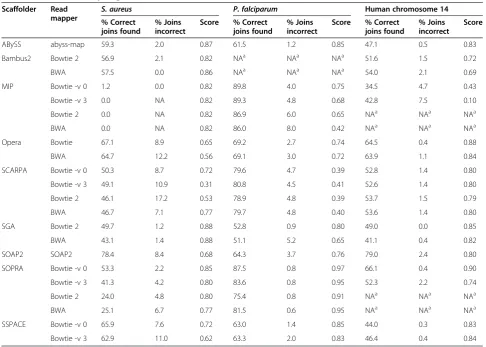
Table 4 Results summary of genome scale data
Scaffolder Read
mapper S. aureus P. falciparum
Human chromosome 14
% Correct joins found
% Joins incorrect
Score % Correct joins found
% Joins incorrect
Score % Correct joins found
% Joins incorrect
Score
ABySS abyss-map 59.3 2.0 0.87 61.5 1.2 0.85 47.1 0.5 0.83
Bambus2 Bowtie 2 56.9 2.1 0.82 NAa NAa NAa 51.6 1.5 0.72
BWA 57.5 0.0 0.86 NAa NAa NAa 54.0 2.1 0.69
MIP Bowtie -v 0 1.2 0.0 0.82 89.8 4.0 0.75 34.5 4.7 0.43
Bowtie -v 3 0.0 NA 0.82 89.3 4.8 0.68 42.8 7.5 0.10
Bowtie 2 0.0 NA 0.82 86.9 6.0 0.65 NAa NAa NAa
BWA 0.0 NA 0.82 86.0 8.0 0.42 NAa NAa NAa
Opera Bowtie 67.1 8.9 0.65 69.2 2.7 0.74 64.5 0.4 0.88
BWA 64.7 12.2 0.56 69.1 3.0 0.72 63.9 1.1 0.84
SCARPA Bowtie -v 0 50.3 8.7 0.72 79.6 4.7 0.39 52.8 1.4 0.80
Bowtie -v 3 49.1 10.9 0.31 80.8 4.5 0.41 52.6 1.4 0.80
Bowtie 2 46.1 17.2 0.53 78.9 4.8 0.39 53.7 1.5 0.79
BWA 46.7 7.1 0.77 79.7 4.8 0.40 53.6 1.4 0.80
SGA Bowtie 2 49.7 1.2 0.88 52.8 0.9 0.80 49.0 0.0 0.85
BWA 43.1 1.4 0.88 51.1 5.2 0.65 41.1 0.4 0.82
SOAP2 SOAP2 78.4 8.4 0.68 64.3 3.7 0.76 79.0 2.4 0.80
SOPRA Bowtie -v 0 53.3 2.2 0.85 87.5 0.8 0.97 66.1 0.4 0.90
Bowtie -v 3 41.3 4.2 0.80 83.6 0.8 0.95 52.3 2.2 0.74
Bowtie 2 24.0 4.8 0.80 75.4 0.8 0.91 NAa NAa NAa
BWA 25.1 6.7 0.77 81.5 0.6 0.95 NAa NAa NAa
SSPACE Bowtie -v 0 65.9 7.6 0.72 63.0 1.4 0.85 44.0 0.3 0.83
Bowtie -v 3 62.9 11.0 0.62 63.3 2.0 0.83 46.4 0.4 0.84
a
using each read set on its own and then a third run using both sets together.
SSPACE made best use of the short fragment reads alone, finding 62% of the potential 9,230 joins, but SOAPdenovo2 and SOPRA were comparable (Additional file 2: Tables S2 and S3, Additional file 1: Figure S12) and all three scaffolders had error rates of 1% to 3%. However, SOPRA made the best use of the large fragment reads (Additional file 2: Tables S2 and S3, Additional file 1: Figure S13) therefore it was the most accurate on two read sets combined (Figure 3b) striking the best balance between making joins and minimising errors. The most aggressive settings with this tool found 87% of the joins, with an error rate under 1%. This com-pares with an average of 75% of correct joins and a 3% error rate. SGA was again the most conservative on this dataset, finding 53% of the joins and only 44 errors (<1%) with its best run. However, the most accurate run using SOPRA made 45 errors and correctly identified 82% of the potential joins and had the highest overall score of 0.97. This result still comprised over 1,000 scaf-folds from what should be 16 sequences. Both runs of Bambus2 failed on this dataset, one due to exceeding our limit of 12 days run time and the other when its memory usage reached the machine limit of 30 GB.
The proportion of skipped and lost tags becomes no-ticeable in this dataset for some of the tools, particularly when using both sets of reads. SCARPA lost 2% to 3% of the 9,318 tags and had similar numbers of skipped tags and MIP lost up to 1% of the tags. Opera had approxi-mately 1,170 skipped tags, which means that 18% of the 6,430 joins it made jumped over at least one contig. This explains the high corrected N50 of Opera (Additional file 2: Table S3), as it ignores smaller contigs. Although some users might want scaffolds with a large N50, this metric does not necessarily reflect correctly orientated contigs in a scaffold.
This dataset demonstrates the effectiveness of using li-braries of different fragment sizes, as is common prac-tice in a genome project. The percent of potential joins correctly made using just the short fragment reads aver-aged at 53% across all runs, and increased to 59% using the long fragment reads. When both sets were used to-gether the average becomes 75%, with MIP achieving 89% albeit with a high error rate of 8% to 10%.
On this dataset the mapping options appeared to be less significant than on others, with SSPACE, SCARPA and SOPRA showing little difference between their runs. This suggests that the different mappers behaved simi-larly and indeed the number of reads mapped showed little variation compared to the other real datasets (Table 2). As was the case for theS. aureusVelvet con-tigs, the number correct joins made by SOPRA was af-fected more than its error rate. The opposite was true of
MIP, with mapping settings causing its error rate to vary but relatively small changes were seen in the number of correct joins. It is notable that BWA did not map the short insert reads accurately to the extremely low GC
content genome of P. falciparum and introduced many
errors or prevented scaffolding with Bambus2 and SGA. Bowtie2 is clearly the better choice on this genome for these tools.
H. sapiens
The Velvet contigs from human chromosome 14 from
the GAGE data were scaffolded with the ‘short jump’
and ‘long jump’ libraries, of fragment length 3 kb and 35 kb, respectively. Similarly to the P. falciparum data, this meant that three scaffolding runs could be per-formed using each read set separately or combined. On average, 57% of the joins were found when using only the short jump library and 13% using the long jump li-brary, showing that the long jump library was difficult to use successfully possibly because it was of low quality and relatively low read coverage (Table 2). Some runs of Bambus2, SOPRA, SSPACE, MIP and SGA produced worse results on the combined dataset than on just the short jump reads. The net effect of this was that an aver-age of 53% of the joins were successfully found using the combined read set, which was less than that of the short jump reads.
As was the case for P. falciparum, SOPRA made best
use of combining the short and long fragment reads, suc-cessfully joining 66% of the potential 19,935 joins with an error rate of 0.4%. However, it was not such a clear winner and was comparable to Opera, which had the same error rate as SOPRA and made 65% of the joins. Again, SGA was the most conservative, making 49% of the joins cor-rectly with just three errors, but SSPACE produced scaf-folds of a similar quality. SOAPdenovo2 was the most aggressive, identifying 79% of the potential joins with a 2% error rate. The range of behaviour, from conservative folding with a small number of errors to aggressive scaf-folding, can be seen in the scatterplot in Figure 3c. The boxplot of Figure 3c shows that our scoring (white circles) is generally more conservative and the tools are more error-prone on this dataset.
The use of the 35 kb fragment size data led to a large number of skipped tags. On average each tool made 10,757 joins using the combined set of reads, but skipped 2,836 tags. However, considering just the large fragment reads, there was an average of 2,828 joins and 2,212 skipped tags, which equates to approximately eight skipped tags for every join made. This is in con-trast to two skipped tags for every 10 joins with the short insert reads.
in this study, it is only approximately 90 MB but did seem to push SOPRA to its limits. The SOPRA runs using BWA and Bowtie2 were left running for 12 days before being killed and the run using Bowtie with -v 3 took 10 days. However, the best result using SOPRA was from using Bowtie -v 0, which only took 2 hours to run. MIP crashed on this dataset when using the combined sets of reads mapped with Bowtie2 or BWA.
Resource requirements
There were large variations in running time between the scaffolders on all datasets (Additional file 1: Figures S6-S17, Additional file 2: Table S3), for which all pre-processing steps were included in addition to the running time of the scaffolding. On each dataset, either SOAPdenovo2 or SSPACE always had the shortest running time and one of SCARPA, MIP or SOPRA was slowest, usually by several orders of magnitude.
The most extreme difference was on the human data using the short and long jump reads combined, where
SSPACE’s fastest run (approximately 10 minutes) was
over 1,400 times faster than SOPRA’s slowest run
(ap-proximately 10 days). However, as noted earlier, SOPRA did complete in 2 hours using different mapping pa-rameters and in fact the faster run produced more ac-curate results.
Similarly, the differences in run time on theP. falciparum dataset were quite extreme. SOAPdenovo2 and SSPACE were the fastest, finishing in under 20 minutes, in contrast to SOPRA which was the slowest to finish successfully, clocking in at around 18 hours. One run of Bambus2 was killed after failing to complete within 12 days. To put these
numbers in context, the de novo Velvet assembly of the
short fragment reads took 44 minutes to compute.
Memory usage was not taken into account when benchmarking the tools because no scaffolder except Bambus2 used an excessive amount of memory in our
tests. Of the successful runs, the P. falciparum data
using all reads had the highest peak memory usage, aver-aging less than 5 GB. However, Bambus2 had the highest memory usage and was killed after exceeding our mem-ory limit of 30 GB while running on this dataset. SOPRA had the next highest memory usage (13 GB) over all datasets, but this was dependent on how the tool was run. The input reads must be divided into subsets, with the memory usage determined by the size of each sub-set, so using smaller subsets could reduce the total memory used by SOPRA. MIP had the third highest
usage, requiring up to 9 GB on the P. falciparum
data-set. Typically, the memory required by an assembler to produce contigs for scaffolding is likely to outweigh that needed by the scaffolding tools assessed in this paper. See Additional file 1 for more discussion of the memory usage and running times.
Wrapper and analysis scripts
We encountered a large variation in the ease of use of the tools in both installation and running. All tools as a minimum need a set of contigs in FASTA format, reads or mapped reads, and insert size information. Some tools require config files, others ask the user to carry out a number of other tasks in order to run the pipeline. For example SOPRA required the reads to be split into chunks, so that it can process the reads one chunk at a time to save excessive memory use. Notably, SSPACE was extremely simple to install and run, which almost certainly contributes to its relatively large number of ci-tations (Table 1) and hence popularity.
All of our scripts are freely available so that the ana-lysis is reproducible and can be run on new scaffolding tools as they appear. In particular, we include wrapper scripts to run each of the scaffolders tested here so elim-inating for other users the problems that we encoun-tered with ease of use.
Lost data
The only scaffolders that lost tags were MIP and SCARPA. Part of the reason for SCARPA losing data could be that in addition to scaffolding together con-tigs, it also breaks contigs where it thinks there are er-rors. However, the input contigs contained no errors so it seems unlikely that contig breaking could account for all the lost tags. Our opinion is that that data loss should never happen and should be considered a bug in the software.
Results summary
On the test cases, SCARPA generated results that were inconsistent with the input data and this trend contin-ued into the real data, where it lost data and was usually outperformed by the other tools. Overall, ABySS, Opera and MIP tended to perform reasonably well on real data, but usually did not produce the highest quality results. MIP also lost data. This agreed with the test cases, where Opera did not follow the majority rule and al-though MIP did so, it also produced some unpredictable results when there was no clear solution to the scaffold-ing problem.
joins than any other scaffolder usually with an accept-able error rate.
Discussion
The ultimate aim of the scaffolding process is to join assembled contigs into longer sequences. The outcome depends on the quality of the input contigs, the size and quality of read pair libraries and the structure of the genome. To dissect these problems we first gener-ated an apparently trivial test set (Figure 1, Additional file 1: Figures S1-S3) and were surprised by some of the unexpected or incorrect scaffolds that were produced. In particular, SOAPdenovo2 made few joins, in contrast to its aggressive behaviour on larger datasets. SCARPA tended to make either no joins or many errors and SGA joined more contigs than we expected given its apparent conservative nature on larger datasets.
We found it necessary to write wrapper scripts for most of the tools in order to use them in an automated fashion. These scripts have been made available together with all our analysis scripts. We would prefer all the tools to clearly separate off the read mapping stage and allow the scaffolding step to accept a BAM or SAM file as input, permitting any mapper to be used. This is already possible for ABySS, Bambus2, MIP, SCARPA, SGA and SOPRA. A default mapping stage or a recom-mended mapper and its parameters could still be in-cluded for ease of use.
The scaffolding process is critically dependent on the correct mapping of the reads to contigs. However, different mappers and parameters can produce vastly different mapping results, as seen in the human large in-sert reads where the percentage of reverse reads mapped ranged from 6% to 85% (Table 2). Mapping low quality reads becomes a balance between allowing enough matches so that the reads map, but too many mis-matches results in false read placement and scaffolding errors. Accuracy of read mapping is more important than aiming for as many reads mapped as possible. To this end, we recommend Bowtie2 as the best mapper for use with SGA and Bowtie for use with SOPRA. Bowtie with the option -v 0, which is the default for SSPACE, should be used for the remaining tools that let the user control the mapping. Users may wish to tailor their mapping based on knowledge of their genome of inter-est, for example BWA was not a good choice for SGA onP. falciparum.
Generally, the software performed very well on simu-lated data, with many runs producing perfect scaffolds. The difficulties arose when real libraries and genomes were used. Although the effectiveness of the scaffolders differed depending on the input data, some broad rec-ommendations can be made. Overall, SGA is the most conservative tool and should be the one of choice if
minimising errors is most important to the end user. However, this comes at a cost of making significantly fewer joins than other tools. SOPRA appears to strike the best balance between aggressively making joins, with a reasonably low error rate. It also performed the best when given two sets of reads from different fragment size libraries, presumably because it combines the link-ing information from both libraries into its graph. The downside is its scalability, with the run times becoming impractically long on large datasets. It is worth reiterat-ing that SOPRA was the first stand-alone scaffolder tool developed for NGS data at a time when datasets were significantly smaller than they are now, so that scalability issues should come as no surprise.
SSPACE and SOAPdenovo2 are good choices if a short running time is important since they were the fastest to run on all datasets but still performed well with respect to correctversusincorrect joins. SSPACE tended to be more conservative than SOAPdenovo2 on most of our datasets. Interestingly, SSPACE comfortably has the most citations of any of the scaffolding tools and is also the easiest of the tools to install and run. We do not recommend using MIP, OPERA or SCARPA because SGA, SOPRA, SOAP-denovo2 and SSPACE generally outperformed them.
Further improvements for scaffolding could come from four approaches: higher quality libraries, improve-ment of the mapping and the contigs to be scaffolded, improvement of the scaffolding algorithm itself or the use of new methods that have recently been developed that utilise chromatin interactions [24], single cell se-quencing [25] or optical mapping [26] to orientate and order contigs. Obviously, if the insert size of the library is smaller than repetitive elements in the genome or the sequencing reads do not map uniquely and are prone to errors, there will be a general limit to what a scaffolder can achieve. Longer read lengths and also new tech-niques such as those mentioned above will help to im-prove results.
Improvements to the tools are difficult, due to the complexity of the problem, but they could test each join with assembly accuracy metrics such as those of REAPR. Also, tools could improve their handling of heterozygosity, as can be seen from the results of the test cases. However, handling of polyploid genomes is an assembly problem that is not restricted to scaffold-ing and current assemblers generally assume a haploid genome. The amount of contig skipping, particularly prevalent from large insert libraries, could be reduced by removing short contigs before scaffolding, then fill-ing the gaps in scaffolds with tools such as GapFiller [29] or IMAGE [30].
Conclusions
The scaffolding problem of joining contigs using read pairs is simple to understand, but it is computationally difficult and can only be solved approximately. We rec-ommend the use of SGA, SOPRA, SOAPdenovo2 or SSPACE, depending on the requirements of the output and the size of the genome. No tool identified more than 90% of the joins across any of the genome-scale
datasets, typically leaving theP. falciparumand human
assemblies in thousands of scaffolds. Although the need for better quality large insert size libraries is evident, there is still scope for improvements to existing scaf-folding algorithms.
Materials and methods
Small test cases
Contigs of random sequence of length 5 kb were gener-ated, where each of A, C, G and T had an equal prob-ability of being chosen. The contigs were arranged in a number of configurations (see Additional file 1: Figures S1-S3) and corresponding perfect Illumina read pairs were generated, with fragments sampled uniformly from the contigs, and fragment lengths sampled from a normal distribution with mean 500 and standard devi-ation 30. The reads all had length 76 bp and every base was given a quality score of 40. We then trimmed 40 bp off the end of each contig and used these with the simu-lated reads as input to each scaffolder. Figure 1a shows an example of this read and contig generation and the corre-sponding graph is in Figure 1b. Since some scaffolders use heuristics, each test was generated and run five times.
For consistency, the contigs were always put in alpha-betical order of their names within the FASTA file input to the scaffolders. We checked that none of the contigs had any sequence in common by running BLAST against themselves (with blastall version 2.2.25 settings -p blastn -e1e-10), which reported no hits other than each contig to itself. The reads were mapped with Bowtie2 for SGA, SOAP2 for SOAPdenovo2 and using Bowtie -v 0 for all other scaffolders.
Generating input data to scaffolders
A set of contigs output from an assembler served as the starting point when producing input contigs for scaf-folding. For each of the GAGE datasets, we used
con-tigs from the Velvet assemblies. A de novoassembly of
P. falciparum3D7 was generated from Illumina paired end reads with a fragment size of 625 bp (ENA accession number ERR034295) using Velvet version 1.2.07 with a kmer of 55 and options -scaffolding no -ins_length 625 -exp_cov auto -cov_cutoff auto. Two sets of perfect contigs were made from theS. aureusgenome (excluding the plasmid se-quences), with lengths of 3 kb and 10 kb separated by gaps of 50 bp and 300 bp, respectively (see Figure 2a).
The following process was used to generate contigs with no errors and sequence tags for tracking after scaf-folding (see Additional file 1: Figure S5). The contigs from an assembler were aligned to the reference genome with the Nucmer package of MUMmer [31] version 3.23, using the options -l 180 -i 98 -q to delta-filter. Then for each contig, all overlapping hits in the refer-ence were merged and the resulting list of positions was used to make new contigs using the sequence from the reference (Figure 2b). In this way, each assembly contig gave rise to one or more artificial contigs. The result was contigs that are similar to the output of an assembler, but contain no mis-assemblies.
Next, we looked for a sequence tag within each contig that could uniquely identify that contig. For a given contig, we began by mapping its middle 50 bases to all the contigs and to the reference sequence using Bowtie2 version 2.0.5 with the default settings. If it had exactly one perfect hit to the contigs (that is, its contig of origin) and to the refer-ence sequrefer-ence, then we kept that tag. Otherwise, the process was repeated with tags of length 100, 200, 400, 600, 1,000, 2,000, and 5,000, stopping when a unique tag was found. The end result was a set of contigs containing no errors that could be unambiguously tracked before and after scaffolding. These were used as input to the scaf-folders, together with paired reads.
All ‘short jump’ reads for the GAGE datasets were
used, which have insert sizes of approximately 3 kb. We
also used the ‘long jump’ library, with insert length
Read mapping
Opera, SOAPdenovo2 and SSPACE take the reads as in-put and run the mapping for the user. Opera lets the user choose between Bowtie and BWA, with no option to change any mapping parameters. It runs BWA with default settings and Bowtie with -m 1 (only report reads that have exactly one hit) and -v 3 (allow up to three mismatches in alignments). SSPACE uses Bowtie with the option -m 1 -v 0, but does allow the user to change the value of -v. SOAPdenovo2 uses its own read mapper. MIP, SCARPA, SOPRA and SGA need the user to map the reads. SGA requires reads mapped as paired reads, whereas the others need the mapping performed as if the reads were not paired. We used BWA v0.7.4, Bowtie v0.12.8 (always with option -m 1 and the either -v 0 or -v 3 for consistency with Opera and SSPACE) and Bowtie2 v2.0.5 to make input to MIP, SCARPA, SOPRA. For SGA we only used BWA and Bowtie2 because Bowtie does not report reads within a pair that map to differ-ent contigs and so yields no scaffolding information. Except for the options noted above for Bowtie, the only mapping settings changed were those that set the max-imum insert size (-a for BWA, -X for Bowtie and Bow-tie2, the values are in Additional file 2: Table S4) to produce BAM files for SGA. The long jump human reads were found to be of low quality or have large in-sertions near their start, so before mapping we trimmed the first 19 bases off each read.
Scaffolding
All scaffolders were run using their default settings ex-cept for the following exex-ceptions. SSPACE was run using its default settings and also using -g 3 (which passes -v 3 to the Bowtie mapping call). We changed options to pre-vent tools from running in multi-threaded mode so that running times could be compared between scaffolders. In particular, we changed the source code of Opera so that the Bowtie call used one thread (Bowtie’s default) instead of the hard-coded five threads. For SOAPde-novo2 we set the number of threads to one with -p 1. The parameters used, such as insert size, for each data-set are given in Additional file 2: Table S4.
The scaffolders varied in the amount of work needed to prepare data in a suitable form for input and in the number of stages required to get from reads and contigs to a final set of scaffolds. The MIP scaffolder requires a
‘coverage file’that contains the read depth of each con-tig. This was generated from a BAM file using a custom Perl script, which is available together with all the wrap-per scripts made to make each tool simple to run.
The P. falciparum and human datasets each had two sets of reads of different insert sizes. We ran each scaf-folder separately on both sets of reads, and then a third run of each scaffolder with all reads. Some incorporate
information from both sets into the scaffolding graph sim-ultaneously, whereas others simply scaffolding using the libraries sequentially, starting with the smallest insert size.
Evaluation
The output of each scaffolding tool is a set of scaffolds, which was evaluated by identifying the position of each unique sequence tag that was generated for each input contig. The positions were determined by mapping the tag sequences back to the scaffolds using Bowtie2. There are several possible cases when analysing the location of these tags (Figure 2c). A join between two contigs was classified as correct if the corresponding tags were in the correct orientation and distance from each other. We counted the distance as correct if the error in distance was less than the fragment length. If tags were in the wrong orientation, from different chromosomes or the wrong distance apart then the join was counted as incor-rect. It is possible that a join could be correct, but have skipped some sequence (see Figure 2c, tags 2 to 4). We counted these cases separately from incorrect joins, call-ing them ‘skipped tags’, since the scaffolder could have done better by recognising that other contigs could have been inserted between the two joined contigs. A final possibility is that a tag is not found at all in the output scaffolds, which we call a‘lost’tag and consider being a serious error because a tool should not lose any data.
In order to summarise the wealth of data produced from many scaffolding runs over 12 combinations of contigs and reads, we gave precedence to five key metrics: the number of correct joins, incorrect joins, skipped tags, lost tags and total running time. All pre-processing stages were included in the running time, such as mapping reads before running a scaffolder (see Additional file 1 for more details).
A distribution of summary scores for each tool on each dataset was obtained by weighting the metrics with a range of values, as follows. Correct joins: 10, 20, 40, 80, 160; bad joins: 10, 20, 40, 80, 160; lost tags: 20, 40, 80, 160, skipped tags: 10, 20, 40, 80, 160; total CPU: 1, 2, 3, 4, 5. To emphasise the importance of accuracy, we only kept combinations of weights where: (1) bad joins≥ correct joins, (2) bad joins≥2 * skipped tags, (3) lost
tags≥correct joins. Redundant combinations were only
counted once, for example doubling all weights produces the same final score.
Additional files
Additional file 1:Extra details of the methods, results of all test cases and figures displaying the results of all datasets.
Additional file 2:Supplementary tables.
Competing interests
Authors’contributions
All authors conceived the project and wrote the manuscript. MH wrote all scripts. MH and TDO carried out analysis of output from the scaffolders. All authors read and approved the final manuscript.
Acknowledgements
Martin Hunt and Thomas Otto were supported by the European Union 7th framework EVIMalaR, Matthew Berriman by the Wellcome Trust (grant number: 098051) and Chris Newbold by the Wellcome Trust (grant number: 082130/Z/07/Z).
Software and data availability
The ENA accession numbers of theP. falciparumreads are ERR034295 and ERR163027-9 and the reference genome can be downloaded from ftp://ftp. sanger.ac.uk/pub/pathogens/Plasmodium/falciparum/3D7/3D7.latest_version/ version3/Pf3D7_v3.fasta.gz. All wrapper and analysis scripts are freely available from https://github.com/martinghunt/Scaffolder-evaluation. The simulated data can be generated using those scripts. The remaining data were all from the GAGE project and can be downloaded from http://gage. cbcb.umd.edu/data/index.html.
Author details
1Parasite Genomics, Wellcome Trust Sanger Institute, Wellcome Trust
Genome Campus, Cambridge CB10 1SA, UK.2Weatherall Institute of Molecular Medicine, University of Oxford, John Radcliffe Hospital, Oxford OX3 9DS, UK.
Received: 15 October 2013 Accepted: 3 March 2014 Published: 3 March 2014
References
1. Pagani I, Liolios K, Jansson J, Chen I-M, Smirnova T, Nosrat B, Markowitz VM, Kyrpides NC:The Genomes OnLine Database (GOLD) v. 4: status of genomic and metagenomic projects and their associated metadata. Nucleic Acids Res2012,40:D571–D579.
2. Huson DH, Reinert K, Myers EW:The greedy path-merging algorithm for contig scaffolding.J ACM2002,49:603–615.
3. Salzberg SL, Phillippy AM, Zimin A, Puiu D, Magoc T, Koren S, Treangen TJ, Schatz MC, Delcher AL, Roberts M, Marçais G, Pop M, Yorke JA:GAGE: a critical evaluation of genome assemblies and assembly algorithms. Genome Res2012,22:557–567.
4. Earl D, Bradnam K, St John J, Darling A, Lin D, Fass J, Yu HOK, Buffalo V, Zerbino DR, Diekhans M, Nguyen N, Ariyaratne PN, Sung W-K, Ning Z, Haimel M, Simpson JT, Fonseca NA, Birol I, Docking TR, Ho IY, Rokhsar DS, Chikhi R, Lavenier D, Chapuis G, Naquin D, Maillet N, Schatz MC, Kelley DR, Phillippy AM, Koren S,et al:Assemblathon 1: a competitive assessment of de novo short read assembly methods.Genome Res2011,21:2224–2241. 5. Bradnam KR, Fass JN, Alexandrov A, Baranay P, Bechner M, Birol I, Boisvert S,
Chapman JA, Chapuis G, Chikhi R, Chitsaz H, Chou W-C, Corbeil J, Del Fabbro C, Docking TR, Durbin R, Earl D, Emrich S, Fedotov P, Fonseca NA, Ganapathy G, Gibbs RA, Gnerre S, Godzaridis E, Goldstein S, Haimel M, Hall G, Haussler D, Hiatt JB, Ho IY,et al:Assemblathon 2: evaluating de novo methods of genome assembly in three vertebrate species. Gigascience2013,2:10.
6. Pop M, Kosack DS, Salzberg SL:Hierarchical scaffolding with Bambus. Genome Res2004,14:149–159.
7. Koren S, Treangen TJ, Pop M:Bambus 2: scaffolding metagenomes. Bioinformatics2011,27:2964–2971.
8. Gritsenko A, Nijkamp JF, Reinders MJT, de Ridder D:GRASS: a generic algorithm for scaffolding next-generation sequencing assemblies. Bioinformatics2012,28:1429–1437.
9. Salmela L, Mäkinen V, Välimäki N, Ylinen J, Ukkonen E:Fast scaffolding with small independent mixed integer programs.Bioinformatics2011, 27:3259–3265.
10. Gao S, Sung W-K, Nagarajan N:Opera: reconstructing optimal genomic scaffolds with high-throughput paired-end sequences.J Comput Biol 2011,18:1681–1691.
11. Donmez N, Brudno M:SCARPA: scaffolding reads with practical algorithms.Bioinformatics2013,29:428–434.
12. Dayarian A, Michael TP, Sengupta AM:SOPRA: scaffolding algorithm for paired reads via statistical optimization.BMC Bioinforma2010,11:345.
13. Boetzer M, Henkel CV, Jansen HJ, Butler D, Pirovano W:Scaffolding pre-assembled contigs using SSPACE.Bioinformatics2011,27:578–579. 14. Simpson JT, Wong K, Jackman SD, Schein JE, Jones SJM, Birol I:ABySS: a
parallel assembler for short read sequence data.Genome Res2009, 19:1117–1123.
15. Simpson JT, Durbin R:Efficient de novo assembly of large genomes using compressed data structures.Genome Res2012,22:549–556.
16. Luo R, Liu B, Xie Y, Li Z, Huang W, Yuan J, He G, Chen Y, Pan Q, Liu Y, Tang J, Wu G, Zhang H, Shi Y, Liu Y, Yu C, Wang B, Lu Y, Han C, Cheung DW, Yiu S-M, Peng S, Xiaoqian Z, Liu G, Liao X, Li Y, Yang H, Wang J, Lam T-W, Wang J: SOAPdenovo2: an empirically improved memory-efficient short-read de novo assembler.Gigascience2012,1:18.
17. Fonseca NA, Rung J, Brazma A, Marioni JC:Tools for mapping high-throughput sequencing data.Bioinformatics2012,28:3169–3177.
18. Li H, Durbin R:Fast and accurate short read alignment with Burrows-Wheeler transform.Bioinformatics2009,25:1754–1760.
19. Langmead B, Trapnell C, Pop M, Salzberg SL:Ultrafast and memory-efficient alignment of short DNA sequences to the human genome.Genome Biol 2009,10:R25.
20. Li H, Handsaker B, Wysoker A, Fennell T, Ruan J, Homer N, Marth G, Abecasis G, Durbin R:The Sequence Alignment/Map format and SAMtools.Bioinformatics 2078–2079,2009:25.
21. Gardner MJ, Hall N, Fung E, White O, Berriman M, Hyman RW, Carlton JM, Pain A, Nelson KE, Bowman S, Paulsen IT, James K, Eisen JA, Rutherford K, Salzberg SL, Craig A, Kyes S, Chan M-S, Nene V, Shallom SJ, Suh B, Peterson J, Angiuoli S, Pertea M, Allen J, Selengut J, Haft D, Mather MW, Vaidya AB, Martin DMA,et al:Genome sequence of the human malaria parasite Plasmodium falciparum.Nature2002,419:498–511.
22. Langmead B, Salzberg SL:Fast gapped-read alignment with Bowtie 2. Nat Methods2012,9:357–359.
23. Zerbino DR, Birney E:Velvet: algorithms for de novo short read assembly using de Bruijn graphs.Genome Res2008,18:821–829.
24. Burton JN, Adey A, Patwardhan RP, Qiu R, Kitzman JO, Shendure J: Chromosome-scale scaffolding of de novo genome assemblies based on chromatin interactions.Nat Biotechnol2013,31:1119–1125. 25. Hills M, O’Neill K, Falconer E, Brinkman R, Lansdorp PM:BAIT: Organizing
genomes and mapping rearrangements in single cells.Genome Med 2013,5:82.
26. Dong Y, Xie M, Jiang Y, Xiao N, Du X, Zhang W, Tosser-Klopp G, Wang J, Yang S, Liang J, Chen W, Chen J, Zeng P, Hou Y, Bian C, Pan S, Li Y, Liu X, Wang W, Servin B, Sayre B, Zhu B, Sweeney D, Moore R, Nie W, Shen Y, Zhao R, Zhang G, Li J, Faraut T,et al:Sequencing and automated whole-genome optical mapping of the genome of a domestic goat (Capra hircus).Nat Biotechnol2013,31:135–141.
27. Hunt M, Kikuchi T, Sanders M, Newbold C, Berriman M, Otto TD:REAPR: a universal tool for genome assembly evaluation.Genome Biol2013,14:R47. 28. Otto TD, Sanders M, Berriman M, Newbold C:Iterative Correction of
Reference Nucleotides (iCORN) using second generation sequencing technology.Bioinformatics2010,26:1704–1707.
29. Boetzer M, Pirovano W:Toward almost closed genomes with GapFiller. Genome Biol2012,13:R56.
30. Tsai IJ, Otto TD, Berriman M:Improving draft assemblies by iterative mapping and assembly of short reads to eliminate gaps.Genome Biol 2010,11:R41.
31. Kurtz S, Phillippy A, Delcher AL, Smoot M, Shumway M, Antonescu C, Salzberg SL:Versatile and open software for comparing large genomes. Genome Biol2004,5:R12.
doi:10.1186/gb-2014-15-3-r42