U s e r-g ui d e d r e n d e r i n g of a u d i o
o bj e c t s u si n g a n in t e r a c tiv e
g e n e ti c a l g o ri t h m
Wilso n , AD a n d F a z e n d a , B M
1 0 . 1 7 7 4 3 /j a e s . 2 0 1 9 . 0 0 3 5
T i t l e
U s e r-g u i d e d r e n d e r i n g of a u d i o o bj e c t s u si n g a n
in t e r a c tiv e g e n e ti c a l g o ri t h m
A u t h o r s
Wils o n , AD a n d F a z e n d a , B M
Typ e
Ar ticl e
U RL
T hi s v e r si o n is a v ail a bl e a t :
h t t p :// u sir. s alfo r d . a c . u k /i d/ e p ri n t/ 5 1 9 6 5 /
P u b l i s h e d D a t e
2 0 1 9
U S IR is a d i gi t al c oll e c ti o n of t h e r e s e a r c h o u t p u t of t h e U n iv e r si ty of S alfo r d .
W h e r e c o p y ri g h t p e r m i t s , f ull t e x t m a t e r i al h el d i n t h e r e p o si t o r y is m a d e
f r e ely a v ail a bl e o nli n e a n d c a n b e r e a d , d o w nl o a d e d a n d c o pi e d fo r n o
n-c o m m e r n-ci al p r iv a t e s t u d y o r r e s e a r n-c h p u r p o s e s . Pl e a s e n-c h e n-c k t h e m a n u s n-c ri p t
fo r a n y f u r t h e r c o p y ri g h t r e s t r i c ti o n s .
A. Wilson and B. M. Fazenda, “User-Guided Rendering of Audio Objects Using an Interactive Genetic Algorithm”
J. Audio Eng. Soc., vol. 67, no. 7/8, pp. 522–530, (2019 July/August.). DOI: https://doi.org/10.17743/jaes.2019.0035
User-Guided Rendering of Audio Objects Using an
Interactive Genetic Algorithm
ALEX WILSON,AES Associate Member
,AND BRUNO M. FAZENDA,AES Member
Acoustics Research Centre, University of Salford, Salford, M5 4WT, UK
Object-based audio allows for personalization of content, perhaps to improve accessibility or to increase quality of experience more generally. This paper describes the design and evaluation of an interactive audio renderer, which is used to optimize an audio mix based on the feedback of the listener. A panel of 14 trained participants were recruited to trial the system. The range of audio mixes produced using the proposed system was comparable to the range of mixes achieved using a traditional fader-based mixing interface. Evaluation using the System Usability Scale showed a low level of physical and mental burden, making this a suitable interface for users with impairments, such as to vision and/or mobility.
0 INTRODUCTION
One of the advantages of object-based audio/broadcast over traditional channel-based delivery is that it allows for the rendering of personalized content upon being delivered to the audience [1]. The methods by which personalization are achieved often require an in-depth understanding of the problem domain. For example, automatic mixing of music has built on developments in music information retrieval [2], audio engineering practice [3, 4], and the emotional response to music [5]. Meanwhile, in broadcast domains, the clarity and intelligibility of dialogue is often crucially important [6]. The interaction between speech signals and other audio and visual objects, such as music and sound effects, and the overall effect on the audience, must be well-understood for a variety of audience groups [7].
This paper describes a system that is designed to render an optimal audio mix by learning the preferences of the user and writing/rewriting object metadata (such as level and panning). While the focus is on music signals, the scope of the work extends to linear mixing of audio sig-nals in any domain. The example provided will assume no existing metadata, in order to demonstrate the flexibility of the system in adapting to user requirements, using a “listener-as-an-object” paradigm.
1 LITERATURE REVIEW
The perceived quality of an audio mix is dependent on both subjective impressions and objective measures of the signal [8]. Additionally, there is some evidence to suggest that listeners can regularly perceive the different styles of
mix engineers [3, 9]. These observations suggest that it is important to allow the user to guide a rendering system to some personal optimum. We propose the following require-ments for such a system.
1. Explore a solution space that is representative of the mixing process;
2. Acknowledge that more than one optimal solution may exist;
3. That the optimal solution(s) may vary from user to user, whether based on specific accessibility require-ments or hedonic preference.
Evolutionary computing is a framework that suits these requirements. A literature review on the use of EC in audio applications, and the argument for it’s use in an interactive audio renderer, can be found in earlier work by the authors [10]. An appropriate solution space has been proposed (a space of mixes, referred to herein as a “mix-space”) [11], as well as a method of generating a population of mixes within it [12], which is an early step in an evolutionary algorithm. The work in this paper follows on immediately from [12] and describes a method of finding personally-optimal mixes within this space.
2 DESIGN
PAPERS IGA RENDERER
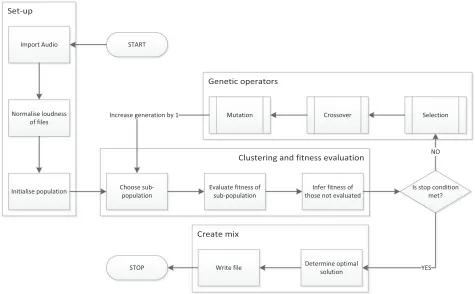
Genetic operators Set-up
Clustering and fitness evaluation
Create mix
START Import Audio
Normalise loudness of files
Initialise population Evaluate fitness of sub-population
Is stop condition met?
STOP YES
NO
Determine optimal solution
Selection Crossover
Mutation Increase generation by 1
Infer fitness of those not evaluated Choose
sub-population
Write file
Fig. 1. Flowchart illustrating the design of the system.
one element per object, which is used to create a static mix of the audio objects. Additional object metadata, such as position and equalization parameters, are not considered here although they are theoretically equivalent [12] and object-panning in stereo has been implemented in previous work by the first author [9].
2.1 Set-Up
The test audio used in trials of the developed system is of the following form: a total of six tracks where each is a single-channel .WAV file, PCM encoded at a sampling rate of 44.1 kHz, and a bit depth of 16-bits. The six tracks rep-resent vocals, guitar, bass guitar, snare drum, kick drum, and a single overhead microphone. This precise ordering of tracks ensured that, using the proposed framework [11, 12], the five parameters of the mix (φ1, ...,5) have a clear meaning:φ1indicates the balance of the vocal to the back-ing tracks,φ2 is the balance of the guitar to the “rhythm section” of bass and drums,φ3 represents the balance of bass to drums, and so on.
Considering the relatively narrowband content of the in-dividual tracks in a multitrack session, loudness was nor-malized according to a modified form of ITU-BS.1770 [13]. This ensures that the loudness of each track in a mix can be retrieved directly from the gain vector and that all points in the mix-space have the same perceived loudness [12].
The initial population of mixes was sampled from a von-Mises-Fisher (vMF) distribution, with mean vectorμand concentration parameterκ[12]. The vMF distribution can be considered the spherical equivalent of a Gaussian dis-tribution. Being points of the surface of a unit hypersphere
ensures that the2 norm of the gain vector is equal to 1. This has the advantage that each mix is presented at roughly equal loudness while also having sufficient headroom to avoid clipping. The mean vector μ represents the initial guess for the desired mix. This could come from literature or from a previous optimization session. In this paper we begin with no assumptions as to what mix would be ideal — a uniform distribution was obtained using arbitrary μ and withκ=0.
2.2 Clustering and Fitness Evaluation
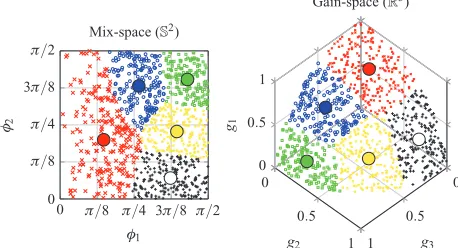
With a large population, evaluating each mix will be fa-tiguing for a user. Rather than directly evaluate the entire population, one need only rate a sub-population of sizec, reducing user burden. To achieve this the total population is divided intocclusters and a single representative mix is taken from each cluster. After a series of tests (described in [9]) the points were clustered in the gain-space (Rn, where
nis the number of tracks) using sphericalk-means cluster-ing, where the distance metric is the Cosine distance [14]. An example is shown in Fig. 2.
[image:3.585.57.532.44.338.2]Table 1. Settings used in the evaluation of the IGA mixer
Parameter Description Value
n Number of audio tracks being mixed 6
d Number of variables/dimensions in solution space n−1
Population size Number of candidate solutions per generation 100
c Number of solutions to be auditioned/evaluated in each generation 5
q Number of bits used to represent the value of each variable 7
Elite fraction Proportion of children generated as clones of fittest parents 0.05
Crossover fraction Proportion of children generated by crossover of two parents 0.85
Mutation fraction Amount of bits to be mutated in the remaining children (q×d)/3
Stop condition Condition which, when met, causes evolution to cease 10 generations
0
0.5
1 0
0.5
1 0
0.5 1
g3 g2
g1
Gain-space (R3)
0 π/8 π/4 3π/8 π/2 0
π/8 π/4 3π/8 π/2
φ1 φ2
Mix-space (S2)
Fig. 2. 1,000 solutions to a 3-track mixing problem, clustered us-ing sphericalk-means. The solutions closest to each of the cluster centroids form the sub-population to be evaluated, and the fit-ness of remaining samples is inferred based on these ratings and distance to the centroid.
Since only a subset of the population is evaluated, the fitness of the remaining individuals must be estimated. This was achieved based on the assumption that mixes close to one another share many common attributes and are perceptually similar. The primary method of inferring the fitness of an unevaluated mix was to use the dis-tance to the evaluated mix (the mix closest to the clus-ter centroid). Each mix within a clusclus-ter is awarded the same fitness as the evaluated representative and then an offset is subtracted, proportional to the distance from the centroid [18, 19].
2.3 Genetic Operations
In this example, while clustering takes place inRn, all
genetic operations are performed inSn−1. This ensures that the offspring produced by crossover and mutation are al-ways on the hypersphere inRn. Prior to genetic operations, the real-valued coordinates onSn−1were first converted to binary strings as follows. When the values ofg are posi-tive, the range ofis from 0 to 2π. To convert to a binary representation, first the range is re-scaled to [0, 1] then mul-tiplied by 2q−1, whereqis the number of bits used in the
binary representation. This has a range of [0, 2q −1]. In
this example,q=7, allowing 128 levels for each variable. As an individual in the population is comprised ofd=n−
1 coordinates, the values of each individual dimension were converted to aq-bit binary string and then concatenated to form the complete parameter vector [20].
Raw fitness values are scaled according to Eq. (1), where
ris the rank of the individual, when sorted by fitness [15]. The result is a set of scaled fitness values in the range [0,1]. This has the following advantages: a) ensures that fitness values are positive, b) ensures that the range of fitness in each generation is equal, and c) prevents the emergence of “superindividuals,” whose fitness is so much higher than others as to dominate the competition in breeding.
fscaled= 1
√
r (1)
A proportion of the population automatically survives to the next generation. These individuals are referred to as elites. In this case, the individuals with highest fitness are carried forward. This ensures that high-fitness solutions are not lost by the processes of crossover and mutation.
The crossover function (XO) is important because it pro-motes diversity in the population of solutions, helping to prevent the algorithm getting stuck in local minima. A num-ber of alternative crossover functions were tested in order to choose the most suitable for this problem.
The performance of the uniform XO was improved over the single-point XO, measured under the criteria of diversity of the resulting population. This allowed the population to better explore the space and increases the likelihood of convergence towards an optimal, rather than a local, solution.
Individual solutions also undergo mutation, which pro-motes diversity in the population. In this case, a fraction of the total bits in each solution is randomly chosen to un-dergo mutation. For each of these the value is changed from a 0 to a 1 or vice-versa. The greater this fraction the more noticeable the mutation.
2.4 Stop Criteria and Choosing the Optimal Mix
[image:4.585.49.278.199.323.2]PAPERS IGA RENDERER
0 π/8π/4 3π/8π/2 0
π/8 π/4 3π/8 π/2
φ5 0 π/8π/4 3π/8
φ4 0 π/8π/4 3π/8
φ3 0 π/8π/4 3π/8
φ2 0 π/8π/4 3π/8 0
π/8 π/4 3π/8
φ1
φ5
0 π/8 π/4 3π/8
φ4
0 π/8 π/4 3π/8
φ3
0 π/8 π/4 3π/8
φ2
1 2 3 4 5
0 π/8 π/4 3π/8 π/2
φ1
(a) Population at generation 1
0 π/8π/4 3π/8π/2 0
0.39 0.79 1.18 1.57
φ5 0 π/8π/4 3π/8 0
0.39 0.79 1.18 1.57
φ4 0 π/8π/4 3π/8 0
0.39 0.79 1.18 1.57
φ3 0 π/8π/4 3π/8 0
0.39 0.79 1.18 1.57
φ2 0 π/8π/4 3π/8
φ1
1 2 3 4 5
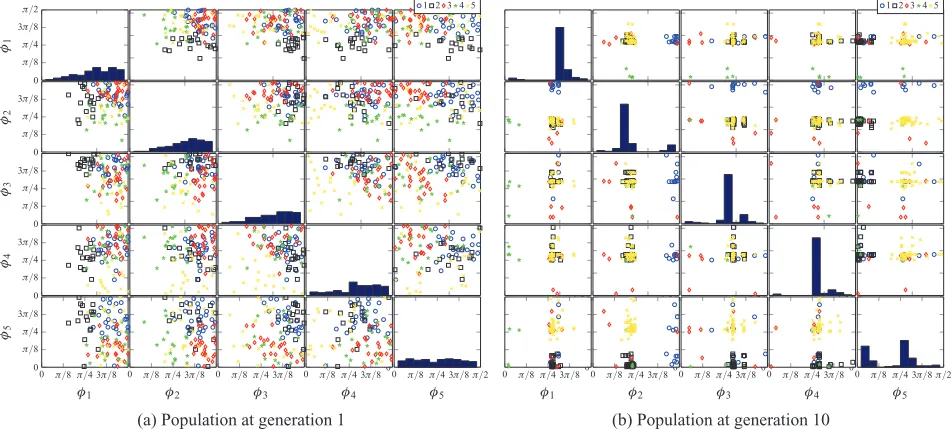
[image:5.585.59.535.44.259.2](b) Population at generation 10
Fig. 3. Population of mixes taken from one of the evaluation sessions. Symbols/colors represent the five clusters, as described in
Sec. 2.2. The histograms along the main diagonal show the distribution of eachφterm, and all have equaly-scale (0→100). These
plots show that, while mixes are initially distributed uniformly on the hypersphere, there are noticeable regions of convergence after ten generations.
1. Since fitness was subtracted in proportion to distance from the evaluated individuals, the individual with the highest fitness will always be one of the directly-evaluated sub-population, while that might not be the case in reality.
2. Many problems that can be addressed by Interac-tive Evolutionary Algorithms are perceptual and as such do not requireexactsolutions but rather seek to identify an area of the solution space in which many good solutions exist that are perceptually sim-ilar [16]. For example, in an audio mixing problem there is a limit to the precision required when deter-mining some metadata values. For example, small adjustments in the gain of individual tracks might not be reliably perceived.
If the population converges on a small region of the solution space, the centroid of the final population is an appropriate choice for the optimal solution, or “best” mix. Determining this point employed kernel density estimation (KDE) methods. Two methods were tested here: multiple univariate KDE, where the density of the population is evaluated separately for each dimension, and multivariate KDE, where the density of the population is determined in the multivariate space. The results from both methods were compared and show a high level of agreement [9]. The univariate method was used in order to reduce computation time.
3 EVALUATION
The aim of the work in this section is to ascertain how users interact with the system and whether or not it can be considered useful. The following are the research questions pertaining to this section.
1. What are the median loudness levels of instruments when mixed using this system?
2. How does this compare to a more traditional, fader-based approach?
3. How is the user experience evaluated, qualitatively, by the user?
The first two questions relate to the results found in the literature, indicating that voice is prioritized in music/audio mixes and some consensus is observed regarding the rel-ative levels of drums and bass in music [9, 21]. Should similar levels and distributions of track gain be found then it could be said that the proposed system does not prohibit the user from finding the type of mix they would create with a traditional system.
0 π/8 π/4 3π/8 π/2 0
5 10 15
φ1
density
0 π/8 π/4 3π/8 π/2
0 5 10
φ2
density
0 π/8 π/4 3π/8 π/2
0 10 20
φ3
density
0 π/8 π/4 3π/8 π/2
0 10 20
φ4
density
0 π/8 π/4 3π/8 π/2
0 2 4
φ5
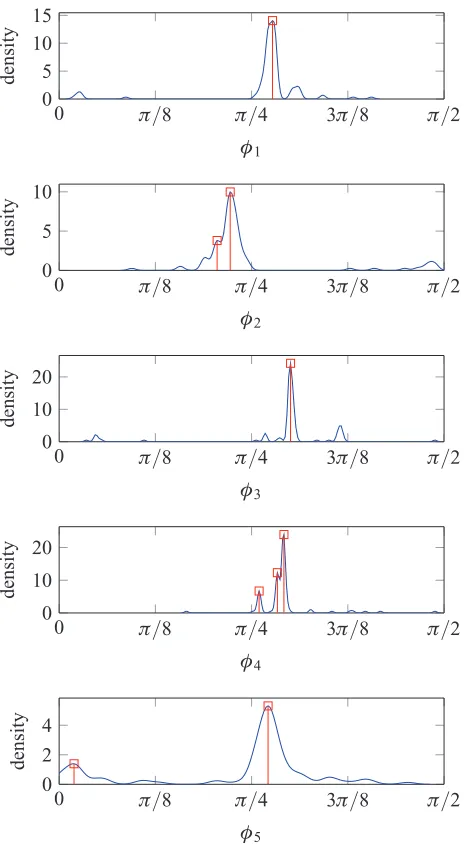
[image:6.585.49.283.40.463.2]density
Fig. 4. Univariate KDE result from one of the sessions. Peaks in each distribution are marked. Taking the greatest peak in each
provides a 5-elementvector (onS5) which is transformed to a
6-element gain vector (inR6).
The only visual information presented to the user was a simple GUI to gather ratings of mixes and to provide a progress update at the end of each generation. Conse-quently, the user needed to rely solely on auditory percep-tion and would not be able to mix based on visual or tactile stimuli, such as with a fader-based system. When rating mixes, participants were advised that a rating of 10/10 rep-resented their ideal mix, while a rating of 1/10 is a mix most far from ideal, in any of the many ways that this might be possible. Over all 14 participants, the median amount of time taken to evaluate 10 generations (50 mixes) was 11 minutes 17 seconds. As a mix deemed to be poor can be evaluated rather quickly, this short duration was not unex-pected.
Upon completing 10 generations the optimal mix was estimated using the univariate KDE method (see Fig. 4). This mix was then played back to the user for informal evaluation but was not rated quantitatively.
1 2 3 4 5 6 7 8 9 10
0 2 4 6 8 10
Generation
Ra
w
fitness
[image:6.585.305.527.43.176.2]scores
Fig. 5. Boxplot showing the raw fitness scores per generation for all 14 participants’ sessions (1,400 mixes per generation).
Fig. 5 shows the distribution of raw fitness scores per generation when data from all participants was combined. As desired, the fitness of the population typically increased as the system evolves. A few additional observations can be made from this plot.
1. As the initial population is uniformly distributed on the hypersphere, there is likely to be a variety of mixes, rated good and bad. Since gen #2 represents the first evolved generation it is credible that the median fitness may drop initially.
2. As anticipated, the fitness increases over the dura-tion of the session, mostly between generadura-tions 3 and 7. This indicates that once the system has iden-tified an optimum point based on user ratings, after a few generations of searching, it slowly begins to converge.
3. This convergence reaches a saturation point at gener-ation 7 as no regular improvement in median fitness is observed from here on.
It is important to note that while the best mixes in a given generation are passed on to the next generation (as "elite" children), they may not survive another generation. This is due to the fact that the inferred fitness is always determined by subtracting an offset from the rated subset. The best mix in a given generation is therefore one that was part of the rated subset. Once the system completed 10 generations of user-evaluation and evolution, the univariate KDE method was used to determine that participant’s supposed ideal mix.
3.1 Survey Responses
PAPERS IGA RENDERER
Table 2. Comparision of levels. Fader results are from [9], where Faders(all) pertains to the entire experimental data from that study and Faders(LS.sc) is the subset of results
matching the conditions in this, IGA, study (using loudspeakers and the song “Sister Cities” by Hop Along).
Median Level (LUFS)
Track IGA Faders(LS.sc) Faders(all)
Vox –2.72 –2.30 –2.85
Gtr –10.84 –8.89 –8.56
Bass –10.37 –10.43 –10.46
Drums –7.62 –8.33 –8.11
Snare –14.57
Kick –16.69
OH –12.79
a 5-point Likert scale, marked at the extremes by “strongly disagree” and “strongly agree.”
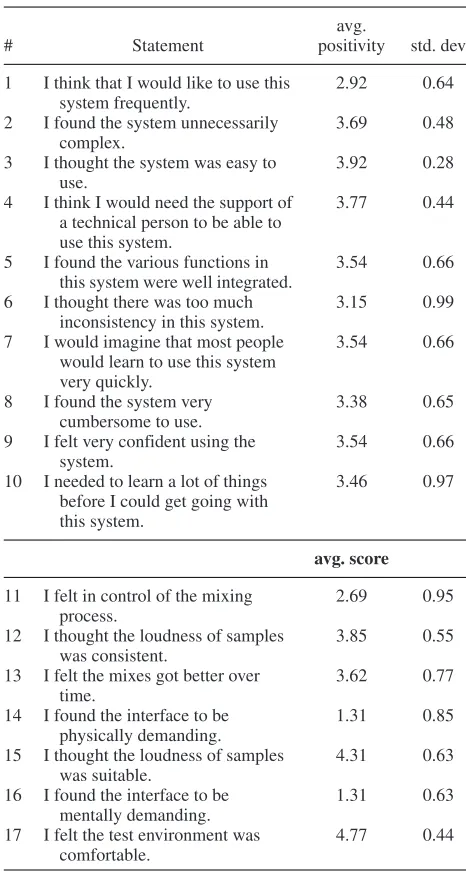
High scores on odd numbered questions indicate a pos-itive impression of system usability, as do low scores on even-numbered questions. Scoring of the questionnaire results is as follows: for odd items, subtract one from the user response. For even-numbered items, subtract the user responses from 5. This scales all values from 0 to 4 (with four being the most positiveresponse). Sum the converted responses for each user and multiply the to-tal by 2.5. This converts the range of possible values from 0 to 10.
Table 3 shows the mean of the converted scores for each item. Note that the score shown for items 1 to 10 is the mean positivity (from 0 to 4), not the mean of the raw scores (i.e., not the level of agreement with the statement). For items 11 to 17 the score shownisthe mean level of agreement with the statement. Across all users, the median SUS score for the system is 90, while the range was 75 to 95. This score by itself does not offer much insight without other systems to compare to. [23] analyzed the SUS scores from a variety of different systems and found the average SUS score from over 200 studies to be 70. This suggests that the proposed system is highly usable.
4 DISCUSSION
4.1 Optimal Levels
A comparison between the median track levels obtained in this experiment and in a fader-based experiment in the same location is shown in Table 2. This reveals that dif-ferences found between the two methods are small. The largest difference is that the guitar was typically set quieter using the IGA system, by about 2 LU. The level of the vo-cals in the IGA experiment is closer to the Faders(all) level than Faders(LS.sc), indicating that this level may generalize well to other songs. A precise match between experiments would have been surprising, especially considering the IGA method only approximates the user’s ideal mix in the final KDE stage. That said, the close match for vocals, bass, and drums (to a slightly lesser extent) indicates the success of the IGA method. From this it may be claimed with some
Table 3. Survey results for IGA mixer, showing the mean and standard deviation of the data.
avg.
# Statement positivity std. dev
1 I think that I would like to use this system frequently.
2.92 0.64
2 I found the system unnecessarily
complex.
3.69 0.48
3 I thought the system was easy to
use.
3.92 0.28
4 I think I would need the support of
a technical person to be able to use this system.
3.77 0.44
5 I found the various functions in
this system were well integrated.
3.54 0.66
6 I thought there was too much
inconsistency in this system.
3.15 0.99
7 I would imagine that most people
would learn to use this system very quickly.
3.54 0.66
8 I found the system very
cumbersome to use.
3.38 0.65
9 I felt very confident using the
system.
3.54 0.66
10 I needed to learn a lot of things
before I could get going with this system.
3.46 0.97
avg. score
11 I felt in control of the mixing process.
2.69 0.95
12 I thought the loudness of samples
was consistent.
3.85 0.55
13 I felt the mixes got better over
time.
3.62 0.77
14 I found the interface to be
physically demanding.
1.31 0.85
15 I thought the loudness of samples
was suitable.
4.31 0.63
16 I found the interface to be
mentally demanding.
1.31 0.63
17 I felt the test environment was
comfortable.
4.77 0.44
confidence that the IGA method is capable of creating a range of mixes similar to that which would be created us-ing the conventional fader-based approach but usus-ing a very different and much less complex interface.
4.2 Usability
[image:7.585.61.281.96.218.2]was too much inconsistency in this system”). This seems to indicate that difficulties experienced by users were due to lack of direct, explicit control over the parameters of the mix, as further corroborated by the results pertaining to statement #11 (“I felt in control of the mixing process”). When asked whether the system was either physically or mentally demanding, users typically responded that neither was the case, suggesting the system has a low level of user-burden. Achieving its goal of low or inexistent physical burden affords a high level of accessibility. From the SUS items, the statement obtaining the most positive response was #3 (“I thought the system was easy to use”). Impor-tantly, users generally felt that mixes got better over time, as desired.
4.3 Applications
The system described in this paper allows a method of audio which relies only on audition, as it features a mini-mal amount of visual or tactile stimuli. Users described the system has having low levels of physical or mental burden. Consequently, this system could act as a mixing assistant to a visually impaired audio engineer, or be tailored to suit a range of accessibility requirements, such as where mobil-ity is impaired. It is hoped that further research into such interfaces could widen participation in audio engineering and broadcast careers.
In this paper the user of the system partakes in active fit-ness evaluation, carefully considering the qualities of each presented solution, thus allowing the all-important human decision into the final outcome. One challenge moving for-ward will be to complement this with other forms of fitness evaluation, where the rating of solutions is embedded in some other process such that the user is not aware of the system’s learning process. One such form could be achieved through implementing bio-physiological response into the interaction loop [24]. This would allow for increased per-sonalization of object-based content, where the renderer adapts to the requirements of the user in an unobtrusive manner.
4.4 Further Work
While a typical genetic algorithm relies on an objec-tive fitness function, this is difficult to implement for a subjective task such as audio-mixing. In the case of a televised/radio drama, measures such as speech intelligi-bility could be used as an objective function, however a variety of constraints would be necessary, as intelligibil-ity can easily be maximized by simply muting all other objects.
With each learning session, the system has the potential to adapt further. By associating the evolution of the solution with the measured signal features of the input audio tracks, the system could further learn general traits of audio mixing. It has been shown that in large collections of music-mixes, there is noticeable central tendency in the distributions of audio signal features [17]. This could be used to provide objective rules to help constrain the system in addition to the guidance of the user.
Whether or not this is desired is another issue. In this pa-per the aesthetic proposed is one where the system makes no prior assumptions of the process. Earlier attempts at automatic rendering have perhaps had an over-reliance on prior assumptions and so-called best-practice mixing tech-niques. Combining both strategies—adapting to a specific user while also learning best-practice from a collection of users—will be a challenge in further development of this and related systems.
5 CONCLUSIONS
This paper has described a user-guided rendering sys-tem, using an interactive genetic algorithm, which could be utilized in object-based broadcast or in a more traditional production environment. While this paper deals only with audio levels, addition of panning and equalization is pos-sible. When using the proposed system in a simple music-mixing task, participants were able to create a range of mixes comparable to those made using the conventional fader-based system. This suggests that the system is not an obstacle to the creation of desired content and does not im-pose noticeable limits on what content can be created. The system was considered to be highly usable. Both physical and mental demands were reported to be low. Consequently it is predicted that the system would be suitable for a variety of applications where physical interaction is to be kept low.
6 REFERENCES
[1] M. Armstrong, M. Brooks, A. Churnside, M. Evans, F. Melchoir, and M. Shotton, “Object-Based Broadcasting—Curation, Responsiveness and User Expe-rience,”IET Conference Proceedings, no.1, pp. 12.2–12.2 (2014 Jan.), doi: 10.1049/ib.2014.0038.
[2] J. Scott and Y. E. Kim, “Instrument Identifica-tion Informed Multi-Track Mixing,” presented at the14th International Society for Music Information Retrieval Con-ference (ISMIR 2013)(2013).
[3] B. De Man,Towards a Better Understanding of Mix Engineering, Ph.D. thesis, Queen Mary University of Lon-don (2017).
[4] D. M. Ronan, H. Gunes, and J. D. Reiss, “Analysis of the Subgrouping Practices of Professional Mix Engineers,” presented at the142nd Convention of the Audio Engineering Society(2017 May), convention paper 9700.
[5] D. Ronan, J. D. Reiss, and H. Gunes, “An Empirical Approach to the Relationship between Emotion and Mu-sic Production Quality,”arXiv preprint arXiv:1803.11154
(2018).
[6] M. Armstrong, “From Clean Audio to Object Based Broadcasting,” BBC R&D White Paper, WHP, vol. 324 (2016).
PAPERS IGA RENDERER
[8] A. Wilson and B. M. Fazenda, “Perception of Audio Quality in Productions of Popular Music,”J. Audio Eng. Soc., vol. 64, pp. 23–34 (2016 Jan./Feb.), doi: https://doi. org/10.17743/jaes.2015.0090.
[9] A. Wilson,Evaluation and Modelling of Perceived Audio Quality in Popular Music, towards Intelligent Music Production, Ph.D. thesis, University of Salford (2017).
[10] A. Wilson, R. Loughran, and B. M. Fazenda, “On the Suitability of Evolutionary Computing to Developing Tools for Intelligent Music Production,” presented at the3rd Workshop on Intelligent Music Production (WIMP 2017)
(2017).
[11] A. Wilson and B. M. Fazenda, “Navigat-ing the Mix-Space: Theoretical and Practical Level-Balancing Technique in Multitrack Music Mixtures,” pre-sented at the Sound and Music Computing Conference
(2015 July).
[12] A. Wilson and B. M. Fazenda, “Populating the Mix Space: Parametric Methods for Generating Multitrack Au-dio Mixtures,” Applied Sciences, vol. 7, no. 12, p. 1329 (2017), doi: 10.3390/app7121329.
[13] P. D. Pestana, J. D. Reiss, and A. Barbosa, “Loud-ness Measurement of Multitrack Audio Content Using Modifications of ITU-R BS. 1770,” presented at the134th Convention of the Audio Engineering Society(2013 May), convention paper 8813.
[14] K. Hornik, I. Feinerer, M. Kober, and C. Buchta, “Spherical k-Means Clustering,”J. Stat. Software, vol. 50, no. 10, pp. 1–22 (2012), doi: 10.18637/jss.v050.i10.
[15] D. Goldberg, K. Deb, and B. Korb, “Messy Ge-netic Algorithms: Motivation, Analysis, and First Results,”
Complex Systems, no. 3, pp. 493–530 (1989).
[16] H. Takagi, “Interactive Evolutionary Computa-tion: Fusion of the Capabilities of EC Optimization and
Human Evaluation,”Proceedings of the IEEE, vol. 89, no. 9, pp. 1275–1296 (2001), doi: 10.1109/5.949485.
[17] A. Wilson and B. Fazenda, “Variation in Multitrack Mixes: Analysis of Low-Level Audio Signal Features,”
J. Audio Eng. Soc., vol. 64, pp. 466–473 (2016 Jul./Aug.), doi: 10.17743/jaes.2016.0029.
[18] J.-Y. Lee and S.-B. Cho, “Sparse Fitness Evalua-tion for Reducing User Burden in Interactive Genetic Al-gorithm,” IEEE International Fuzzy Systems Conference Proceedings (FUZZ-IEEE‘99), pp. 998–1003 vol. 2 (1999), doi: 10.1109/FUZZY.1999.793088.
[19] H.-S. Kim and S.-B. Cho, “Application of Inter-active Genetic Algorithm to Fashion Design,” Engineer-ing Applications of Artificial Intelligence, vol. 13, no. 6, pp. 635–644 (2000), doi: 10.1016/S0952-1976(00)00045-2.
[20] A. H. Wright, “Genetic Algorithms for Real Param-eter Optimization,” inFoundations of Genetic Algorithms, vol. 1, pp. 205–218 (Elsevier, 1991), doi: 10.1016/b978-0-08-050684-5.50016-1.
[21] B. De Man, B. Leonard, R. King, and J. D. Reiss, “An Analysis and Evaluation of Audio Features for Mul-titrack Music Mixtures,” 15th International Society for Music Information Retrieval Conference (ISMIR 2014), pp. 137–142 (2014).
[22] J. Brooke, et al., “SUS-A Quick and Dirty Usability Scale,”Usability Evaluation in Industry, vol. 189, no. 194, pp. 4–7 (1996).
[23] A. Bangor, P. T. Kortum, and J. T. Miller, “An Em-pirical Evaluation of the System Usability Scale,”Intl. J. Human–Computer Interaction, vol. 24, no. 6, pp. 574–594 (2008), doi: 10.1080/10447310802205776.
THE AUTHORS
Alex Wilson Bruno M. Fazenda
Alex Wilson is a postdoctoral researcher at the University of Salford, investigating the perception of object-based audio reproduction systems. He completed a Ph.D. at the same institution in 2017, investigating the perception of audio quality in music production. He is interested in the intersec-tion of audio technologies and human decision-making and has published works relating to psychoacoustics, digital signal processing, music production, accessibility, scien-tometrics, and social network analysis. He is a committee member of the AES Ireland section, since it’s foundation in 2019.
•
Bruno Fazenda received a B.Sc. (1st Hons.) degree in audio technology in 1999 and a Ph.D. degree in 2004 for