Munich Personal RePEc Archive
Do Independent Expert Directors
Matter?
Masulis, Ronald and Ruzzier, Christian and Xiao, Sheng and
Zhao, Shan
1 June 2012
Do Independent Expert Directors Matter?
Ronald W. Masulis
a, Christian Ruzzier
b, Sheng Xiao
cand Shan Zhao
dJune 1, 2012
Abstract
The generally weak correlation between board independence and firm performance is a major empirical puzzle. One possible explanation is that director independence alone is not enough. To explore this possibility, we examine the full employment histories of independent directors at S&P 1500 companies. We define an independent expert director (IED) as an independent director who has worked in the same 2-digit SIC industry as the company where he/she serves as an independent director. We show that the proportion of IEDs on a board is positively and significantly correlated with firm performance. We find that when the proportion of IEDs is higher, there are fewer earnings restatements and larger cash holdings. Firms with IEDs have higher CEO pay-performance sensitivity, higher CEO turnover-performance sensitivity, and more patents with more citations. Stock market investors react positively to IED appointments. We also find the higher the CEO power, the less likely IEDs will be on board.
Key words: corporate governance, independent directors, experience, restatement, cash holding, executive compensation, CEO turnover, innovation, CEO power
JEL Classification: G32, G34
a. Australian Business School, University of New South Wales, Sydney, NSW, Australia. Email: ron.masulis@unsw.edu.au
b. Departamento de Economía, Universidad de San Andrés, Buenos Aires, Argentina. Email: cruzzier@udesa.edu.ar
c. Bill and Vieve Gore Business School, Westminster College, Salt Lake City, UT 84105, US. Email: sxiao@westminstercollege.edu
“Over a span of 40 years, I have been on 19 public company boards and have interacted with perhaps 250 directors. Most of them were ‘independent’ as defined by today’s rules. But their contribution to shareholder well-being was minimal at best. These people simply did not know enough about the business.”
---Warren Buffet (Chair, Berkshire Hathaway)
1. Introduction
The first decade of the 21st century has witnessed a series of legislative and regulatory efforts
to increase the proportion of independent directors on corporate boards. For example, in response to
major corporate scandals and to strengthen the corporate governance practices of publicly listed firms
in America, the US Congress passed the Sarbanes-Oxley Act (SOX: Public Company Accounting
Reform and Investor Protection Act) in 2002, which requires that the audit committees of all publicly
listed firms in the US consist solely of independent directors. In 2003, both New York Stock
Exchange and NASDAQ announced that it would require all companies listed at NYSE to have a
majority of independent directors after 2005. NYSE further required that the nominating, corporate
governance, and compensation committees of companies listed at NYSE to consist entirely of
independent directors after 2005.
These legislative actions were based on the “conventional wisdom” that a mandatory increase
in board independence would lead to better corporate governance, which in turn would provide better
protection of shareholders’ interests and lead to better corporate decisions and firm performance.
Unfortunately, so far, this “conventional wisdom” has not yet found solid empirical evidence to
support it. For example, the proportion of independent directors on a board is not robustly correlated
with either corporate policies (e.g., Guthrie et al., forthcoming) or firm performance (Bhagat and
Black, 2001). Sometimes, the signs of the correlations found in samples are even opposite to what the
Based on this evidence, should we infer that board independence does not matter for corporate
decisions and firm performance?
We argue that the failure to find robust empirical evidence to support the “conventional
wisdom” is due to the fact that previous studies rely on the proportion of independent directors as the
measure of board independence. The major problem with this measure is that by treating all
independent directors as a homogeneous group, it masks the heterogeneity among them. We argue that
researchers have largely overlooked one particularly important dimension of independent directors’
heterogeneous qualities: their industry experience.
The intuition behind our argument may be best summarized by a quote from Bob Tricker, the
founding editor of Corporate Governance: An International Review:
“Herein lies a dilemma. The more independent directors are, the less they are likely to know about the
company, its business and its industry. Conversely, the more directors know about the company’s
business, organization, strategies, markets, competitors, and technologies, the less independent they
become. Yet such people are exactly what top management needs to contribute to its strategy, policy
making and enterprise risk assessment.”1
Facing this apparent tradeoff between directors’ independence and their industry-specific
knowledge, it is not surprising that independence alone would not suffice to make a director a better
one. As a result, it is not surprising that the proportion of independent directors is not robustly
correlated with either corporate decisions or firm performance. In fact, anecdotal evidence shows that
investors pay attention to not only the independence of directors, but also their industry experience.
The market reactions to the replacement of independent directors of Bank of America in 2009 provide
a case in point. On June 6, 2009, the Wall Street Journal reported that “[f]our outside directors with
1
experience in banking or financial oversight joined Bank of America Corp.’s board Friday, a move
aimed at satisfying strong suggestions from federal regulators that the Charlotte, N.C., lender improve
its corporate governance.” The Wall Street Journal mentioned that these four new outside directors
with experience in the banking industry replaced two incumbent outside directors without experience
in the banking industry. Table 1 reports the dramatic market reaction to this news.
Insert Table 1 here
When the 2008 financial crisis broke out, corporate boards at rescued institutions took partly
the blame of the collapse. Clearly, SOX was not enough: the banks in trouble were largely in
compliance with SOX and had an 80% of independent directors sitting on their boards (Pozen, 2010).
Adams (2011), in her research on corporate governance and the financial crisis, also finds that the
“most surprising result” was that TARP banks (i.e., bailed-out banks) had boards that were more
independent than non-TARP banks. While board independence is indisputably important to ensure
right incentives for board directors to perform their roles, especially their monitoring role, directors’
abilities and information are at least as important as their incentives for them to effectively perform
their monitoring and advisory roles. Board directors develop their industry-specific abilities and
information through industry experience.
Based on our above analysis and anecdotal evidence, we propose our fundamental hypothesis:
independent expert directors (IEDs), i.e., independent directors with industry experience, have
positive and significant effects on firm performance, but independent non-expert directors (INEDs),
i.e., the independent directors with no industry experience, do not have significant effects on firm
performance. We further investigate how IEDs affect firm performance by influencing major
corporate decisions, such as earnings restatement, cash holdings, CEO pay-performance sensitivity,
firm performance and corporate decisions depend on the nature of the specific firms, such as their
complexity and their other external and internal corporate governance mechanisms. We also
hypothesize that investors react more positively to the appointments of IEDs versus the appointments
of INEDs. Lastly, we hypothesize that powerful CEOs would entrench themselves by deterring
appointments of IEDs. Therefore, CEO power is expected to be negatively correlated with the
presence of IEDs on the board.
To test the above hypotheses, we collect information on the full employment histories of board
directors of S&P 1,500 companies between 2000 and 2008 from the BoardEx database of
Management Diagnostics Ltd., a professional human resources management company. This database
has been used by Fracassi and Tate (2012) in their analysis of external network connections between
directors and CEOs. In contrast with other databases that only record the current employment
affiliations of board directors (such as RiskMetrics and Board Analyst), BoardEx carefully records the
full employment history of board directors, thus allowing us to accurately classify independent
directors into IEDs and INEDs. We define an IED as an independent director who has worked in the
same 2-digit SIC industry as the company where he/she serves as an independent director. BoardEx
also meticulously records the announcement dates of new director appointments, thus allowing us to
conduct event studies to contrast the market reactions to IED appointment announcements with the
market reactions to INED appointment announcements.
To estimate the effects of IEDs and INEDs on firm performance, we use Heckman’s (1979)
two-step procedure to produce consistent estimates that account for self-selection (similar to Masulis
and Mobbs, 2011). For the first step estimation, inspired by Knyazeva et al. (2011), we use the
number of firms in the same industry in the neighborhood (defined as the first 3 digits of the ZIP code)
between firms in the same industry, we only count firms in the same 2-digit SIC industry but not in
the same 4-digit SIC industry as the exogenous determinant of IEDs.
Our first step estimation in the Heckman two-step procedure shows that in more complex firms,
as measured by their R&D intensity, IEDs are more likely to be present. This result is intuitive
because more complex firms have greater need for industry-specific knowledge for decision making.
Our second step estimation in the Heckman two-step procedure shows that the proportion of IEDs, but
not INEDs, is positively and significantly correlated with industry-adjusted logarithm market-to-book
ratio. This confirms our hypothesis that IEDs significantly enhance firm performance, while INEDs
do not have significant effects on firm performance. We also find that for firms that report positive
R&D expenditures, IEDs significantly enhance firm performance, but for firms that report zero R&D
expenditures, IEDs do not have significant effects on firm performance. Further, we find that for firms
with higher information costs, defined as those with more analyst forecast dispersion, or fewer
analysts following them, IEDs significantly boost firm performance, while for firms with lower
information costs, IEDs do not have significant effects on firm performance.
Our investigation into the effects of IEDs on key corporate decisions show that the proportion
of IEDs, but not the proportion of INEDs, on the board, is negatively and significantly correlated with
the probability of earnings restatements, especially for firms with less entrenched CEOs, i.e., firms
with an E-index below the median. This suggests that as the CEOs become more entrenched, IEDs
may be less likely to challenge the CEOs. As the result, the effectiveness of IEDs’ monitoring role
diminishes as the CEOs become more entrenched.
Further, we show that the proportion of IEDs, but not the proportion of INEDs, on the board, is
positively and significantly correlated with firm’s cash holdings, especially for firms with positive
pay-performance sensitivity. It also significantly boosts the innovative activities of the firm, as
measured by the number of patents and citations.
Finally, we show that the more CEO power, the less likely that IEDs would be present on a
board. This confirms our hypothesis that powerful CEOs tend to deter appointments of IEDs on the
board so that they may capture the board more easily.
To the best of our knowledge, our paper is the first to systematically examine the effects of
independent directors’ industry experience on key corporate decisions and firm performance. It is
puzzling why there is no robust correlation between board independence, corporate decisions and firm
performance. We tackle the puzzle from the angle of the industry experience of independent directors.
Our results show that IEDs are more likely to contribute to higher firm performance by making better
key corporate decisions.
Our paper complements the literature on the expertise and experience of board directors. For
example, Guner et al. (2008) and Kroszner and Strahan (2001) examine the impact of the financial
expertise of directors on firm decisions. McDonald et al. (2008) examine the effects of outside
director acquisition experience on firm acquisition performance. Knyazeva et al. (2009) investigate
the impact of board heterogeneity on firm value and key decisions. On the other hand, Kor and
Fredrickson (2008) examine the difference in outside directors’ industry-specific experience between
young and old firms from a demand-side perspective. Dass et al. (2011) examine the roles of
“directors from related industries” and find evidence that such directors help bridge the information
gap between supplier firms and customer firms.
The remainder of the paper is organized as follows. We review the related literature on board
directors, corporate decisions and firm performance and develop hypotheses in Section 2. Section 3
2. Literature Review and Hypothesis Development
Even though independent directors are expected to generate significant improvements in firm
performance through their monitoring and advisory activities, the existing literature shows mixed
empirical evidence that puzzles researchers, investors and regulators. For example, Bhagat and Black
(2001) find “no convincing evidence that greater board independence correlates with greater firm
profitability or faster growth”, and even “some evidence that firms with supermajority-independent
boards are less profitable than other firms.” Bhagat and Bolton (2008) examine updated data and
actually find that board independence is negatively correlated with contemporaneous and subsequent
operating performance. On the other hand, Nguyen and Nielsen (2010) find that the stock market
reacts negatively to sudden deaths to independent directors in the US (very short-term changes in firm
value) and they conclude that this provides some evidence that the independent directors provide a
valuable service to shareholders.
The current literature offers explanations of the mixed results from different angles. These
angles include: (1) Endogeneity: Hermalin and Weisbach (1998, 2003), Harris and Raviv (2008), and
Adams et al. (2010) argue that the lack of a robust relationship between board independence and firm
performance is due to the endogeneity of board composition; (2) The strategic information transfer
from the CEO to board directors: Adams and Ferreira (2007) show in theory that board directors need
sufficient information about the firms to effectively perform their advisory and monitoring roles, but
the CEOs may choose to disclose different amount of information when they consider directors’ dual
roles; whereas Faleye et al. (2011) show empirically that as the board becomes more independent, the
negative advising effects outweigh the benefits of improved monitoring; (3) The definition of
“independent directors:” Hwang and Kim (2009) and Fracassi and Tate (2012) argue that
directors” have strong social ties with directors, and that those social ties tend to significantly reduce
firm value; (4) The heterogeneity of firms: Coles et al. (2008), for example, find that the optimal
board size varies with the complexity of firms, and the optimal board size tends to be larger for more
complex firms; and Masulis et al. (2012) find that the impact of foreign independent directors (FDIs)
on firm performance depends on whether the firm has much business presence in its FID’s home
region.
We offer a new explanation for the empirical puzzle of why board independence has no robust
correlation with firm performance. Specifically, we hypothesize that IEDs, instead of all independent
directors, have significant and positive effects on firm performance. This is because IEDs have both
the incentives and industry-specific expertise to effectively perform their advisory and monitoring
roles. The industry-specific expertise can help IEDs alleviate the information asymmetry between
independent directors and corporate insiders such as the CEO. Ravina and Sapienza (2010) show that
firm information asymmetry can be a serious problem. They contrast the profitability of trades in their
companies’ stocks made by independent directors and corporate insiders, respectively. They find that
although both groups make profits in their trades, independent directors make significantly less profit
than corporate insiders, which shows that the information asymmetry between them can be really
severe.
We also hypothesize that for more complex firms, such as firms with positive R&D
expenditures, IEDs are particularly important because their industry-specific knowledge would be
more useful there; whereas for less complex firms, such as firms with zero R&D expenditures, IEDs
may not be as important. This is because for more complex firms, the cost of acquiring information is
higher than for less complex firms, so the marginal contributions made by IEDs are greater than those
directors to firm performance depend on the cost of acquiring information. They find that the
effectiveness of outside directors depends on the cost of acquiring information about the firm.
Specifically, they show that when the cost of acquiring information is low and outside directors are
added to the board, firm performance improves. However, when the cost of acquiring information is
high and outside directors are added to the board, firm performance deteriorates. We hypothesize that
IEDs can make more positive contributions to firm performance when information costs are higher.
The above analysis leads us to our first hypothesis:
Hypothesis 1: IEDs, but not INEDs, have significant and positive effects on firm performance. Such
effects are more important for complex firms. Such effects are more important for firms with higher
information costs.
To address endogeneity concerns in testing Hypothesis 1, we use the Heckman 2-step
estimation procedure as well as 2SLS estimation. We also conduct an event study of the market
reactions to appointments of IEDs versus INEDs and contrast these market reactions.
We further investigate the channels through which IEDs may have significant and positive
effects on firm performance. Specifically, we propose the following hypotheses related to how IEDs
influence corporate decisions:
Hypothesis 2: IEDs, but not INEDs, can effectively deter earnings restatements. Such effects are
Agrawal and Chadha (2005) show that board independence is unrelated to the probability of
earnings restatements. We hypothesize that IEDs, instead of all independent directors, can
significantly lower the probability of earnings restatements, because their industry-specific expertise
will allow them to be effective monitors. Even if they are not financial experts, their intuition
developed through industry experience can allow them to detect abnormal accounting numbers and
prevent earnings misreporting and subsequent restatements more easily than independent directors
without relevant industry experience. IEDs may be able to perform their monitoring role more easily if
the CEO is less entrenched, because the board may have more bargaining power with a less
entrenched CEO, and receive more firm-specific information as the result.
Hypothesis 3: A higher proportion of IEDs on the board will significantly increase cash holdings.
Such effects are expected to be stronger for “complex” firms.
If managers’ use of cash reserves is poorly monitored, then these holdings are likely to be used
by managers to pursue unnecessary investments (Jensen and Meckling, 1976), to conduct mergers and
acquisition and build business empires (Moeller et al, 2005), or simply to increase spending on perks
(Yermack, 2006). All these would result in lower cash holdings than the optimal amount. Consistent
with this “agency view”, Dittmar and Mahrt-Smith (2007) find that firms with poor corporate
governance dissipate cash quickly in ways that significantly reduce operating performance. Harford et
al. (2008) find that firms with weaker governance, as indicated by low insider ownership and weaker
shareholder rights (a high G-index), are associated with lower cash holdings. On the other hand, firms
with strong governance would permit a larger buildup of cash to allow rapid investment as profitable
knowledge of firm operations can closely monitor both the buildup and use of cash reserves, limiting
the misuse of funds.
Harford et al. (2008) find that board independence is not significantly correlated with cash
holdings. We argue that IEDs are in a better position than INEDs to monitor cash holdings because
their industry expertise will allow them to prevent value-destroying acquisitions and capital
expenditures, and keep sufficient cash within the firms so that profitable investment opportunities will
not be missed. These effects may not be uniform across firms. Coles et al. (2008) argue that
“complex” firms have more advising and monitoring needs than “simple” firms, and thus may require
different features of boards (different board sizes in their paper). We hypothesize that the effects of
IEDs on cash holdings are stronger for “complex” firms than for “simple” firms.
Hypothesis 4: The presence of IEDs increases CEO-pay-performance sensitivity for “complex” firms.
Chhaochharia and Grinstein (2009) estimate that CEO pay decreases 17% more in firms that
were not compliant with the recent NYSE/NASDAQ board independence requirement than in firms
that were compliant. These results suggest that more independent boards tend to lower CEO
compensation. However, these results have recently been challenged by Gutherie, et al. (forthcoming),
who find that the compensation committee independence requirement actually increases CEO total
pay. Conyon and Peck (1998) show that in the UK, when the proportion of outside directors on the
board reaches at least 40%, CEO compensation is significantly and positively correlated with the
firm’s stock return.
Different from Chhaochharia and Grinstein (2009) and Gutherie et al. (forthcoming), but
sensitivity. We choose to focus on CEO pay performance sensitivity instead of the level of CEO
compensation because, as Hermalin (2005) shows, a rise in board independence may increase the
intensity of monitoring and decrease the CEO’s job security. As a result, in equilibrium, a CEO may
receive higher compensation to reflect the higher risk of dismissal. Second, although the level of CEO
compensation captures the agency costs of CEOs to some degree, higher pay-performance sensitivity
may be more effective in aligning the incentives of CEOs with shareholder value.
Hypothesis 5: The presence of IEDs increases the probability of CEO turnover following poor firm
performance.
The effects of independent directors on CEO turnover following poor firm performance seem
to be mixed. On the one hand, Weisbach (1988) reports that there is a stronger association between
prior performance and the probability of a resignation for companies with outsider-dominated boards
than for companies with insider-dominated boards. Laux (2008) develops a theoretical model that
predicts that the trend toward greater board independence is associated with subsequent trends toward
higher CEO turnover. Jenter and Lewellen (2010) find that boards aggressively fire CEOs for poor
performance, and that the turnover-performance sensitivity increases substantially with board quality.
However, Jenter and Kannan (forthcoming) find that in their sample of 1,627 CEO turnovers between
1993 and 2001, CEOs are significantly more likely to be dismissed due to bad industry or market
returns, instead of bad firm-specific (industry-adjusted) return.
Motivated by the above studies, we hypothesize that the industry experience of IEDs enables
industry. As a result, IEDs can make CEO turnovers more highly correlated with firm performance
that is below the industry median performance.
Hypothesis 6: Distinct from independent directors, IEDs can better evaluate and implement
innovative projects, leading to increased firm innovation.
Innovative activities such as new product development and R&D investments are
characterized by high riskiness and long-term time horizons, and their short-term gains often tend to
be quite limited. These characteristics make innovative projects hard to evaluate. With industry
experience, IEDs may be in a better position to evaluate and implement those projects. For example,
INEDs, because of their lack of understanding of the nature of the industry, may tend to reward the
CEO only on the basis of short-term financial performance of the firm, but such practice may result in
“skewing the direction of managerial effort away from the optimally, risky strategies that many
shareholders prefer” (Baysinger and Hoskisson, 1990). IEDs, on the other hand, may have longer time
horizons, be able to pick the most promising innovative projects, and create proper incentives for the
CEO to undertake those risky projects.
Hypothesis 7. Powerful CEOs tend to avoid IEDs on the board.
It has long been recognized that CEOs have strong influence on the selection of board
members. Generally, CEOs attempt to reduce pressure from active monitoring by reducing board
independence (Hermalin and Weisbach, 1998). For example, Shivdasani and Yermack (1999) show
appoint fewer independent outside directors and more gray outsiders with conflicts of interest. Stock
price reactions to independent director appointments are significantly lower when the CEO is involved
in director selection. Fracassi and Tate (2012) find that firms with more powerful CEOs are more
likely to appoint directors with social ties to the CEO. We hypothesize that CEO power has a negative
and significant impact on the presence of IEDs on the board.
The current literature has well documented the influence of powerful CEOs on board selection
and decisions. For example, Westphal and Zajac (1995) find that when incumbent CEOs are more
powerful than their boards of directors, new directors are likely to be demographically similar to the
firm’s CEO, and greater demographic similarity between the CEO and the board is likely to result in
more generous CEO compensation contracts. Ryan and Wiggins (2004) find that, as the tenure of a
CEO grows, the CEO pay-equity performance sensitivity decreases. Morse et al. (2011) find that
powerful CEOs induce boards to shift the weight on firm performance measures toward the better
performing measures, thereby rigging CEO incentive pay. In a similar vein, we hypothesize that
powerful CEOs would avoid IEDs because with their industry-specific knowledge, they may be able
to monitor CEOs more intensely. For example, as Hypothesis 5 states, they may increase the CEO-pay
performance sensitivity, and also make it more difficult for the CEO to “rig the incentive pay.”
3. Data and Results
3.1. Data
Our sample consists of S&P 1500 firms between 2000 and 2008. Data on board directors’
industry experience are from BoardEx database. We carefully go through the employment history
section of BoardEx database and match-merge with Compustat Global to find out the industry
56,000 publicly traded companies in 112 countries, representing 98% of the world's market
capitalization. All financial data are from Compustat, and all stock return data are from CRSP.
Following the literature, we drop finance and regulated utilities industries.
Insert Figure 1 and Table 2 here
Figure 1 illustrates that the average proportion of independent directors has steadily risen
during our sample period, as firms attempted to comply with the new legal and regulatory requirement
on board independence. It is interesting to notice that the steady rise in the independence ratio mainly
came from the increase in the average proportion of IEDs (independent directors with industry
experience) on a board, while the average proportion of INEDs (independent directors with no
industry experience) on a board stays roughly constant after 2003. The proportion of IEDs more than
doubled between 2000 (14%) and 2008 (29%), while the proportion of INEDs only increased by about
26% between 2000 (38%) and 2008 (48%). Table 2 reports the summary statistics for the full sample
in our subsequent regression analysis.
3.2. The determinants of IEDs
Insert Table 3 here
Table 3 reports the results when we examine the determinants of IEDs. Knyazeva et al. (2011)
find that firms located near larger pools of prospective directors have a higher proportion of
independent directors on their boards. Inspired by Knyazeva et al. (2011), we use the number of firms
in the same industry in the neighborhood (defined as the first 3 digits of the ZIP code) as an
exogenous determinant of IEDs. To alleviate the concern regarding the direct competition between
firms in the same industry, we only count firms in the same 2-digit SIC industry but not in the same
relatively stable (the relocation of firm headquarters is rare), our measure is arguably a valid
exogenous determinant of IEDs. Model 1 and Model 4 confirm our conjecture that the number of
neighboring firms in the same industry is positively and significantly correlated with the presence of
IED (Model 1) and proportion of the IEDs (Model 4) on a board.
To differentiate between “complex” firms and “simple” firms, we split our sample into a
subsample consisting of firms with positive R&D expenditure, and a subsample consisting of firms
with zero R&D expenditure. Models 2, 3, 5 and 6 show that for “complex” firms, the number of
neighboring firms in the industry is significantly and positively correlated with the presence of IED
(Model 2) and the proportion of IEDs (Model 5) on a board, but these results no longer hold when we
examine “simple” firms. Also, we find that for the full sample as well as for “complex” firms,
R&D/Sales is positively and significantly correlated with both the presence of IED and the proportion
of IEDs on a board. On the other hand, when CEO and board chairman are the same person
(“CEO-chair duality”), both the likelihood of having at least one IED and the actual proportion of IEDs on the
board is significantly lower. This is consistent with Hypothesis 7 that more powerful CEOs can more
easily avoid IEDs so that he/she can capture the board.
3.3. The impact of IEDs on firm performance
Insert Table 4 here
When we estimate the impact of IEDs on firm performance, to tackle the endogeneity issue
caused by sample selection, we employ a Heckman (1979) two-step procedure. The first-stage
estimation results are reported in Table 3, and the second-stage estimation results are reported in Table
4A. Table 4A shows that the proportion of IEDs on a board is positively and significantly correlated
hold when we examine firms with positive R&D but do not hold when we examine firms with zero
R&D. These results are consistent with Hypothesis 1 and seem to echo Mr. Pozen’s comment on
Citigroup’s board in 2008. With only one independent director who had ever worked in the financial
services industry, the board was unable to prevent Citigroup from making suboptimal corporate
decisions leading to poor firm performance.
In our regression equations, most control variables have the expected signs. For example,
R&D/Sales and Capital Expenditures/Sales both are positively and significantly correlated with firm
performance. The number of business segments is negatively and significantly correlated with firm
performance, which is consistent with some evidence of “diversification discount” reported in the
literature, such as in Stow and Xing (2006). Board size is negatively and significantly correlated with
firm performance, which is consistent with Yermack (1996). For robustness check, we also use the
number of neighboring firms in the same industry as the instrumental variable to estimate 2SLS
regressions. The results are qualitatively similar to our results from Heckman two-step estimations.
We also run simple OLS regressions, and the results are qualitatively similar.
To test whether the effects of IEDs on firm performance depends on information costs, we
merge our data with IBES database. We measure the information costs by the standard deviation of
analyst forecast and the number of analysts following the company’s stock (both measures are taken
within 30 days before the earnings announcements). Specifically, based on the standard deviation of
analyst forecast, we split our sample into two subsamples: a subsample with “more dispersion” of
analyst forecast if the standard deviations of analyst forecast are above the median standard deviation
in the sample, and the other subsample with “less dispersion” of analyst forecast. Based on the number
number of analysts following the company’s stock is above the median number in the sample, and the
other subsample with “fewer analysts.”
Table 4B reports the results of distinguishing firms by transparency. Models 1 and 4 show that
when firm information costs are higher, IEDs make significant positive contributions to firm
performance. Models 2 and 5 show that when firm information costs are lower, IEDs do not make
significant contributions to firm performance. Model 3 shows that, when we measure information
costs by the standard deviation of analyst forecast, for firms with higher information costs, IEDs make
positive and significant contributions to firm performance, but INEDs do not make significant
contributions. These results lend support to our hypothesis that for firms with higher information costs,
IEDs play more important roles in mitigating information asymmetries between managers and
shareholders.
3.4. The impact of IEDs on earnings restatements
Insert Table 5 here
To examine the effects of IEDs on earnings restatements, we merge our data with GAO
(Government Accountability Office) financial restatement database, which records 1,390 restatement
announcements between July 1, 2002 and September 30, 2005. Table 5 shows, for the full sample, that
the higher the proportion of IEDs on a board, the less likely a firm would restate its earnings (Model 1
and Model 4). However, the proportion of INEDs on the board is not significantly correlated with the
probability of earnings restatement (Model 4). To examine how CEO entrenchment influences the
effects of IEDs on earnings restatements, we split our full sample into two subsamples: firms in the
first subsample are characterized by values of E-index (Bebchuk et al., 2009) below the median
median (E-index>=3). For the first subsample, CEOs are less entrenched, and we find that IEDs can
effectively deter earnings restatements. However, for the second subsample, CEOs are more
entrenched, and we find IEDs can no longer effectively deter earnings restatements. These results
suggest that more entrenched CEOs tend to lower the effectiveness of the monitoring function of IEDs,
which is consistent with Hypothesis 7.
3.5. The impact of IEDs on cash holdings
Insert Table 6 here
In Table 6, we report that, for the full sample, the proportion of IEDs on the board is positively
and significantly correlated with cash holdings, measured by ln(cash holdings/sales+1) (Model 1 and
Model 4). On the other hand, the proportion of INEDs on the board is not significantly correlated with
cash holdings (Model 6). To examine the effects of IEDs on cash holdings in “simple” versus
“complex” firms, we split our sample into firms with positive R&D and firms with zero R&D, and
find that the results for the full sample still hold for firms with positive R&D, but not for firms with
zero R&D (Models 2, 3, 5 and 6). These results are consistent with Hypothesis 3 and show that IEDs
can effectively monitor the cash holdings of firms.
3.6.The impact of IEDs on CEO pay-performance sensitivity
To test Hypothesis 4, we merge our data with ExecuComp database. Similar to Conyon
and Peck (1998), we split our sample into two subsamples: firms with at least one IED on the
boards, and firms without any IED on the boards. We examine the CEO pay-performance
sensitivity for these two subsamples, respectively. We measure CEO compensation by ln(Total
and Grinstein (2009), we measure firm performance by its stock return in year (t-1). We do not
use industry-adjusted stock return to measure firm performance because as Jenter and Kanaan
(forthcoming) show, firms do set CEO pay on the basis of absolute stock return instead of relative
stock return.
Insert Table 7 here
Table 7 shows that for firms with at least one IED on the board, CEO pay is significantly
and positively correlated with its stock return (Model 1) and industry-median-adjusted stock
return (Model 3), while for firms with no IED on their boards, CEO pay is not significantly
correlated with its stock return (Model 2) or industry-median-adjusted stock return (Model 4).
These results support Hypothesis 4. It is interesting to notice that even for firms with at least one
IED on their boards, CEO-Board Chairman duality has positive and significant effects on CEO
total pay, suggesting that the influence of CEO power still effectively boosts CEO compensation,
despite the presence of IEDs on their boards.
3.7.The impact of IEDs on CEO turnover-performance sensitivity
To test Hypothesis 5, we infer CEO turnovers from the identities of CEOs recorded in
ExecuComp database. We include all CEO turnovers instead of just “forced” turnovers. This is
because Jenter and Lewellen (2010) used several algorithms, including the popular classification
scheme proposed by Parrino (1997), to classify turnovers into “voluntary” and “forced” turnovers, and
found that supposedly “voluntary” turnovers are substantially more likely to occur after bad
performance. Based on this result, they conclude that “many of these turnovers would not have
turnovers as voluntary creates a large downward bias in the estimated turnover-performance
sensitivities.”
In view of Jenter and Lewellen’s (2010) critique of “forced” turnovers, and following Bebchuk
et al. (2011), we examine all CEO turnovers instead of just “forced” turnovers. We acknowledge that
some turnovers may be voluntary. For example, the CEO may reach the retirement age and voluntarily
step down. To control for the retirement effect, following Goyal and Park (2002), we include a
dummy variable that equals one if the CEO is between 62 and 66 years old, and 0 otherwise. We also
divide the CEO tenure into three segments: less than 3 years, 3 to 5 years, more than 5 years but less
than 13 years. Bebchuk et al. (2011), who show that when CEO tenure is less than 3 years, the CEO is
significantly more likely to be dismissed. Jenter and Lewellen (2010) find that “[i]n the first five years
of tenure, CEOs who perform in the bottom quintile are 42 percentage points more likely to depart
than CEOs in the top quintile.” Brookman and Thistle (2009) show that the “risk of termination
increases for about thirteen years before decreasing slightly with CEO tenure.” Therefore, we include
three dummy variables corresponding to three segments of CEO tenure, and interact them with the
firm’s stock return.
Insert Table 8 here
Table 8 shows that, for firms with positive R&D expenditure, the presence of IED on the board
significantly increases the probability that a CEO will be dismissed following poor industry-median
adjusted stock return. These results support Hypothesis 5. The dummy variable “CEO age between 62
and 66” is significantly and positively correlated with CEO turnover, which shows that this variable
captures voluntary turnovers to some extent. It is interesting to note that CEO-board chairman duality
significantly reduces the likelihood of CEO turnover, which is consistent with the results reported in
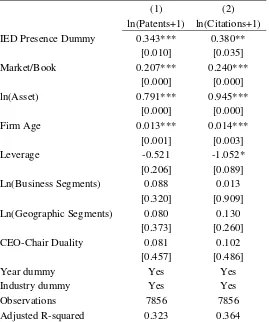
3.8. The impact of IEDs on firm innovation
Insert Table 9 here
To test Hypothesis 6, we merge our data with U.S. patent data from the National Bureau of
Economic Research (NBER) Patents File (Hall, et al., 2001). NBER documents patents and citations
filed by firms in the US between 1976 and 2006. In view of the fact that the number of patents and
citations are censored at 0, we estimate Tobit models. Table 9 shows that firms with at least one IED
on the board successfully file for significantly more patents and those patents receive significantly
more citations. These results support Hypothesis 6 and show that IEDs can better help firms innovate,
which leads to higher firm value, as Table 4 shows.
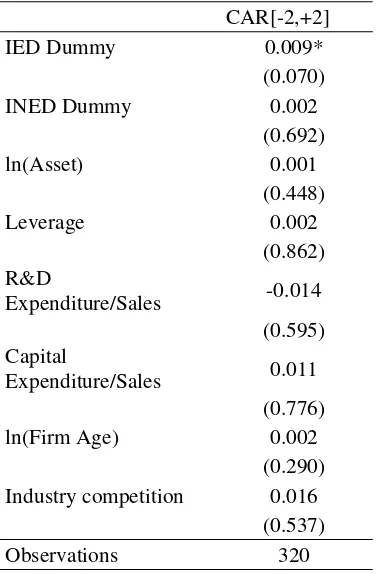
3.9. The market reactions to the appointments of IEDs
In the Introduction section of the paper, we presented a case study of the strongly positive
market reactions to the appointment of IEDs to the board of Bank of America. To see if such a pattern
holds for a larger sample, we collect announcements of IEDs from BoardEx database. After tackling
the contamination effect by checking the announcements with other major corporate announcements
such as earnings and mergers and acquisitions, we are left with 334 announcements of directors,
including 66 announcements of IED appointments, 208 announcements of INED appointments, and
60 announcements of inside director appointments.
Insert Table 10 here
In panel A of Table 10, we report event study results. The mean and median cumulative
abnormal returns over the event window [-2, +2] are significantly positive for IED appointments, but
multivariate regression results, which show that even after controlling for other firm characteristics,
IED appointments still have significantly higher average abnormal returns than INED or inside
director appointments.
3.10. CEO power, IED presence and firm value
To test Hypothesis 7, we use Principal Component Analysis to derive indexes of CEO power.
To construct CEO power index 1, we aggregate the CEO-chair duality, CEO ownership of the firm,
the natural logarithm of CEO tenure, the CEO entrenchment index (Bebchuk et al, 2009), the ratio of
the CEO compensation over the compensation of the second-highest paid executive. We find that the
coefficients for CEO duality, CEO ownership, CEO tenure, and E-index have expected signs (positive
for the first three, and negative for the last one), but the coefficient on the relative compensation ratio
has a negative sign, which suggests that we may drop relative compensation for robustness check. We
then drop relative compensation and compute CEO power index 2. Similar to Morse et al. (2011), we
use a dummy variable to indicate firms with the same person serving as the CEO, board chairman and
company president. As Morse et al. (2011) argue, when the CEO and the board chairman is the same
person, the CEO can direct board initiatives. When the CEO-chairman also serves as the company
president, the board will not be able to have an in-training successor whom they may resort to if they
disagree with CEOs.
We aggregate the CEO-chair-president dummy with CEO ownership, E-index, and ln(CEO
tenure) to get CEO power index 2. In our Principal Component Analysis for this index, all coefficients
on the variables have expected signs. Data on CEO ownership, Chairman duality, and
CEO-Chairman-President dummy are from RiskMetrics, executive compensation and CEO tenure data are
Insert Figure 2 and Table 11 here
Figure 2 reports that both CEO power indexes indicate a sharp decline in CEO power between
2003 and 2006/2007, and a rise of CEO power towards the end of our sample period. The sharp
decline in CEO power coincided with the rise in IED ratio on the board. Table 11 reports the
Heckman 2-step results. Models 1 and 3 show that CEO power is negatively and significantly
correlated with the presence of IEDs on the board, which lends support to Hypothesis 7. These results
are consistent with casual observation. For example, Pollock (2009) reports that a very successful
retired CEO of a Fortune 100 company said, “[y]es, from the point of view of the CEO, the ideal
board is 100 percent independent directors except for the CEO. That’s the board I’d like to have! I’d
be the only one who actually knows anything, and I’d be able to do whatever I want.”
3.11. Relationship between IEDs and institutional ownership
Together with IEDs, we have considered the impact of institutional ownership. Similar to
Chhaochharia and Grinstein (2009), we find that for firms with lower institutional ownership
concentration (i.e., the total ownership of the top 5 institutional investors is in the bottom quartile), the
fraction of IEDs on the board has positive and significant impact on firm performance, but for firms
with higher institutional ownership concentration (i.e., the total ownership of the top 5 institutional
investors is in the top quartile), the fraction of IEDs on the board has no significant impact. These
results suggest that IEDs and institutional ownership appear to be substitutes in corporate governance.
4. Conclusion
Conventional wisdom holds that a higher proportion of independent directors on a corporate
compared with insider directors, independent directors will have fewer conflicts of interest with
corporate executives. As a result, they may better align their interests with shareholders’ interests, and
more effectively monitor and advise CEOs to maximize shareholder value. This “conventional
wisdom” was the foundation of a series of legal and regulatory changes aiming at strengthening
corporate governance practices in the US in the first decade of the 21st century.
However, this “conventional wisdom” is not supported by empirical evidence. Researchers
have not found a robust correlation between the proportion of independent directors on a board and
major corporate decisions as well as firm performance. We argue that for an independent director to
effectively perform her monitoring and advising roles, she not only needs to be independent, but also
needs to have sufficient knowledge and information about the industry and the firm. We hypothesize
that IEDs (independent expert directors), i.e., independent directors with industry experience, make
significant contributions to firm performance by making better corporate decisions. On the other hand,
INEDS (independent non-expert directors), i.e., independent directors without industry experience,
despite being independent from the influence of CEOs, may not be able to make significant
contributions.
To test this hypothesis, we use newly available data on the full employment history of
directors from the BoardEx database, which covers all directors of S&P 1,500 firms between 2000 and
2008. We carefully merge this database with CompuStat, CRSP, GAO financial restatement database
and US patent database. We find that the proportion of IEDs on a board is positively and significantly
correlated with firm performance, but the proportion of INEDs on a board is not significantly
correlated with firm performance. IEDs make significant and positive contributions to firm
performance when the information costs are higher, but not when the information costs are lower.
We further investigate how IEDs influence firm performance by affecting major corporate
decisions. We find that a higher proportion of IEDs is associated with significantly less earnings
restatements, especially for firms where the CEOs are less entrenched. A higher proportion of IEDs is
positively correlated with cash holdings, especially for firms with positive R&D expenditure. When a
board has at least one IED, CEO pay is significantly correlated with stock return, while when a board
has no IED, CEO pay is insensitive to stock return. For firms with positive R&D expenditure, the
presence of IED also significantly increases the probability that a CEO will be dismissed following
poor performance, as measured by the firm’s stock return. Such effects vanish for firms with zero
R&D expenditure. We find that when a firm’s board has IED, the firm successfully files more patents,
and the patents also receive more citations. To estimate the market reactions to the appointments of
IEDs, INEDs, and inside directors, we conduct an event study. Our event study results show that
market reactions to IED appointments are positive and significant, but market reactions to INED and
inside director appointments are insignificantly different from zero.
In summary, our results show that IEDs boost firm performance by improving major corporate
decisions such as earnings management, cash holdings, CEO pay, CEO turnover, and innovative
projects. Our evidence suggests that IEDs have both the incentives and the industry-specific
knowledge to more effectively monitor and advise CEOs than INEDs. What is the preference of CEOs
regarding the appointments of IEDs versus INEDs? We show that more powerful CEOs tend to avoid
IEDs. This is likely due to the fact that even though CEOs may like the improved firm performance
due to better advising of IEDs, they do not like the increase in the monitoring intensity associated with
the appointments of IEDs. Our evidence shows that on average, the latter effect seems to dominate the
We feel that current research on board directors seems to focus more on their incentives than
on their ability and information. As a result, the independence of directors seems to have received
much more attention than the qualifications of directors. We hope that our research can highlight the
REFERENCES
Adams, R., 2011. “Governance and financial crisis.” International Review of Finance, special
issue on bank governance and the financial crisis.
Adams, R., Ferreira, D., 2007. “A theory of friendly boards.” Journal of Finance 62, 217-250.
Adams, R., Hermalin, B., Weisbach, M., 2010. “The role of boards of directors in corporate
governance: a conceptual framework and survey.” Journal of Economic Literature 48,
58-107.
Agrawal, A., Chadha, S., 2005. “Corporate governance and accounting scandals.” Journal of Law
and Economics 48, 371-406.
Bebchuk, L, Cremers,K., Peyer, U., 2011. “The CEO pay slice.” Journal of Financial Economics
102, 199-221.
Bhagat, S., Black, B., 2001. “The non-correlation between board independence and long-term
firm performance.” Journal of Corporate Lawyer 27, 231-248.
Bhagat, S., Bolton, B., 2008. “Corporate governance and firm performance.” Journal of Corporate
Finance 14, 264-269.
Baysinger, B. D.,Hoskisson, R. E., 1990. “The composition of board of directors and strategic
control: Effects on corporate strategy.” Academy of Management Review 15, 72-87.
Brookman, J., Thistle, P., 2009. “CEO tenure, the risk of termination and firm value.” Journal of
Corporate Finance 15, 331-344.
Chen, Q., Goldstein, I., Jiang, W., 2007. “Price informativeness and investment sensitivity to
stock price.” Review of Financial Studies 20, 619-650.
Chhaochharia, V., Grinstein, Y., 2007. “Corporate governance and firm value: The impact of the
Chhaochharia, V., Grinstein, Y., 2009. “CEO compensation and board structure.” Journal of
Finance 64, 231-261.
Coles, J. L., Daniel, N.D., Naveen, L., 2008. “Boards: Does one size fit all?” Journal of Financial
Economics 87, 329-356.
Conyon, M.,Peck, S.,1998. “Board control, remuneration committees, and top management
compensation.” Academy of Management Journal 41, 146-157.
Dass, N., Kini, O., Nanda, V., Onal, B., Wang, J., 2011. “Board expertise: Do directors from
related industries help bridge the information gap?” Working paper.
Dittmar, A., Mahrt-Smith, J. 2007. “Corporate governance and the value of cash holdings.”
Journal of Financial Economics 83, 599-634.
Duchin, R., Matsusaka, J., Ozbas, O., 2010. “When are outside directors effective?” Journal of
Financial Economics 96, 195-214.
Faleye, O., Hoitash, R., Hoitash, U. 2011. “The costs of intense board monitoring.” Journal of
Financial Economics 101, 160-181.
Fracassi, C. Tate, G., 2012. “External networking and internal firm governance.” Journal of
Finance 67, 153-194.
Guner, A. B., Malmendier, U., Tate, G., 2008. “Financial expertise of directors.” Journal of
Financial Economics 88, 323-354.
Guthrie, K, Sokolowsky, J., Wan, K., forthcoming. “CEO compensation and board structure
revisited.” Journal of Finance.
Harford, J., Mansi, S., Maxwell, W.,2008. “Corporate governance and firm cash holdings in the
Harris,M., Raviv, A., 2008. “A theory of board control and size.” Review of Financial Studies 21,
1797-1832.
Heckman, J., 1979. “Sample selection bias as a specification error.” Econometrica 47, 153-161.
Hermalin, B. E., 2005. “Trends in corporate governance.” Journal of Finance 60, 2351-84.
Hermalin, B. E.,Weisbach, M.S., 1998. “Endogenously chosen boards of directors and their
monitoring of the CEO.” American Economic Review 88, 96-118.
Hermalin, B.,Weisbach, M., 2003. “Boards of directors as an endogenously determined institution:
a survey of the economic literature.” Economic Policy Review 9, 7-26.
Hwang, B. H., Kim, S., 2009. “It pays to have friends.” Journal of Financial Economics 93,
138-158.
Jensen, M. C., Meckling, W. H., 1976. “Theory of the firm: managerial behavior, agency costs
and ownership structure.” Journal of Financial Economics 3, 305–360.
Jenter, D., Lewellen, K., 2010. “Performance-induced CEO tunover.” Working paper.
Jenter, D., Kanaan, F., forthcoming. “CEO turnover and relative performance evaluation.” Journal
of Finance.
Knyazeva, A., Knyazeva,D., Masulis, R., 2011. “Effects of local director markets on corporate
boards.” Working paper.
Knyazeva, A., Knyazeva, D., Raheja, C., 2009. “Heterogeneity in expertise and incentives of
board members.” Working paper.
Kor, Y. Y., Misangyi, V. F., 2008. “Outside directors’ industry-specific experience and firms’
liability of newness.” Strategic Management Journal 29, 1345-1355.
Kroszner, R. S., Strahan. P.E., 2001. “Bankers on boards: Monitoring, conflicts of interest, and
Laux, V., 2008. “Board independence and CEO turnover.” Journal of Accounting Research 46,
137-171.
Mikkelson, W., Partch, M., 2003. “Do persistent large cash reserves hinder performance?” Journal
of Financial and Quantitative Analysis 38, 275-294.
Moeller, S., Schlingemann, F., Stulz, R., 2005. “Wealth destruction on a massive scale? A study
of acquiring-firm returns in the recent merger wave.” Journal of Finance 60, 757-782.
Pozen, Robert C., 2010. “The case for professional boards.” Harvard Business Review 15, 51-58.
Masulis, R.W., Mobbs, S., 2011. “Are all inside directors the same? Evidence from the external
directorship market.” Journal of Finance 66, 823-872.
Masulis, R. W., Wang, C., Xie, F. 2012. “Globalizing the Boardroom - The Effects of Foreign
Directors on Corporate Governance and Firm Performance.” Forthcoming, Journal of
Accounting and Economics.
McDonald, M. L., Westphal, J.D., Graebner, M.E., 2008. “What do they know? The effects of
director acquisition experience on firm acquisition performance.” Strategic Management
Journal 29, 1155-1177.
Morse, A., Nanda,V., Seru,A.2011. “Are incentive contracts rigged by powerful CEOs?” Journal
of Finance 66, 1779-1821.
Nguyen, B.D., Nielsen, K.M., 2010, “The value of Independent directors:Evidence from sudden
deaths.” Journal of Financial Economics 98, 550-567.
Opler,T.,Pinkowitz, L, Stulz, R., Williamson, R. 1999. “The determinants and implications of
corporate cash holdings.” Journal of Financial Economics 52, 3-46.
Parrino, R., 1997. “CEO turnover and outside succession: a cross-sectional analysis.” Journal of
Pollock, A. J., 2009. “Sarbanes-Oxley in the light of the financial crisis.” American Enterprise
Institute Regulation Outlook, November, 1-4.
Ravina, E., Sapienza, P., 2010. “What do independent directors know? Evidence from their
trading.” Review of Financial Studies 23, 962-1003.
Ryan, H. E., Jr., Wiggins R.A, III, 2004. “Who is in whose pocket? Director compensation, board
independence, and barriers to effective monitoring.” Journal of Financial Economics 73,
497-524.
Stow, J. and Xing, X., 2006. “Can growth opportunities explain the diversification discount?”
Journal of Corporate Finance 12, 783-796.
Weisbach, M. S., 1988. “Outside directors and CEO turnover.” Journal of Financial Economics 20,
431-460.
Yermack, D., 2006. “Flights of fancy: corporate jets, CEO perquisites, and inferior shareholder
Table 1
Markets Reaction to Bank of America’s Replacement of Two Outside Directors without Banking Industry Experience with Four Outside Directors
with Banking Industry Experience on June 5, 2009
This table reports the CARs for Bank of America’s announcement of replacement of two outside directors without banking industry experience with four outside directors with banking industry experience. The market model is estimated using the value-weighted CRSP index as a proxy for the market returns over days [-210,-10]. The abnormal return is computed for each day in the event window by subtracting the expected return from the market model from the actual return.
Event window
Cumulative Abnormal Return (CAR)
[image:35.595.55.504.475.652.2](0,+1) 2.16% (-1,+1) 6.67% (-2,+2) 6.18%
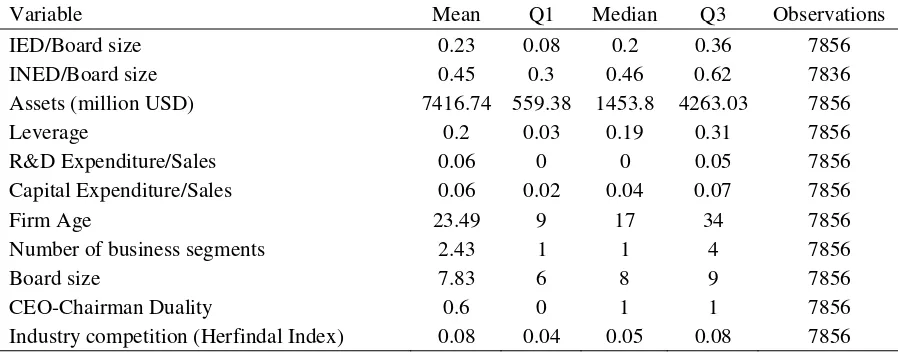
Table 2. Summary Statistics
The sample is a panel of S&P 1,500 companies between 2000-2008. Independent directors are classified as IED if they have worked in the same industry as the firm where they serve as directors.
Variable Mean Q1 Median Q3 Observations
IED/Board size 0.23 0.08 0.2 0.36 7856
INED/Board size 0.45 0.3 0.46 0.62 7836
Assets (million USD) 7416.74 559.38 1453.8 4263.03 7856
Leverage 0.2 0.03 0.19 0.31 7856
R&D Expenditure/Sales 0.06 0 0 0.05 7856
Capital Expenditure/Sales 0.06 0.02 0.04 0.07 7856
Firm Age 23.49 9 17 34 7856
Number of business segments 2.43 1 1 4 7856
Board size 7.83 6 8 9 7856
CEO-Chairman Duality 0.6 0 1 1 7856
Table 3. Determinants of IED
The sample is a panel of S&P 1,500 companies during 2000-2008. Independent directors are classified as IED if they have worked in the same industry as the firm where they serve as directors. Robust standard errors are estimated. P-values are reported in the brackets. ***, ** and * refer to significance at 1%, 5% and 10% levels, respectively.
Presence of IED (Probit Model) IED (%) (Tobit Model)
Model 1 Model 2 Model 3 Model 4 Model 5 Model 6
Full Positive Zero Full Positive Zero
Sample R&D R&D Sample R&D R&D
Number of Neighboring 0.008*** 0.025*** 0.001 0.001** 0.002* 0.001
Firms in the Same Industry [0.002] [0.000] [0.765] [0.036] [0.071] [0.315]
R&D/Sales 0.842*** 0.739*** 0.066*** 0.056***
[0.000] [0.000] [0.003] [0.003]
Ln(Assets) -0.011 0.029 -0.081*** -0.002 0.003 -0.010
[0.520] [0.230] [0.002] [0.660] [0.678] [0.213]
Leverage -0.095 -0.273 -0.044 -0.039 -0.014 -0.040
[0.407] [0.113] [0.797] [0.264] [0.762] [0.450]
Capital Expenditure/Sales 0.411 1.215 -0.025 -0.115 -0.169 -0.090
[0.310] [0.154] [0.959] [0.273] [0.354] [0.493]
Ln(Age) 0.011 -0.018 0.014 -0.020*** -0.017 -0.020*
[0.643] [0.610] [0.667] [0.009] [0.117] [0.053]
Number of -0.007 -0.008 0.001 -0.008**
-0.013*** 0.002
Business Segments [0.544] [0.643] [0.962] [0.014] [0.001] [0.755]
Ln(Board Size) 0.771*** 1.041*** 0.642*** 0.022 -0.006 0.047
[0.000] [0.000] [0.000] [0.323] [0.845] [0.126]
CEO-Chair Duality -0.096*** -0.017 -0.155*** -0.023** -0.033** -0.012
[0.010] [0.766] [0.00279] [0.024] [0.019] [0.413]
Industry Competition 1.214 -0.805 1.609 0.109 -0.308 0.221
[0.158] [0.692] [0.106] [0.478] [0.297] [0.219]
Industry fixed effects Yes Yes Yes Yes Yes Yes
Year fixed effects Yes Yes Yes Yes Yes Yes
Observations 7856 4210 3646 7856 4210 3646
Table 4A. Industry Experience of Independent Directors and Firm Performance
The sample is a panel of S&P 1,500 companies during 2000-2008. Independent directors are classified as IED if they have worked in the same industry as the firm where they serve as directors. This table reports the second stage results from the Heckman 2-step procedure. Robust standard errors clustered at firm level are estimated. P-values are reported in the brackets. ***, ** and * refer to significance at 1%, 5% and 10% levels, respectively.
Dependent variable: Industry-adjusted Ln(Market/Book)
Model 1 Model 2 Model 3 Model 4 Model 5 Model 6
Full Positive Zero Full Positive Zero
Sample R&D R&D Sample R&D R&D
IED/Board size 0.133*** 0.147*** 0.077 0.161*** 0.183*** 0.014
[0.001] [0.001] [0.171] [0.003] [0.005] [0.847]
INED/Board size 0.038 0.048 -0.090
[0.434] [0.432] [0.132]
Ln(Assets) 0.012* 0.034*** -0.041*** 0.012* 0.034*** -0.041***
[0.077] [0.000] [0.000] [0.078] [0.000] [0.000]
Leverage -0.427*** -0.422*** -0.409*** -0.429*** -0.424*** -0.402***
[0.000] [0.000] [0.000] [0.000] [0.000] [0.000] R&D Expenditure
/Sales 0.040* 0.035* 0.040* 0.036*
[0.095] [0.065] [0.089] [0.0603]
Capital
Expenditure/Sales 0.959*** 1.925*** 0.605*** 0.967*** 1.939*** 0.590***
[0.000] [0.000] [0.000] [0.000] [0] [0.000]
Ln(Firm Age) -0.037*** -0.053*** -0.021* -0.038*** -0.053*** -0.019*
[0.000] [0.000] [0.051] [0.000] [1.41e-06] [0.079]
Number of -0.032*** -0.041*** -0.024*** -0.032*** -0.041*** -0.024***
Business Segments [0.000] [0.000] [0.000] [0.000] [0] [0.000]
Ln(Board Size) -0.164*** -0.125*** -0.034 -0.167*** -0.130*** -0.029
[0.000] [0.007] [0.516] [0.000] [0.00519] [0.583]
CEO-Chair Duality 0.037** 0.012 0.047** 0.035** 0.009 0.052***
[0.017] [0.481] [0.014] [0.024] [0.591] [0.008]
Industry Competition -0.738* -0.687 -0.235 -0.736* -0.690 -0.248
[0.085] [0.339] [0.547] [0.085] [0.337] [0.528]
Lambda -0.591*** -0.312*** -0.213 -0.589*** -0.310*** -0.228 [0.000] [0.002] [0.128] [0.000] [0.00166] [0.104]
Industry fixed effects Yes Yes Yes Yes Yes Yes
Year fixed effects Yes Yes Yes Yes Yes Yes
Observations 7856 4210 3646 7856 4210 3646
Table 4B. Industry Experience of Independent Directors, Information Costs and Firm Performance
The sample is a panel of S&P 1,500 companies during 2000-2008. Independent directors are classified as IED if they have worked in the same industry as the firm where they serve as directors. This table reports the second stage results from the Heckman 2-step procedure. Robust standard errors clustered at firm level are estimated. P-values are reported in the brackets. ***, ** and * refer to significance at 1%, 5% and 10% levels, respectively.
Dependent variable: Industry-adjusted Ln(Market/Book)
Model 1 Model 2 Model 3 Model 4 Model 5 Model 6
More Less More Fewer More Fewer
Dispersion Dispersion Dispersion Analysts Analysts Analysts
IED/Board Size 0.112** 0.114 0.187*** 0.173*** 0.004 0.110
[0.016] [0.172] [0.005] [0.001] [0.948] [0.103]
INED/Board Size 0.094 -0.087
[0.115] [0.136]
Ln(Assets) 0.009 -0.006 0.009 -0.093*** -0.010 -0.092***
[0.220] [0.662] [0.231] [0.000] [0.391] [0.000]
Leverage -0.221*** -0.548*** -0.225*** -0.238***
-0.518*** -0.237***
[0.000] [0.000] [0.000] [0.000] [0.000] [0.000]
R&D
Expenditure/Sales 0.085*** 0.219 0.086*** 0.030 0.297** 0.029
[0.000] [0.347] [0.000] [0.202] [0.029] [0.218]
Capital
Expenditure/Sales 0.270 1.799*** 0.288* 0.732*** 0.606** 0.708***
[0.103] [0.000] [0.0818] [0.001] [0.023] [0.002]
Ln(Firm Age) -0.037*** 0.038* -0.038*** -0.049*** 0.023 -0.048***
[0.001] [0.061] [0.001] [0.000] [0.202] [0.000]
Number of -0.027*** -0.028*** -0.028*** -0.028***
-0.025*** -0.028***
Business Segments [0.000] [0.002] [0.000] [0.000] [0.000] [0.000]
Ln(Board Size) -0.087* -0.151** -0.095** -0.156*** -0.138** -0.145***
[0.068] [0.028] [0.046] [0.004] [0.016] [0.008]
CEO-Chair Duality 0.027 0.057* 0.022 0.098*** -0.017 0.101***
[0.101] [0.051] [0.191] [0.000] [0.491] [0.000]
Industry Competition -0.249 -0.799 -0.248 0.020 -1.611** 0.006
[0.599] [0.355] [0.600] [0.968] [0.034] [0.991]
Lambda -0.217** -0.763*** -0.215* -0.399***
-0.626*** -0.399***
[0.048] [0.000] [0.051] [0.001] [0.000] [0.001]
Industry fixed effects Yes Yes Yes Yes Yes Yes
Year fixed effects Yes Yes Yes Yes Yes Yes
Observations 3565 3679 3565 3655 3589 3655
Table 5. IED and Earnings Restatement
The sample is a panel of S&P 1,500 companies during 2002-2005. Independent directors are classified as IED if they have worked in the same industry as the firm where they serve as directors. This table reports the Logit model estimation results. Robust standard errors clustered at firm level are estimated. P-values are reported in the brackets. ***, ** and * refer to significance at 1%, 5% and 10% levels, respectively.
Dependent variable: Dummy=1 if Earnings Restatement Occurred (Logit Model)
Model 1 Model 2 Model 3 Model 4 Model 5 Model 6
Full Less
Entrenched
More
Entrenched Full
Less Entrenched
More Entrenched
Sample CEO CEO Sample CEO CEO
IED/Board size -1.817** -2.239** -0.848 -2.535*** -2.726*** -2.204
[0.020] [0.019] [0.446] [0.004] [0.008] [0.223]
INED/Board size -1.307 -0.895 -2.051
[0.119] [0.328] [0.382]
ROA -3.506** -3.626** -6.027* -3.464** -3.649** -5.744
[0.010] [0.022] [0.075] [0.010] [0.019] [0.115]
Ln(Assets) 0.013 0.144 -0.642*** 0.020 0.155 -0.624***
[0.917] [0.327] [0.004] [0.874] [0.298] [0.005]
Leverage 0.750 0.656 -0.603 0.784 0.683 -0.762
[0.234] [0.382] [0.504] [0.196] [0.346] [0.392]
R&D
Expenditure/Sales -0.144 -0.069 -4.520 -0.169 -0.089 -4.192
[0.672] [0.808] [0.253] [0.640] [0.763] [0.262]
CEO-Chair
Duality 0.045 0.249 -0.483 0.122 0.295 -0.351
[0.864] [0.432] [0.468] [0.637] [0.337] [0.629]
Ln(Firm Age) 0.054 0.120 -0.129 0.070 0.128 -0.104
[0.771] [0.579] [0.728] [0.709] [0.557] [0.769]
Ln(Board Size) 0.095 -0.274 1.640 0.191 -0.235 1.778
[0.867] [0.662] [0.191] [0.740] [0.714] [0.161]
Market-to-Book -0.367* -0.404** -0.280 -0.356* -0.397** -0.313
[0.058] [0.046] [0.666] [0.058] [0.044] [0.637]
Number of 0.084 -0.011 0.325** 0.100 0.000 0.363**
Business
Segments [0.269] [0.899] [0.032] [0.168] [1.000] [0.021]
Industry
Competition -28.043 -14.003 -103.447*** -25.029 -12.962 -94.108***
[0.213] [0.547] [0.003] [0.252] [0.551] [0.006]
Industry fixed
effect Yes Yes Yes Yes Yes Yes
Observations 3360 2177 705 3357 2174 705