ISSN Online: 1947-3818 ISSN Print: 1949-243X
Single Zone, Zero Dimensional Model of
Diesel Multiple-Injection
Ugochukwu Charles Ngwaka
1*, Chidebere Diyoke
1, Nnamdi Anosike
21Mechanical Engineering Department, Enugu State University of Science and Technology, Enugu, Nigeria 2Mechanical Engineering Department, Nnamdi Azikiwe University, Awka, Nigeria
Abstract
A detailed single zone, zero dimensional model of diesel multiple-injection system was developed from first principle, for compression, combustion and expansion processes for direct injection diesel engine. Equilibrium equation of Extended Zel-dolvich Mechanism (EZM) for NOx formation was incorporated to predict NOx emission. A different approach was assumed for the equilibrium temperature. An approach of using the average cycle temperature within NOx formation region was used in the EZM equilibrium equation. The model codes were implemented in MATLAB. This model is developed to investigate the effects of both single and mul-tiple-pulse fuel injection strategies on engine performance and NOx emissions. The results obtained from the model were validated with experimental data available in the literature. Results obtained showed that the use of average cycle temperature within the NOx formation temperature region could be useful in predicting NOx formation with reasonable degree of accuracy. Injection timing, mass ratio of in-jected fuel, and dwell between pulses have significant effects on the NOx emission and engine performance. The results also show that as the number of pulses increas-es, NOx emission and engine performance decrease. For optimal balance between NOx and engine performance, mass of the pilot injection should be between 10 and 25% of the total mass of fuel used per cycle.
Keywords
Multiple Injection, Diesel Engine, Emission
1. Introduction
There have been steadily growing concerns on the use of diesel-powered engines be-cause of its emissions [1], despite its excellent thermodynamic efficiency and fuel
con-How to cite this paper: Ngwaka, U.C., Di-yoke, C. and Anosike, N. (2016) Single Zone, Zero Dimensional Model of Diesel Multiple- Injection. Energy and Power Engineering, 8, 297-312.
http://dx.doi.org/10.4236/epe.2016.89028
Received: July 31, 2016 Accepted: September 3, 2016 Published: September 6, 2016
Copyright © 2016 by authors and Scientific Research Publishing Inc. This work is licensed under the Creative Commons Attribution International License (CC BY 4.0).
version to power compared to spark ignition engines [1]-[5]. The major challenge for the acceptance of diesel engines is solely on further reduction on its major emissions, which are oxides of nitrogen (NOx), unburned hydrocarbons (HC), carbon monoxide (CO) and particulate matter (PM) to meet the increasingly stringent environmental regulations. The use of particulate trap and catalytic converters currently is not adapted to meet the current tailpipe emissions regulations. Pollutants emitted from diesel- powered engines are detrimental to the human health and environment; efforts have gone into developing high efficiency and low emissions techniques [3] [4].
The diesel engine is a typical representation of compression ignition combustion process and it operates on a variable overall lean air-fuel ratio principle; the injected fuel has little time to mix with air before it auto-ignites; therefore, the air-fuel mixture is heterogeneous and consists of rich and lean mixture zones. The overall heterogene-ous mixture results in incomplete combustion and formation of soot and NOx. In a convectional diesel engine combustion process, part of the air-fuel mixture is premixed and burns stoichiometrically. The rest of the mixture forms rich-fuel region and high temperature flame region: because the time scale of mixture break-up, evaporation and diffusion is larger than the chemical time scale of mixing [6]. Generally, in the rich fuel region a large amount of soot is formed due to the absence of oxygen and the high temperature region favours NOx formation. Soot is oxidised under higher temperatures. Soot formation is enhanced under higher temperatures but not at the same rate as soot oxidation [7]. The in-cylinder combustion temperature of a convectional diesel engine is about 2700 K. NOx formation is temperature dependent; however, the rate of its for-mation is sensitive to temperature and increase exponentially with the reaction temper-ature [8].
Several ways are available for reducing the emissions from diesel engine combustion all based on the principle of exhaust gas after-treatment, blending of fuel or advanced fuel-injection strategy [5]. These technologies are applied side by side in some cases. Often it is seen as a better engineering practice not to produce emissions at all, rather than attempting to control it when it has been produced; however, the most proficient way of combating emission is at its source. A major challenge in reducing emission in diesel engine is the presence of NOx-soot trade-off; this condition exists, when an at-tempt made to reduce net soot formation inside the cylinder results to increase in NOx production and vice-versa[2] [5] [9]. In practical terms, advancing the time of injection or extending the ignition delay time will reduce soot production but enhance NOx production and retarding the time of injection or reducing the ignition delay time will enhance soot formation but reduce NOx production [7].
The aim of this work is to investigate the effects of different multiple-pulse fuel injec-tion strategies on diesel engine performance and NOx emissions.
2. Multiple-Pulse Injection
combustion and favours the formation of some pollutants and noise in diesel engine. Multiple-pulse injection is a means of splitting the total mass of injection into a number of pulses, starting the injection process earlier before top dead centre (BTDC) and spreading it through after top dead centre (ATDC) such as to achieve controllability of the combustion process. The objectives of multiple-pulse injection and its control are as follows [9]:
To attain homogenous fuel-air mixture before ignition occurs by extending the igni-tion delay time. This is achieved by commencing injecigni-tion earlier BTDC.
To control the width of the injection pulse such as to limit fuel spray penetration to ensure no spray impact on the cylinder liner.
To ensure control over the combustion temperature by promoting separate or joint combustion of different fuel pulse.
In a conventional diesel engine, premixed and diffusion combustion occur but a stoichiometric diffusion flame controls the whole combustion process [2] [10]-[12]. Multiple pulse injection strategy has been studied by different people as a means to en-hance the homogeneity of in-cylinder medium during prior to combustion.
Su et al. [10] experimentally investigated multi-pulse fuel injection and concluded that large advance of injection timing is an effective approach to the preparation of homogenous mixture and a combined combustion mode of premixed homogenous and lean diffusion combustion is a feasible means of achieving HCCI combustion [9]. In-vestigated the impact of multiple-pulse injection in the preparation of homogenous mixture, and conclude as follows: at low loads, multiple injection strategy allowed for the preparation of a near lean homogenous mixture before combustion thereby simul-taneously reducing soot and NOx formation without the use of EGR. At higher loads, it was able to achieve a homogenous mixture with EGR dilution. Pierpont et al.[13] in-vestigated experimentally and concluded that the mass fraction of pilot/first pulse is of great significance on soot and NOx emissions, and that optimum soot reduction is ob-tained when 50% of fuel injected per cycle is supplied in pilot pulse. Meloni et al. [14]
2.1. Effect of Multiple-Pulse Injection on Diesel Engine
Performance and Emissions
The pulses in multiple injection is most times categorised based on the time of injection with respect to crank angle degree (CAD). The pulses in multiple injection is most times categorised based on the time of injection with respect to crank angle degree (CAD). Pilot Injection: The effect of pilot injection is to reduce the ignition delay of the second or main injection therefore leaving time for the mixture to attain homo-geneity. Pilot injection also produces internal EGR gases to suppress NOx formation in the main fuel injection. As the quantity of pilot injection increases and the earlier the pilot injection timing is advanced, NOx emissions increased and soot emissions de-creased [7]. Main Injection: Main injection controls the combustion phase in multiple injections. The mass and injection timing of the main injection determines the perfor-mance and emission characteristics in multiple injection strategy. Advancing the injec-tion timing of main injecinjec-tion leads to high temperature combusinjec-tion and enhanced en-gine performance, its effect on emissions depends on other enen-gine variables as well. Post or After Injection: Post injection normally reduces soot emissions if imple-mented appropriately. [7] and [17] reported that late post injection can increase soot emissions substantially and post injection close to main injection can increase soot emission drastically.
2.2. Path to Emission Reduction
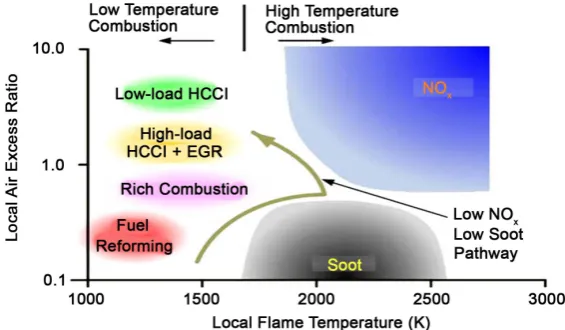
[image:4.595.231.514.522.687.2]High temperature enhances NOx and soot formation and increases soot, hydrocarbon and CO oxidation. NOx formation is also enhanced by excess air/lean mixture, there-fore the underlying mechanism to achieving low NOx in diesel engine combustion is maintain absence of high temperature region and appropriate equivalence ratio within the combustion chamber.
Figure 1 shows a pathway for simultaneous reduction in soot and NOx emission in diesel engine while Figure 2 depicts an ideal combustion region that escapes NOx, soot, CO and HC production zones.
Figure 2.Emission pathway for simultaneous reduction in NOx, soot, CO and HC production
zones [14].
3. Model Development and Description
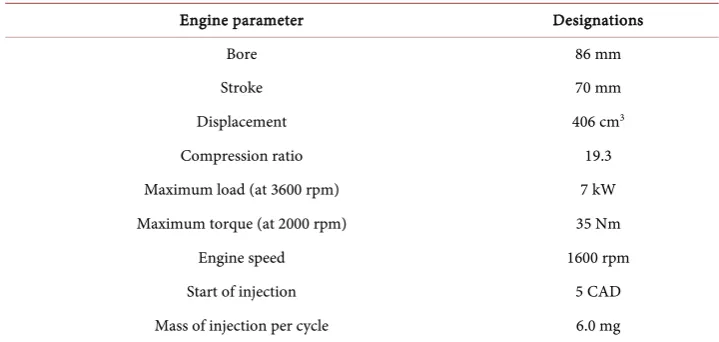
Table 1 shows the parameters of the single-cylinder air cooled four stroke diesel en-gine, direct injection combustion system used in the model.
3.1. Volume Model
Volume change is the main boundary condition applicable to reciprocating engine be-haviour. The change in volume (V) in a reciprocating engine is a periodic function, having time (t) and angular velocity (ω) as the independent variables or arguments across the cyclic process.
( )
,V = f
ω
t (1)( )
1(
1)
sin
2 1
s
c
V t V t
r
ω
= +
−
(2)
where rc is the compression ratio. In this model, the increment in volume is analysed using Equation (2) The engine speed (N) is taken to be constant in this model; as a re-sult, the Crank Angle Degree (CAD) at any given speed was derived as follows;
360 CAD
60
N t
= × (3)
3.2. Compression Process
The compression process adopted is modified form of Chang model [18]. The com-pression process is divided into two processes:
Compression without fuel injection.
Table 1. Test and modeled engine condition.
Engine parameter Designations
Bore 86 mm
Stroke 70 mm
Displacement 406 cm3
Compression ratio 19.3
Maximum load (at 3600 rpm) 7 kW Maximum torque (at 2000 rpm) 35 Nm
Engine speed 1600 rpm
Start of injection 5 CAD Mass of injection per cycle 6.0 mg
The actual compression process in diesel engine operation is non-adiabatic therefore; in this model, compression is taken to be a polytropic process.
In modelling for compression when there is no fuel injection, isentropic equations (laws) were used replacing the empirical isentropic index (k) with the polytropic index (n). From basic thermodynamic theories, it is known that the polytropic exponent (n) is a function of temperature, which is dependent on the variation on the amount of heat in the in-cylinder working medium [18].
1
w k
q k n
− =
− (4) During compression, (q) is heat and work (w) is done on the fluid therefore, w < 0. Also at the start of compression, the medium/fluid temperature is lower than the tem-perature of the encapsulating walls of the cylinder and the medium is heated. Equation (4) shows that n > k.
The temperature of the in-cylinder medium rises with increase in pressure during compression; the in-cylinder medium receives lesser amount of heat when compared with initial stage of compression until the medium temperature is equal to the temper-ature of the encapsulating walls of the cylinder. At this stage, there is no exchange of heat between the medium and the cylinder wall, adiabatic process occurs, and n = k. At further compression, the medium temperature would be greater than the cylinder wall temperature and heat will be transferred from the medium to the cylinder wall, at this point q < 0, and n < k this process will continue until combustion commences.
taking its boundary conditions as the thermodynamic variable due to polytropic com-pression at that same point or step.
3.3. Fuel Injection and Combustion
Dissociation level of the in-cylinder combustion products is small, and heat losses caused by this effect would be neglected. The first law of thermodynamics expressions were used in computing for the combustion process, the injection time and dwell be-tween subsequent injections are adjusted from the volume rate/CAD sub-model, but the number of injections and variation in the quantity of fuel injected is controlled in the combustion sub-model.
w
Q dU W Q
δ = +δ +δ (5)
where
δ
Q = heat loss or gain through the cylinder wall, W is work, Q is heat, U isin-ternal energy. In modelling for the combustion heat loss, assumption was made, that combustion occurs in a complete and absolute manner; therefore, the amount of un-burned fuel is small and can be neglected. The model took into account, the convective heat loss or heat gain prediction through the cylinder during compression and expan-sion process using a temperature wall function model [19]. This model is derived from the one-dimensional energy conservation equation and accounts for the effect of ther-modynamic variations of gas density and the increase of the turbulent Prandtl number in the boundary layer. The advantages of this model include the ability to use a relative smaller stepwise at the wall with accurate heat transfer predictions. Tw is the wall tem-perature. Hsu model [20] estimated the amount of heat loss during close cycle opera-tion to be less than 15% of the total heat input.
3.3.1. Expansion Process
The same processes that take place in compression are applicable to expansion process; Injection variables during expansion, that is, the number of injections and variation in the quantity of fuel injected is controlled in the combustion sub-model.
The variation of polytropic exponent during expansion is different from compression process; in the expansion process heat transfer occurs from the medium to cylinder walls all through the expansion process, w > 0 and q < 0. As the rate of heat exchange increases during combustion, the absolute value of the polytropic exponent would be lower [18]. At maximum pressure point n = 0. The heat release continues until the temperature approaches its maximum, which can be taken as an isothermal process, at this point n = 1. The quantity of the heat released during expansion is more than that of the absorbed heat during compression, therefore there would not be a time when ther-mal equilibrium will occur in the expansion process, and hence n < k all through the expansion process [18].
3.3.2. NOx Sub-Model
NOx formation in diesel engine is a dynamic process and is normally modeled with kinetic equations rather than with equilibrium equations [12]. But the choice to model a system with dynamic or equilibrium equation is dependent on the controlling chemi-cal reaction time constant, when the time constant is short compared to the change rate of the systems condition, the system can be modeled to be in equilibrium. In this case, the temperature and pressure are the system conditions. It will be an approximate me-thod to say that the time constant is short when compared to changes in temperature and pressure when combustion and NOx process is decoupled at maximum pressure and temperature. At the above condition (decoupling of combustion and NOx process), we can approximate the concentrations of nitrogen and oxygen by their equilibrium values [12]. The NOx formation rate equation and equilibrium constant used in this model are adopted from [12].
[ ]
[ ] [ ]
1 2 32 2
1 2 d NO
exp O N mol cm s
d e e
A B
t T T
= ⋅
(6)
16 6 10
A= × and B= −69090.
The equilibrium concentration of oxygen and nitrogen molecules is obtained from the following expression.
2 2
O +N 2NO (7)
[ ]
[ ] [ ]
2 2 2 NO O N e NO e eK = (8)
(
)
NO 20.3exp 21650
K = − T (9)
O2 and N2 molar concentrations of 0.21 and 0.79 mol/cm3 respectively were used in Equation (8) to determine the equilibrium concentration of O2 and N2, since the model does not make use of EGR and air intake is atmospheric. Simple assumption can be to calculate the peak thermodynamic temperature and relate it to NOx formation, but NOx formation takes place in the flame zone (combustion flame temperature), which cannot be a representative of peak average cycle temperature [20]. A close approximation to “combustion flame temperature” is to consider the whole cycle temperature history of the engine, when the whole cycle temperature is considered in stepwise terms. In actual combustion of diesel engine cycle, the average temperature at any point is a result of the initial mixture temperature of the portion of air-fuel mixture that combusted imme-diately afterwards [20]. Local flame temperature behaves in the same manner with the average cycle temperature; therefore, can be related to NOx formation.
high temperature [22] and from Equation (6). The resident time at the average-cycle NOx temperature range is calculated from the volume sub-model. The thermodynamic performance of the cylinder is derived from the plot of pressure-volume diagram.
Power C
W N
n
×
= (10)
2
c
n = number of engine revolutions per cycle for four-stroke engine and N, is the
engine speed in rev/sec.
4. Results
The strategy for the injection is to maintain the pilot/first injection at 5 CAD BTDC and vary the second injection at different CAD ATDC for the three varied mass frac-tion injecfrac-tion schemes. Exponential lines were used to plot for line of best fit for NOx scattered points, while linear lines of best fit are used for torque and exhaust tempera-ture-scattered points. Pulse injection tends to degrade the thermodynamic performance in compression ignition engines, NOx formation depends greatly on the equivalence ra-tio and temperature of the in-cylinder medium. The thermodynamic performance term is represented with the engine torque when comparing the simulated result and the ex-perimental data. The exhaust temperature and NOx emissions are also compared with experimental data. The experimental data is taken from [23]. The computational and experimental conditions of the engine used are presented in Table 1.
Two pulse injection strategy was adopted in response to what is available in the lite-rature, with constant amount of fuel for every engine cycle. The amount of fuel injected per cycle is 6 mg but the fuel splitting between pulses at three different conditions are as follows:
Case 1: 0.75 mg first injection, 5.25 mg second injection. Case 2: 1.5 mg first injection, 4.5 mg second injection.
Case 3: 3.0 mg first injection, 3.0 mg second injection.
The time between injections varied between 0.4 and 2 ms (about 22 CAD) at an en-gine speed of 1600 rpm.
4.1. NO
xPrediction
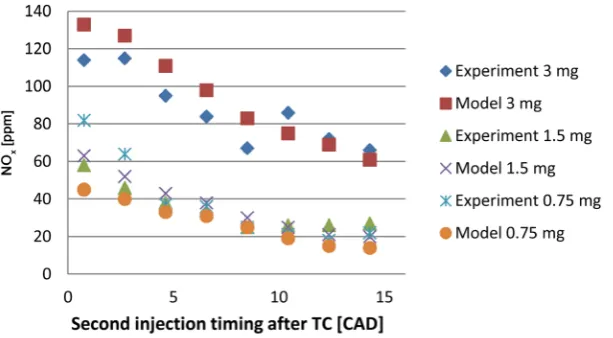
Figures 3-6 show plots of the measured and predicted NOx emissions under varying fuel masses and different injection scheme. Generally, NOx emissions predicted by the model increases as injection timing advances, this trend is as expected since ignition timing advances with advancing injection timing and thus, the in-cylinder combustion temperature rises, therefore the trend of NOx emissions with respect to different injec-tion condiinjec-tions are well predicted by the model.
Figure 3. At 5 CAD BTDC, fuel used per cycle 6.0 mg, injection pressure 400 bar (for experi-ment), engine speed 1600 rpm, 2 injections, first injection of 3.0 mg and second injection of 3.0 mg.
Figure 4. NOx versus second injection timing, first injection at 5 CAD BTDC, fuel used per cycle
6.0 mg, injection pressure 400 bar (for experiment), engine speed 1600 rpm, 2 injections, first in-jection of 1.5 mg and second inin-jection of 4.5 mg.
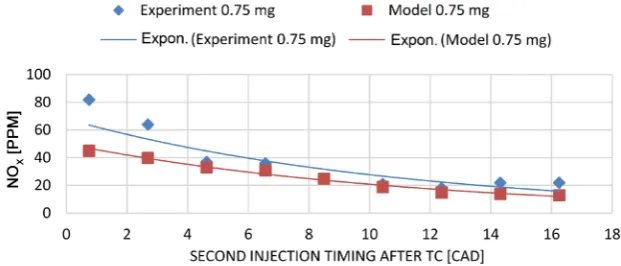
Figure 5. NOx versus second injection timing, first injection at 5 CAD BTDC, fuel used per cycle
[image:10.595.218.529.525.658.2]Figure 6. NOx versus second injection timing, first injection at 5 CAD BTDC, fuel used per cycle
6.0 mg, injection pressure 400 bar (for experiment), engine speed 1600 rpm, 2 injections, first in-jection of 0.75, 1.5 and 3.0 mg.
because of the equilibrium approach used in Zeldovich NOx formation mechanism. The equilibrium assumption approach used in the model predicts the peak concentration of NOx, at any given temperature because the assumption of immediate chemical equili-brium is made. Although with both equiliequili-brium and dynamic approach, NOx formation reactions have high activation energies; hence, NOx rate of formation is kinetically con-trolled but the effect is prominent with equilibrium reactions at higher temperatures. This means that the level of NOx produced in combustion flame are far below the levels predicted by Zeldovich mechanism equilibrium calculations at higher temperatures.
When the dwell time between injections is small and the mass fraction of the pilot and main injection are closer, there will be joint combustion of the pilot and main in-jection; this joint combustion will lead to an exponential increase in temperature of the in-cylinder medium. This condition is seen when the second injections is advanced in
Figure 3 that is between (2 - 7) CAD. Therefore, the kinetically controlled process of NOx formation at this higher temperature will over predict NOx formation. As the dwell time increases between injections, the temperature of the in-cylinder medium reduces also the kinetically controlled nature of NOx formation reduces, therefore the aptitude of the model over predicting NOx formation decreases as well. At this stage, the expe-rimental result and the simulated prediction start to get close. The rate of NOx forma-tion, on the other hand, is sensitive to temperature and increases exponentially with the reaction temperature.
The trend in NOx emission is shown in Figure 4, when the first and second injec-tions were 1.5 mg and 4.5 mg respectively. NOx emissions predicted by the model in-creases as injection timing advances, this trend is as expected since ignition timing ad-vances with advancing injection timing and thus, the in-cylinder combustion tempera-ture rises. The same processes explained for Figure 3 are applicable to the early injec-tions ATDC in Figure 4.
fraction of pilot injection is small compared to the main injection as in Figure 4, the high temperature produced by pre-mixed combustion from the pilot injection decreas-es. By the time the second pulse is injected the temperature increase due to the first in-jection must have faded away, that is separate combustion occurs, giving rise to lower temperature combustion for the second injection. This process explains the decline in NOx formation rate seen in Figure 4. The low in-cylinder medium temperature caused by separate combustion of the pilot and main injections leads to lower rate of NOx for-mation. This drop in temperature does not only lead to lower rate of NOx formation, it will also lead a phenomenon called freezing: a condition where the in-cylinder medium temperature is not high enough to convert some of the formed NO back to its reactant species. The equilibrium equations do not take into account the freezing phenomenon and this will result that; the NOx concentration modeled with equilibrium equations will drop when the temperature drops since the freezing phenomenon does not emerge in the equilibrium approach. The discrepancy in the model prediction and experimen-tal data in Figure 4 is due to the inability of the equilibrium equation to take into ac-count the freezing phenomenon.
The discrepancy in model prediction and experimental data for Figure 5 is a com-bined effect of the processes described in the analyses of Figure 3 and Figure 4. In
Figure 5, the mass fraction of the pilot injection is very small compared with the main injection therefore the effect of separate combustion and NOx freezing will be very do-minant. Figure 6 shows a plot of NOx formation when Figures 3-5 are plotted on the same chart area; this is to have a general view of NOx emission trend and the extent the mass fractions of the injected pulses can have on NOx formation.
4.2. Two Pulse Injection Strategy
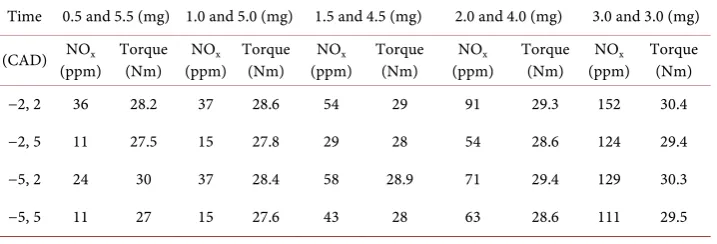
Table 2 presents the results obtained for two-injection scheme. The following trends can be observed from the results:
[image:12.595.197.556.586.708.2] Smaller mass fraction of pilot or first injection will result in lower NOx emission but the engine performance will deteriorate in all cases. This may be because as the mass of pilot injection increases, the turbulent intensity of the in-cylinder charge will
Table 2. NOx and Torque prediction from the model for 2-pulse injection strategy, first injection
at 5 or 2 CAD (BTDC), second injection at 2 or 5 CAD (ATDC), fuel used per cycle 6.0 mg, en-gine speed 1600 rpm.
Time 0.5 and 5.5 (mg) 1.0 and 5.0 (mg) 1.5 and 4.5 (mg) 2.0 and 4.0 (mg) 3.0 and 3.0 (mg)
(CAD) NOx
increase as well, and the effect will be lower ignition time for the second pulse, the low ignition time will result in high temperature. Secondly, the limiting effect of premixed combustion phase will be dominant as the mass of pilot injection increas-es and mass of main injection decreasincreas-es, which will rincreas-esult in high temperature combustion, noting that NOx formation and engine’s thermodynamic performance thrives at higher temperature.
Increasing the dwell between injections or retarding the second injection reduces both NOx formation and engine performance. The effect of increasing the dwell will be to ensure that separate combustion occurs between the first and second injection, and this will result in low temperature combustion.
Conversely, advancing the second injection will result in joint combustion with the preceding injection. The effect of the joint combustion will be high temperature combustion that will result in high NOx formation and enhanced engine perfor-mance.
Advancing the start of pilot injection, results in high NOx formation. In Table 2, advancing the start of pilot injection from −5 CAD to −2 CAD and keeping the start of second injection constant results in both high NOx emission and better engine performance. The reverse effect will occur when start of pilot injection is delayed.
4.3. Three Injection Strategy
Three pulse injection strategy using different fuel quantity at different CAD.
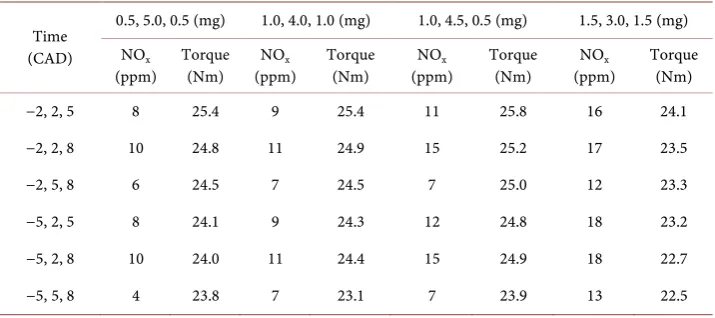
Table 3 presents the results obtained for three-injection scheme. The following trend could be observed from the result:
All the characteristics observed in the case of double injection scheme apply to three-injection strategy.
[image:13.595.196.554.548.707.2] The timing and mass fraction of the main or second injection seems to have greater control on NOx and engine’s thermodynamic performance when compared to mass fraction and timing of the pilot and post injections.
Table 3. NOx and Torque prediction from the model for 3-pulse injection strategy using different
fuel quantiy , first injection at −5 or −2 CAD (BTDC), subsequent injections at 2, 5 or 8 CAD (ATDC), fuel used per cycle 6.0 mg, engine speed 1600 rpm.
Time (CAD)
0.5, 5.0, 0.5 (mg) 1.0, 4.0, 1.0 (mg) 1.0, 4.5, 0.5 (mg) 1.5, 3.0, 1.5 (mg) NOx
It can be observed that the bigger the mass fraction of the main injection is, the
bet-ter the engine performance and more likelihood of higher NOx formation.
Advancing or retarding the start of pilot injection does not seem to have any
signif-icant effect on NOx formation at lower mass fraction of pilot injection.
As the number of injection increases, NOx formation and engine performance
de-creases. This conforms to Mendez and Thirourd. [16] experimental result of mul-tiple injections in diesel engine combustion.
4.4. Four Injection Strategy
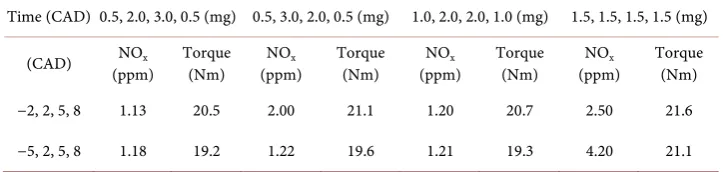
Table 4 confirms that as the number of injection increases engine performance and NOx formation decreases because of low temperature combustion. Table 4 implies that increase in mass fraction of pilot injection leads to higher temperature combustion and higher NOx formation.
5. Conclusions
The use of split injection strategies was investigated using a simplified zero dimensional thermodynamic mathematical model of a diesel engine in MATLAB environment, in order to observe how the thermodynamics variables and NOx emission behave with re-spect to different injection schemes. The extended Zeldovich mechanism was used for NOx prediction. For the validation of the mathematical model, simulations of two- pulse injection strategy were compared with real test data available in the literature. NOx, temperatures and Torque were compared with the experimental data.
From the results obtained, the following conclusions were drawn:
The thermodynamic behaviour of diesel engine and its NOx emission characteristics
were successfully predicted and the predicted results were in a relative good agree-ment with experiagree-mental test data considering the simplicity of the model.
Average cycle temperature within the NOx formation temperature region can be used to predict NOx formation process with reasonable degree of accuracy.
[image:14.595.193.555.618.704.2] Injection timing of the main pulse is of great significance to NOx and engine per-formance, retarding the injection reduces both the NOx emission and engine per-formance.
Table 4. NOx and Torque prediction from the model for 4-pulse injection strategy, first injection
at −5 or −2 CAD (BTDC), subsequent injections at 2, 5 or 8 CAD (ATDC), fuel used per cycle 6.0 mg, engine speed 1600 rpm.
4 pulse injection strategy using different fuel quantity at different CAD
Time (CAD) 0.5, 2.0, 3.0, 0.5 (mg) 0.5, 3.0, 2.0, 0.5 (mg) 1.0, 2.0, 2.0, 1.0 (mg) 1.5, 1.5, 1.5, 1.5 (mg)
(CAD) NOx
(ppm) Torque (Nm) (ppm) NOx Torque (Nm) (ppm) NOx Torque (Nm) (ppm) NOx Torque (Nm) −2, 2, 5, 8 1.13 20.5 2.00 21.1 1.20 20.7 2.50 21.6
As the mass fraction of fuel injection for the pilot and main injection closer to top dead centre increases, NOx emission increases and engine performance improves. As the number of pulses increases, NOx emission and engine performance decrease. As the dwell between injections increases, NOx emission and engine performance
decrease.
Injecting equal mass fraction at every pulse with very close dwell between injections
is not a good strategy in reducing NOx emission.
For optimal balance between NOx and engine performance, mass of the pilot
injec-tion should be between 10% and 25% of the total mass of fuel used per cycle.
Inlet temperature plays an important role in NOx emission.
References
[1] Jafarmadar, S. (2013) The Effect of Split Injection on the Combustion and Emissions in DI and IDI Diesel Engines. In: Bari, S., Ed., Diesel Engine-Combustion, Emissions and Condi-tion Monitoring, InTech. http://dx.doi.org/10.5772/55232
[2] Kumar, S., Chauhan, M.K. and Varun (2013) Numerical Modeling of Compression Ignition Engine: A Review. Renewable and Sustainable Energy Reviews, 19, 517-530.
http://dx.doi.org/10.1016/j.rser.2012.11.043
[3] Kim, H.J., Park, S.H. and Lee, C.S. (2016) Impact of Fuel Spray Angles and Injection Tim-ing on the Combustion and Emission Characteristics of a High-Speed Diesel Engine. Ener-gy, 107, 572-579. http://dx.doi.org/10.1016/j.energy.2016.04.035
[4] Li, J., Yang, W.M., An, H. and Chou, S.K. (2015) Modeling on Blend Gasoline/Diesel Fuel Combustion in a Direct Injection Diesel Engine. Applied Energy, 160, 777-783.
http://dx.doi.org/10.1016/j.apenergy.2014.08.105
[5] An, H., Yang, W., Li, M. and Zhou, D. (2015) Modeling Analysis of Urea Direct Injection on the NOx Emission Reduction of Biodiesel Fueled Diesel Engines. Energy Conversion and
Management, 101, 442-449. http://dx.doi.org/10.1016/j.enconman.2015.06.008
[6] Yao, M., Zheng, Z. and Liu, H. (2009) Progress and Recent Trends in Homogeneous Charge Compression Ignition (HCCI) Engines. Progress in Energy and Combustion Sci- ence, 35, 398-437. http://dx.doi.org/10.1016/j.pecs.2009.05.001
[7] Acroumanis, C. and Kamimoto, T. (2009) Flow and Combustion in Reciprocating Engines. Springer Verlag, Berlin Heidelberg.
[8] Waibel, R.T. (1993) Ultra Low NOx Burners for Industrial Process Heaters. 2nd
Interna-tional Conference on Combustion Technologies for a Clean Environment, Lisbon, John Zink Company, LLC, 19-22 July 1993.
[9] Zheng, M. and Kumar, R. (2009) Implementation of Multiple-Pulse Injection Strategies to Enhance the Homogeneity for Simultaneous Low-NOx and -Soot Diesel Combustion.
In-ternational Journal of Thermal Sciences, 48, 1829-1841.
http://dx.doi.org/10.1016/j.ijthermalsci.2009.02.009
[10] Su, W., Lin, T. and Pei, T. (2004) A Diesel Compound HCCL Combustion Engine Based on Injection Strategy Control. International Journal of Environmental Technology and Man-agement, 4, 187-198. http://dx.doi.org/10.1504/IJETM.2004.005523
[11] Dickey, D., Ryan, T. and Matheaus, A. (1998) NOx Control in Heavy Duty Diesel Engines.
SAE Paper No. 980174. http://dx.doi.org/10.4271/980174
[13] Pierpont, D.A., Montgomery, D.T. and Reitz, R.D. (1995) Multiple Injections and EGR in a Direct Injection Diesel Engines. SAE Paper No. 950217.
[14] Meloni, R. and Naso, V. (2013) An Insight into the Effect of Advanced Injection Strategies on Pollutant Emissions of a Heavy-Duty Diesel Engine. Energies, 6, 4331-4351.
http://dx.doi.org/10.3390/en6094331
[15] Badami, M., Mallamo, F., Millo, F. and Rossi, E.E. (2003) Experimental Investigation on the Effect of Multiple Injection Strategies on Emissions, Noise and Brake Specific Fuel Con-sumption of an Automotive Direct Injection Common-Rail Diesel Engine. International Journal of Engine Research, 4, 229-314. http://dx.doi.org/10.1243/146808703322743903
[16] Mendez, S. and Thirouard, B. (2009) Using Multiple Injection Strategies in Diesel Combus-tion: Potential to Improve Emission, Noise and Fuel Economy Trade-Off in Low CR En-gines. SAE International Journal of Fuels and Lubricants, 1, 662-674.
http://dx.doi.org/10.4271/2008-01-1329
[17] Beatrice, C., Belardini, P., Bertoli, C., Lisbona, M.G. and Rossi Sebastiano, G.M. (2002) Di-esel Combustion Control in Common Rail Engines by New Injection Strategies. Interna-tional Journal of Engine Research, 3, 23-36. http://dx.doi.org/10.1243/1468087021545513
[18] Chang, H., Zhang, Y. and Chen, L. (2005) An Applied Thermodynamic Method for Correc-tion of TDC in the Indicator Diagram and Its Experimental ConfirmaCorrec-tion. Applied Ther-mal Engineering, 25, 759-768. http://dx.doi.org/10.1016/j.applthermaleng.2004.07.016
[19] Han, Z. and Reitz, R.D. (1997) A Temperature Wall Function Formulation for Variable Density Turbulent Flows with Application to Engine Convective Heat Transfer Modeling.
International Journal of Heat and Mass Transfer, 40, 613-625.
http://dx.doi.org/10.1016/0017-9310(96)00117-2
[20] Hsu, D.B. (2002) Practical Diesel-Engine Combustion Analysis. SAE, Warrendale.
http://dx.doi.org/10.4271/r-327
[21] EPA (1999) Nitrogen Oxides (NOx) Why and How They Are Controlled.
http://www.epa.gov/ttn/catc
[22] Sher, E. (Ed.) (1998) Handbook of Air Pollution from Internal Combustion Engines: Pollu-tant Formation and Control. Academic Press, London.
[23] Goldwine, G. and Sher, E. (2009) Experimental Investigation of the Effect of Split Injection on Diesel Engine Performance. International Journal of Vehicle Design, 50, 66-90.
http://dx.doi.org/10.1504/IJVD.2009.024969
Submit or recommend next manuscript to SCIRP and we will provide best service for you:
Accepting pre-submission inquiries through Email, Facebook, LinkedIn, Twitter, etc. A wide selection of journals (inclusive of 9 subjects, more than 200 journals)
Providing 24-hour high-quality service User-friendly online submission system Fair and swift peer-review system
Efficient typesetting and proofreading procedure
Display of the result of downloads and visits, as well as the number of cited articles Maximum dissemination of your research work
![Figure 2. Emission pathway for simultaneous reduction in NOx, soot, CO and HC production zones [14]](https://thumb-us.123doks.com/thumbv2/123dok_us/7863868.737464/5.595.197.551.67.292/figure-emission-pathway-simultaneous-reduction-nox-production-zones.webp)