http://www.scirp.org/journal/ijcm ISSN Online: 2158-2882
ISSN Print: 2158-284X
Evaluating Hospital Admission/Discharge Rates at
the Community Level
Ronald Lagoe
1*, Mark Murphy
2, Shelly Littau
11Hospital Executive Council, Syracuse, NY, USA 2St. Joseph’sHospital Health Center, Syracuse, NY, USA
Abstract
Hospital admission/discharges rates are generating increased attention from health care providers and payors. This study focused on evaluation of inpatient hospital admission/discharge rates for Syracuse and other New York State metropolitan areas during 2014 and 2015. It provided comparative information concerning this subject and suggested how this approach to analysis of hospital utilization could be carried out using publicly available data. The study data demonstrated that hospital admis-sion/discharge rates per 1000 population increased with patient age in all of these areas. The study data suggested that differences in hospital admission/discharge rates among the New York State metropolitan areas were generally consistent between 2014 and 2015. Utica and New York City produced the highest rates. Rochester and Albany produced the lowest rates. Utilization rates for Syracuse were considerably lower than for Utica and New York City and slightly higher than for Rochester and Albany. This analysis demonstrated that most of the differences between aggregate rates for Syracuse and Rochester were produced by elderly patients, especially those aged 75 years and over. The analysis demonstrated that most of these differences in admission rates for the elderly were produced by adult medicine patients aged 75 years and over. Most of these differences were generated by patients with respiratory, digestive, and orthopedic disorders. Additional data suggested that the highest read-mission rates for adult medicine and adult surgery were produced by patients aged 75 years and over.
Keywords
Hospitals, Hospitalization, Hospital Admissions
1. Introduction
In recent years, efforts by health care providers and payors in the United States to im-How to cite this paper: Lagoe, R., Murphy,
M. and Littau, S. (2016) Evaluating Hospital Admission/Discharge Rates at the Commu-nity Level. International Journal of Clinical Medicine, 7, 608-619.
http://dx.doi.org/10.4236/ijcm.2016.79067
Received: August 13, 2016 Accepted: September 16, 2016 Published: September 19, 2016
Copyright © 2016 by authors and Scientific Research Publishing Inc. This work is licensed under the Creative Commons Attribution International License (CC BY 4.0).
prove services have focused on a number of issues related to utilization. Many of these concern improvements in the efficiency and outcomes of care [1].
Historically, health care providers have worked to deliver services more efficiently. Their efforts have included length of stay reduction programs stimulated by payments per discharge. Providers have been able to shorten stays by reducing expenses while maintaining revenue [2][3].
Since the 1980s, health care researchers studied differences in hospital admission rates by region and approaches to reducing them. These efforts focused on local and regional variations in admission rates in the eastern and midwestern United States
[4]-[7].
During the twenty first century, health care payors have developed new initiatives to reduce hospital admissions. These include programs that include primary care provid-ers, statewide initiatives such as the Delivery System Reform Incentive Payment (DSRP) effort in New York, and initiatives developed by large insurers such as Blue Cross. Re-cently, efforts to increase the efficiency of care have also emerged from population based initiatives [7][8].
Health care payors have also developed programs designed to improve hospital out-comes by reducing inpatient admissions. In 2009, Medicare began penalizing hospitals whose inpatient readmissions exceeded certain levels for specific diagnoses [9]-[13].
In recent years, a number of risk sharing arrangements involving health care provid-ers and payors have developed in the United States. These have included Accountable Care Organizations designed to improve the efficiency and outcomes of care. They have also included payor driven initiatives to reduce hospital admissions, as well as efforts to reduce the use of long term care services for patients discharged from hospitals [14]-
[17].
2. Population
The study evaluated inpatient hospital admissions and discharges, as well as related in-dicators in Syracuse, New York and other New York State metropolitan areas. The Sy-racuse area includes three acute care facilities, Crouse Hospital (19,776 discharges ex-cluding well newborns, 2015), St. Joseph’s Hospital Health Center (24,803 discharges, 2015), and Upstate University Hospital (28,237 discharges, 2015). The hospitals work with a combined medical staff of more than 1,800 physicians.
The Syracuse hospitals provide primary and secondary acute care to the metropolitan area with a population of approximately 600,000. They also provide tertiary care ser-vices to the Central New York Health Service Area with a population of approximately 1,400,000.
The Syracuse hospitals have worked cooperatively to improve the efficiency of acute care in the community through initiatives that involve the local health care system. A number of these initiatives have been developed through the Hospital Executive Coun-cil [18].
sion rate compared with other metropolitan areas. An important cause of this admis-sion rate was the deciadmis-sion not to construct another hospital in the northern suburbs of Syracuse during the 1970s. At the time this decision was made, the local hospitals sponsored the development of an organization to provide additional ambulatory care services in the area. In the 1980s, that entity became the sponsor of the community’s first managed care plan.
During the 1990s, the managed care organization was acquired by another insurance plan. During the twenty first century, the Syracuse area has not had a locally based ma-naged care plan. Since 2010, a number of health care payers, including Medicaid and Blue Cross, have begun discussions with hospitals in Syracuse and other New York State metropolitan areas concerning the potential for reducing inpatient admis-sions.
3. Method
This study evaluated recent hospital admissions/discharges in the metropolitan area of Syracuse, New York in comparison with other New York State metropolitan areas. The evaluation was based on hospital admissions/discharges per population in these areas during January-December 2014 and January-December 2015.
The study was based on resident data within which individual hospitals were not identified. It was developed as a community wide study by the Hospital Executive Council which serves as the research organization and the Ethics Committee for mul-tihospital studies in the community. The study employed publicly available data which are not subject to hospital specific issues.
The study employed a simple descriptive analysis of hospital admission/discharge rates. These analyses were based on resident admissions/discharges compared with resident populations for each category of the analysis.
The article was based on summary data concerning hospital admission/discharge rates. The data used to calculate these rates are available from the authors on request.
The first component of the study compared hospital admission rates in Syracuse and other New York State metropolitan areas. This was a useful comparison because areas such as Utica and New York City have generated relatively high admission rates, while Rochester has produced relatively low rates. The comparison employed inpatient data from 2014 and 2015 in order to include the most current information.
For each of the two twelve month periods, the study data were analyzed by patient age including 0 - 17 years, 18 - 44 years, 45 - 64 years, 65 - 75 years, and 75 years and over, and total. This analysis provided information concerning the age levels of patients driving differences in admission/discharge rates between Syracuse and the other New York State metropolitan areas. Newborns were excluded from the analysis because they were not counted as admissions. Mental health patients were excluded because data for State mental health hospitals were not available.
in-cludes inpatient information from all hospitals in the State.
The second component of the study evaluated resident inpatient discharges by major hospital service for Syracuse and other New York State metropolitan areas in the popu-lation age groups where admissions and discharges per popupopu-lation in Syracuse ap-peared to be elevated. This analysis focused on adult medicine and adult surgery, which accounted for most inpatient admissions and discharges for these age groups.
The third component of the study evaluated resident inpatient discharges by clinical category for Syracuse and other New York State metropolitan areas in the major hos-pital service and population age groups where admissions and discharges per popula-tion in Syracuse appeared to be elevated. This analysis employed the Major Diagnostic Categories based on the All Patients Refined Diagnosis Groups developed by 3M™ Health Information Systems [19].
The fourth component of the study evaluated inpatient hospital readmissions within 30 days for patients by age level in the combined Syracuse hospitals. This analysis in-cluded numbers of readmissions and readmission rates for patients readmitted between January 2014 and December 2015. These data were based on the Potentially Preventable Readmissions software developed by 3M™ Health Information Systems.
These data were developed using the Potentially Preventable Readmissions algorithm developed by 3M Health Information Systems. The study data were obtained from the three Syracuse hospitals by the Hospital Executive Council through Business Associate Agreements.
4. Results
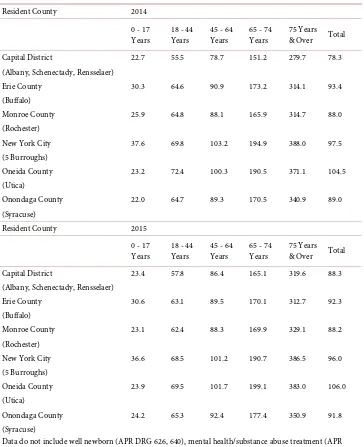
The first component of the study focused on resident hospital discharge rates for Syra-cuse and other New York State metropolitan areas including comparisons by age level. Related data are summarized in Table 1.
This information demonstrated that, consistent with experience in the hospital in-dustry, admission/discharge rates for each metropolitan area increased with patient age. The rates for ages 75 years and over were 5 - 6 times the rates for ages 18 - 44 years and 3 - 4 times the rates for ages 45 - 64 years.
This information also demonstrated that, during 2015 and 2016, the highest resident hospital admission/discharge rates among the metropolitan areas were generated by Utica and New York City, while the lowest rates were produced by Rochester and Al-bany. Additional data demonstrated that the distributions of admission/discharge rates were similar between 2007 and 2015.
Table 1. Resident inpatient hospitalization per 1000 population, medical/surgical, obstetrics, and pediatric/neonatal, New York state metropolitan areas, 2014-2015.
Resident County 2014
0 - 17
Years 18 - 44 Years 45 - 64 Years 65 - 74 Years 75 Years & Over Total Capital District 22.7 55.5 78.7 151.2 279.7 78.3 (Albany, Schenectady, Rensselaer)
Erie County 30.3 64.6 90.9 173.2 314.1 93.4
(Buffalo)
Monroe County 25.9 64.8 88.1 165.9 314.7 88.0 (Rochester)
New York City 37.6 69.8 103.2 194.9 388.0 97.5 (5 Burroughs)
Oneida County 23.2 72.4 100.3 190.5 371.1 104.5 (Utica)
Onondaga County 22.0 64.7 89.3 170.5 340.9 89.0 (Syracuse)
Resident County 2015
0 - 17
Years 18 - 44 Years 45 - 64 Years 65 - 74 Years 75 Years & Over Total Capital District 23.4 57.8 86.4 165.1 319.6 88.3 (Albany, Schenectady, Rensselaer)
Erie County 30.6 63.1 89.5 170.1 312.7 92.3
(Buffalo)
Monroe County 23.1 62.4 88.3 169.9 329.1 88.2 (Rochester)
New York City 36.6 68.5 101.2 190.7 386.5 96.0 (5 Burroughs)
Oneida County 23.9 69.5 101.7 199.1 383.0 106.0 (Utica)
Onondaga County 24.2 65.3 92.4 177.4 350.9 91.8 (Syracuse)
Data do not include well newborn (APR DRG 626, 640), mental health/substance abuse treatment (APR DRGs 740 - 776), and rehabilitation (APR DRG 860).
Prepared by Hospital Executive Council.
The breakdowns of discharge rates by age level suggested that these differences were produced largely by elderly population subgroups. The Syracuse rates were less than 2 discharges per 1000 higher than those of Rochester and Albany for residents aged 0 - 17 years, less than 9 discharges per 1000 higher for residents aged 18 - 44 years, and less than 11 discharges per 1000 higher for residents aged 45 - 64 years. At the same time, the rates for Syracuse were 5 - 19 discharges per 1000 higher for residents aged 65 - 74 years and 26 - 60 discharges per 1000 higher for residents aged 75 years and over.
noteworthy because both markets are dominated by the same major insurer. The Syra-cuse rates were 3.9 discharges per 1000 lower—1.1 discharges per 1000 higher for ages 0 - 17 years, 0.1 discharges per 1000 lower—2.9 discharges per 1000 higher for ages 18 - 44 years, and 1.2 - 4.1 discharges per 1000 higher for ages 45 - 64 years. The Syracuse rates were 4.6 - 7.5 discharges per 1000 higher for ages 65 - 74 years and 21.8 - 26.2 discharges per 1000 higher for ages 75 years and over.
These comparisons suggested that hospital admission/discharge rates in the Syracuse metropolitan area were conservative compared with those of other areas in New York State. They also indicated that most of the differences between Syracuse and those of Rochester and Albany were generated by elderly populations.
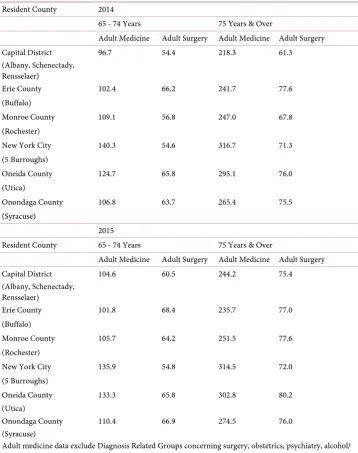
The second component of the analysis focused on hospital admission/discharge rates for major inpatient services in population age groups where rates in Syracuse appeared to be elevated, ages 65 - 74 years and 75 years and over. Relevant data are summarized
in Table 2.
This information included admission/discharge rates for adult medicine and adult surgery. These were the two largest inpatient services in the Syracuse hospitals and the only services with substantial numbers of discharges aged 65 - 74 years and 75 years and over.
This information demonstrated that, consistent with the experience of the hospital industry, admission/discharge rates for adult medicine were substantially higher than for adult surgery. These differences increased with patient age.
These data demonstrated that adult medicine admission/discharge rates for Syracuse were lower than those of New York City and Utica for both 2014 and 2015. For ages 65 - 74 years, discharge rates for Syracuse were 17.9 - 22.9 discharges per 1000 lower than those of Utica and 25.5 - 33.5 discharges per 1000 lower than those New York City. For ages 75 years and over, discharge rates for Syracuse were 28.3 - 29.7 dis-charges per 1000 lower than those of Utica and 40.0 - 51.3 disdis-charges per 1000 lower than those of New York City. These differences were consistent with the differences in the aggregate discharge rates among these communities.
The data in Table 2 also demonstrated the adult medicine admission rates for Syra-cuse were generally higher than those of Rochester and Albany for both 2014 and 2015, especially for ages 75 years and over. For ages 65 - 74 years, discharge rates for Syracuse were 2.3 discharges per 1000 lower—4.7 discharges per 1000 higher than those of Rochester and 5.8 - 10.1 discharges per 1000 higher than those of Albany. For ages 75 years and over, discharge rates for Syracuse were 18.4 - 23.0 discharges per 1000 higher than those of Rochester and 30.3 - 47.1 discharges per 1000 higher than those of Albany for ages 75 years and over.
Table 2. Resident inpatient medical/surgical hospitalization per 1000 population, ages 65 years and over, New York state metropolitan areas, 2014-2015.
Resident County 2014
65 - 74 Years 75 Years & Over
Adult Medicine Adult Surgery Adult Medicine Adult Surgery
Capital District 96.7 54.4 218.3 61.3
(Albany, Schenectady, Rensselaer)
Erie County 102.4 66.2 241.7 77.6
(Buffalo)
Monroe County 109.1 56.8 247.0 67.8
(Rochester)
New York City 140.3 54.6 316.7 71.3
(5 Burroughs)
Oneida County 124.7 65.8 295.1 76.0
(Utica)
Onondaga County 106.8 63.7 265.4 75.5
(Syracuse)
2015
Resident County 65 - 74 Years 75 Years & Over
Adult Medicine Adult Surgery Adult Medicine Adult Surgery
Capital District 104.6 60.5 244.2 75.4
(Albany, Schenectady, Rensselaer)
Erie County 101.8 68.4 235.7 77.0
(Buffalo)
Monroe County 105.7 64.2 251.5 77.6
(Rochester)
New York City 135.9 54.8 314.5 72.0
(5 Burroughs)
Oneida County 133.3 65.8 302.8 80.2
(Utica)
Onondaga County 110.4 66.9 274.5 76.0
(Syracuse)
Adult medicine data exclude Diagnosis Related Groups concerning surgery, obstetrics, psychiatry, alcohol/ substance abuse treatment, and rehabilitation.
Adult surgery data exclude Diagnosis Related Groups concerning medicine, obstetrics, psychiatry, and alcohol/substance abuse treatment.
Prepared by Hospital Executive Council.
75 years and over, rates for Syracuse were 0.5 - 4.2 discharges per 1000 lower than those of Utica and 4.0 - 4.2 discharges per 1000 higher than those of New York City. These differences contrasted with the data for all ages where rates for Syracuse were lower than those in these communities.
for all ages combined. For ages 65 - 74 years, rates for Syracuse were 2.7 - 6.9 discharges per 1000 higher than those of Rochester and 6.4 - 9.3 discharges per 1000 higher than those of Albany. For ages 75 years and over, discharge rates were 1.6 - 7.7 discharges per 1000 higher than those of Rochester and 0.6 - 14.2 discharges per 1000 higher than those of Albany.
Among these data, the clearest differences between Syracuse, Rochester, and Albany were for adult medicine patients aged 75 years and over. For this population, discharge rates in Syracuse exceeded those of the other communities by relatively large margins. This information suggested that this population was probably the source of most of the differences in rates that were identified in the aggregate data.
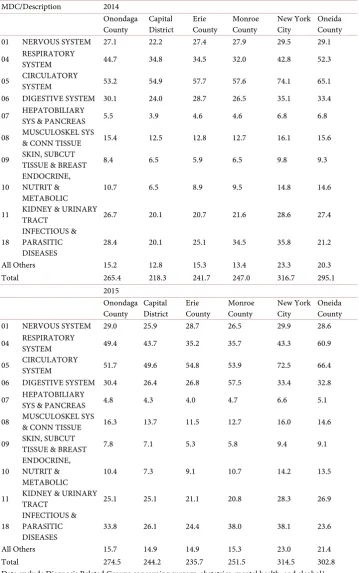
The third component of the study focused on hospital admission/discharge rates for Syracuse and other New York State metropolitan areas for adult medicine patients aged 75 years and over by Major Diagnostic Category. Relevant data are summarized in
Ta-ble 3.
This information focused on resident hospital admission/discharges among Major Diagnostic Categories with the highest rates among New York State metropolitan areas. These categories included cardiology, respiratory medicine, urology, neurology, the di-gestive system, and infectious/parasitic diseases.
The data demonstrated that, consistent with previous analyses, admission rates for these adult medicine diagnoses for patients aged 75 years and over in Syracuse were generally lower than those of Oneida County and New York City for diagnoses involv-ing the circulatory Major Diagnostic Category (11.9 - 14.7 discharges per 1000 lower). This category had the highest overall rates among the metropolitan areas. Differences between rates for Syracuse and the other areas for other Major Diagnostic Categories varied.
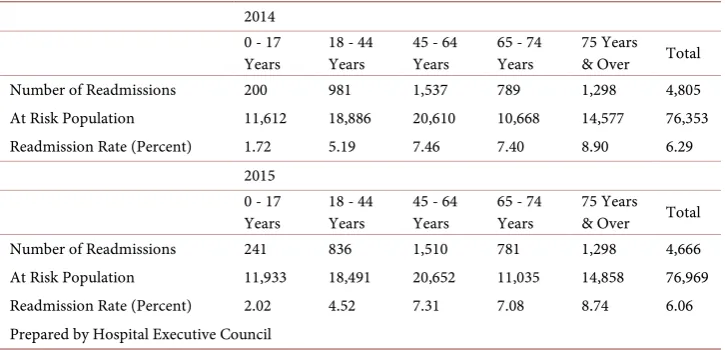
The data in Table 3 also demonstrated that resident admission/discharge rates in Syracuse were higher than those in Rochester for diagnoses involving a number of adult medicine diagnoses. These included the respiratory system, kidney and urinary tract, and orthopedics for both 2014 and 2015. These differences were greatest for the respi-ratory Major Diagnostic Category where the rate for Syracuse was 12.7 discharges per 1000 higher in 2014 and 13.7 discharges per 1000 in 2015. Additional information con-cerning inpatient hospital admissions/discharges in 2014 and 2015 was generated by an analysis of inpatient readmissions by age level for these time periods. Relevant data are summarized in Table 4.
This information includes numbers of readmissions and readmission rates for the Syracuse hospitals for the same age levels evaluated in the data for resident hospital readmission rates. These data are included in the resident admission data for Syracuse included in previous components of the study.
Table 3. Resident adult medicine inpatient hospitalization per 1000 population, ages 75 years and over by major diagnostic category, New York state metropolitan areas, 2014-2015.
MDC/Description 2014 Onondaga
County Capital District Erie County Monroe County New York City Oneida County 01 NERVOUS SYSTEM 27.1 22.2 27.4 27.9 29.5 29.1 04 RESPIRATORY SYSTEM 44.7 34.8 34.5 32.0 42.8 52.3
05 CIRCULATORY SYSTEM 53.2 54.9 57.7 57.6 74.1 65.1 06 DIGESTIVE SYSTEM 30.1 24.0 28.7 26.5 35.1 33.4 07 HEPATOBILIARY SYS & PANCREAS 5.5 3.9 4.6 4.6 6.8 6.8
08 MUSCULOSKEL SYS & CONN TISSUE 15.4 12.5 12.8 12.7 16.1 15.6
09 SKIN, SUBCUT TISSUE & BREAST 8.4 6.5 5.9 6.5 9.8 9.3
10 ENDOCRINE, NUTRIT &
METABOLIC 10.7 6.5 8.9 9.5 14.8 14.6
11 KIDNEY & URINARY TRACT 26.7 20.1 20.7 21.6 28.6 27.4
18 INFECTIOUS & PARASITIC
DISEASES 28.4 20.1 25.1 34.5 35.8 21.2
All Others 15.2 12.8 15.3 13.4 23.3 20.3
Total 265.4 218.3 241.7 247.0 316.7 295.1
2015 Onondaga
County Capital District Erie County Monroe County New York City Oneida County 01 NERVOUS SYSTEM 29.0 25.9 28.7 26.5 29.9 28.6 04 RESPIRATORY SYSTEM 49.4 43.7 35.2 35.7 43.3 60.9
05 CIRCULATORY SYSTEM 51.7 49.6 54.8 53.9 72.5 66.4 06 DIGESTIVE SYSTEM 30.4 26.4 26.8 57.5 33.4 32.8 07 HEPATOBILIARY SYS & PANCREAS 4.8 4.3 4.0 4.7 6.6 5.1
08 MUSCULOSKEL SYS & CONN TISSUE 16.3 13.7 11.5 12.7 16.0 14.6
09 SKIN, SUBCUT TISSUE & BREAST 7.8 7.1 5.3 5.8 9.4 9.1
10 ENDOCRINE, NUTRIT &
METABOLIC 10.4 7.3 9.1 10.7 14.2 13.5
11 KIDNEY & URINARY TRACT 25.1 25.1 21.1 20.8 28.3 26.9
18 INFECTIOUS & PARASITIC
DISEASES 33.8 26.1 24.4 38.0 38.1 23.6
All Others 15.7 14.9 14.9 15.3 23.0 21.4
Total 274.5 244.2 235.7 251.5 314.5 302.8
Data exclude Diagnosis Related Groups concerning surgery, obstetrics, mental health, and alcohol/ substance abuse treatment, and rehabilitation.
Table 4. Potentially preventable readmissions, total readmissions by age level, Syracuse hospitals, 2014-2015.
2014 0 - 17
Years 18 - 44 Years 45 - 64 Years 65 - 74 Years 75 Years & Over Total Number of Readmissions 200 981 1,537 789 1,298 4,805 At Risk Population 11,612 18,886 20,610 10,668 14,577 76,353 Readmission Rate (Percent) 1.72 5.19 7.46 7.40 8.90 6.29
2015 0 - 17
Years 18 - 44 Years 45 - 64 Years 65 - 74 Years 75 Years & Over Total Number of Readmissions 241 836 1,510 781 1,298 4,666 At Risk Population 11,933 18,491 20,652 11,035 14,858 76,969 Readmission Rate (Percent) 2.02 4.52 7.31 7.08 8.74 6.06 Prepared by Hospital Executive Council
1537 patients, and ages 75 years and over, 1298 patients for both years. The total num-bers of patients at risk of readmission for all ages combined in the Syracuse hospitals varied only slightly between the two years, 76,353 - 76,969.
This information demonstrated that, like resident hospital admission/discharge rates by age level in Syracuse, readmission rates were consistent between 2014 and 2015. The data also suggested that, like resident admission rates, readmission rates were highest for patients aged 75 years and over.
5. Limitations
The study analysis and resulting conclusions were based on the data concerning resi-dent hospital admission/discharge rates for the New York State metropolitan areas identified. These data were developed for January-December 2014 and 2015. The data do not relate to other areas or time periods.
6. Discussion
Hospital admission/discharges rates are generating increased attention from health care payors. Medicare risk programs, as well as initiatives by Medicaid and commercial in-surance companies are supporting increased use of primary care, long term care, and other programs as means of reducing hospital utilization and related costs.
This study focused on evaluation of inpatient hospital admission/discharge rates for Syracuse and other New York State metropolitan areas during 2014 and 2015. It pro-vided comparative information concerning this subject and suggested how this ap-proach to analysis of hospital utilization could be carried out using publicly available data.
as respiratory and circulatory conditions produced the largest utilization rates.
The study data suggested that differences in hospital admission/discharge rates among the New York State metropolitan areas were generally consistent between 2014 and 2015. Utica and New York City produced the highest rates. Rochester and Albany produced the lowest rates. Utilization rates for Syracuse were considerably lower than for Utica and New York City and slightly higher than for Rochester and Albany.
Admission rates for the metropolitan areas during 2014 and 2015 were also evaluated by age level, a major cause of variations in this indicator. This analysis demonstrated that most of the differences between aggregate rates for Syracuse and Rochester were produced by elderly patients, especially those aged 75 years and over.
The analysis demonstrated that most of these differences in admission rates for the elderly were produced by adult medicine patients aged 75 years and over. Most of these differences were generated by patients with respiratory, digestive, and orthopedic dis-orders. Additional study data suggested that the highest readmission rates for adult medicine and adult surgery patients were produced by those aged 75 years and over.
The results of this study concerning resident hospital utilization rates were not earthshaking, in the context of increasing interest in this subject by health care provid-ers and payors. At the same time, they suggested that resident data could be used to fo-cus planning on populations with higher utilization rates and the development of ser-vices to address their needs. In the case of Syracuse, this meant the frail elderly aged 75 years and over and not those with commercial insurance aged 18 - 64. In other com-munities, the focus could be different.
This type of planning used to be more common when managed care was widespread. The increased attention being devoted to it by Accountable Care Organizations, Medi-caid, and Blue Cross may suggest a wave of renewed interest in this type of care delivery and related planning. Such efforts could take advantage of additional indicators such as severity of illness and the specificity of ICD 10 diagnosis codes.
7. Recommendations
The study suggests that health care providers and payors should consider reviewing hospital admission rate data as part of their planning efforts. Numerous changes in the delivery of health care services have occurred during the last twenty years. In the con-text of these developments, such as telemedicine, long term acute care, and intensive rehabilitation, this could be a valuable exercise. It could lead to reductions in hospital admissions, improved outcomes, and lower costs for all of those involved with health care.
References
[1] Dentzler, S. (2011) Urgent Measures for an Old Problem. Health Affairs, 30, 1626.
http://dx.doi.org/10.1377/hlthaff.2011.0961
[3] Cushing, W.T. (2004) Extra Hospital Days Can Cost You Plenty. Medical Economics, 81, 83.
[4] Chassin, M.R., Brook, R.H., Park, R.E., Kessey, J., Fink, A., Kahn, K., Merrick, N. and So-lomon, D.H. (1986) Variations in the Use of Medical and Surgical Services by the Medicaid Population. New England Journal of Medicine, 315, 285-290.
http://dx.doi.org/10.1056/NEJM198601303140505
[5] Tedeschi, P.I., Wolfe, R.A. and Griffith, J.R. (1990) Micro Area Variation in Hospital Use.
Health Services Research, 24, 729-740.
[6] Knickman, J.R. and Foltz, A.M. (1985) A Statistical Analysis of Reasons for East West Dif-ferences in Hospital Use. Inquiry, 22, 45-58.
[7] Barr, P. (2015) Three Practical Approaches to Population Health. Hospitals and Health Networks, 89, 22-27.
[8] Toone, K. and Muhlstein, D. (2015) MACRA: Quality Incentives, Provider Considerations, and the Path Forward. Leavitt Partners, New York.
[9] Skinner, J., Chandra, A., Goodman, D. and Fisher, E.S. (2009) The Elusive Connection be-tween Health Care Spending and Quality. Health Affairs, 28, 1256-1258.
http://dx.doi.org/10.1377/hlthaff.28.1.w119
[10] Weil, A.R. (2015) Hospital Costs and Quality. Health Affairs, 34, 1263.
http://dx.doi.org/10.1377/hlthaff.2015.0786
[11] Rau, J. (2012) Medicare to Penalize 2211 Hospitals for Excess Readmissions. Kaiser Health News.
[12] Goldfield, N.I., McCullough, E.C., Hughes, J.S., Tang, A.M., Eastman, B., Rawlins, L.K. and Averill, R.F. (2009) Identifying Potentially Preventable Readmissions. Health Care Financ-ing Review, 30, 75-92.
[13] Fuller, R.L.; McCullough, E.C., Bao, M.Z. and Averill, R.F. (2009) Estimating the Costs of Potentially Preventable Hospital Acquired Complications. Health Care Financing Review, 30, 17-32.
[14] Evans, M. (2012) The Early Returns on Accountable Care. Modern Healthcare, 42, S1-S5. [15] Fisher, E.E., Shortell, S.M., Kriendler, S.A., Van Citters, A.D. and Larson, B.K. (2012) A
Framework for Evaluating the Formation and Implementation of Accountable Care Or-ganizations. Health Affairs, 31, 2368-2378. http://dx.doi.org/10.1377/hlthaff.2012.0544
[16] Burke, G.C. and Brundage, S.C. (2016) Performance of New York’s Accountable Care Or-ganizations in Year 2 of the Medicare Shared Savings Program. United Hospital Fund, New York.
[17] Barkholz, D. (2016) Under Construction: Risk-Based Reimbursement. Modern Healthcare, 46, 14-18.
[18] Lagoe, R., Pasinski, T., Kronenberg, P., Quinn, T., Schaengold, P. (2006) Linking Health Services at the Community Level. Canada Healthcare Quarterly, 9, 60-65.
http://dx.doi.org/10.12927/hcq..18229
Submit or recommend next manuscript to SCIRP and we will provide best service for you:
Accepting pre-submission inquiries through Email, Facebook, LinkedIn, Twitter, etc. A wide selection of journals (inclusive of 9 subjects, more than 200 journals)
Providing 24-hour high-quality service User-friendly online submission system Fair and swift peer-review system
Efficient typesetting and proofreading procedure
Display of the result of downloads and visits, as well as the number of cited articles Maximum dissemination of your research work