Open Access
Research article
The Shoulder Pain and Disability Index demonstrates factor,
construct and longitudinal validity
Joy C MacDermid*
1,2, Patty Solomon
2and Kenneth Prkachin
3Address: 1Clinical Research Lab, Hand and Upper Limb Centre, St. Joseph's Health Centre, London, Ontario N6A 4L6, Canada, 2School of Rehabilitation Science, McMaster University, Hamilton, Ontario L8S 1C7, Canada and 3Psychology Department, University of Northern British Columbia, Prince George, BC V2N 4Z9, Canada
Email: Joy C MacDermid* - [email protected]; Patty Solomon - [email protected]; Kenneth Prkachin - [email protected] * Corresponding author
Abstract
Background: The Shoulder Pain and Disability Index (SPADI) is a self-report measure developed to evaluate patients with shoulder pathology. While some validation has been conducted, broader analyses are indicated. This study determined aspects of cross-sectional and longitudinal validity of the SPADI.
Methods: Community volunteers (n = 129) who self-identified as having shoulder pain were enrolled. Patients were examined by a physical therapist using a standardized assessment process to insure that their pain was musculoskeletal in nature. This included examination of pain reported during active and passive shoulder motion as reported on a visual analogue pain scale. Patients completed the SPADI, the Coping Strategies Questionnaire (CSQ) and the Sickness Impact Profile (SIP) at a baseline assessment and again 3 and 6 months later. Factor analysis with varimax rotation was used to assess subscale structure. Expectations regarding convergent and divergent subscales of CSQ and SIP were determined a priori and analysed using Pearson correlations. Constructed hypotheses that patients with a specific diagnosis or on pain medication would demonstrate higher SPADI scores were tested. Correlations between the observed changes recorded across different instruments were used to assess longitudinal validity.
Results: The internal consistencies of the SPADI subscales were high (α > 0.92). Factor analysis with varimax rotation indicated that the majority of items fell into 2 factors that represent pain and disability. Two difficult functional items tended to align with pain items. Higher pain and disability was correlated to passive or negative coping strategies, i.e., praying/hoping, catastrophizing on the CSQ. The correlations between subscales of the SPADI and SIP were low with divergent subscales and low to moderate with convergent subscales. Correlations, r > 0.60, were observed between the SPADI and pain reported on a VAS pain scale during active and passive movement. The two constructed validity hypotheses (on diagnosis and use of pain medications) were both supported (p < 0.01). The SPADI demonstrated significant changes over time, but these were poorly correlated to the SIP or CSQ suggesting that these scales measure different parameters.
Conclusion: The SPADI is a valid measure to assess pain and disability in community-based patients reporting shoulder pain due to musculoskeletal pathology.
Published: 10 February 2006
BMC Musculoskeletal Disorders 2006, 7:12 doi:10.1186/1471-2474-7-12
Received: 11 May 2005 Accepted: 10 February 2006
This article is available from: http://www.biomedcentral.com/1471-2474/7/12
© 2006 MacDermid et al; licensee BioMed Central Ltd.
Background
The shoulder pain and disability index (SPADI) [1] is a self-report questionnaire developed to measure the pain and disability associated with shoulder pathology. The SPADI consists of 13 items in two subscales: pain (5 items) and disability (8 items); originally items were pre-sented in a visual analogue format. The initial validation work was based on 37 male patients with shoulder pain. High internal consistency (0.86 to 0.95) was observed overall, and moderate test-retest reliability was reported (ICC = 0.65) on a subgroup of 23 patients. Principal com-ponents factor analysis with, and without, varimax rota-tion were conducted, with the former supporting the two subscales currently used; i.e., pain and disability. Validity was established by correlating SPADI total and subscale scores with shoulder range of motion (ROM). The ability to measure clinical change was indicated by high negative correlations between changes in SPADI scores and changes in shoulder ROM [1].
A second group of investigators conducted a larger valida-tion study in 1995 [2]. This study established a numeric (0–10) version of the SPADI, suitability for telephone administration, convergent validity with other health sta-tus measures, and responsiveness. Primary care patients (n = 102) with shoulder discomfort were followed for 3 months. Convergent validity was determined by compar-ing the SPADI with aspects of general health measured by the Health Assessment Questionnaire (HAQ) and the Medical Outcomes Study SF-20 (SF-20). At baseline the visual analogue (VAS) and numeric scaled SPADI were highly concordant (intraclass correlation coefficient = 0.86), and the SPADI correlated substantially with the HAQ (r = 0.61) and the physical functioning (r = -0.50) and pain (r = -0.43) domains of the SF-20. The change in SPADI scores discriminated accurately between subjects who reported being improved versus those who said they were the same or worsened [2].
Support for validity in these initial situations encouraged others to use the SPADI in clinical practice and research. Additional studies were conducted to examine the validity of the SPADI either in isolation or in comparison to other shoulder instruments [3-7,7-14] (These are summarized in appended supplementary tables. See Additional file 1). All have provided additional support for the SPADI, although the nature of the subscales has been questioned in subsequent factor analyses [9]. Factor analysis, without varimax rotation in both the original study [1] and in a subsequent one [9] support items loading on a single fac-tor, while varimax rotation supported the 2 subscales cur-rently accepted [1]. This has important implications for scoring and reporting, as well as interpretation. For exam-ple, we were using the SPADI in a study examining pain coping, and felt it was important to know whether these
subscales separately reflected pain and shoulder-related disability.
The SPADI is only one of many joint-specific self-report forms that focuses on the shoulder. Previous narrative reviews have reflected this spectrum [15]. More recently, a systematic review of shoulder self-report scales was con-ducted to make definitive conclusions about their meth-odological properties [16]. It suggested that the construct and responsiveness of the SPADI were good. This review was unable to make definitive conclusions or recommend one instrument over another for any given purpose because of a lack of sufficient methodological studies. It did indicate that the DASH (Disability Arm, Shoulder, Hand) SPADI, ASES (American Shoulder and Elbow Sur-geons) were the most studied of 16 identified instru-ments. However, this review also noted that all instruments require additional methodological evalua-tion. Subsequent studies have suggested that the SPADI is highly correlated with the DASH and ASES in patients with shoulder arthroplasty [14] and has high responsive-ness to detect change following an initial episode of shoulder pain [7] or a spectrum of shoulder conditions [17]. We wished to conduct a study on pain coping styles. This provided an opportunity and need for us to address SPADI validation issues. Firstly, we felt it was important to clarify the subscale (factor) structure of the SPADI in a larger sample size to determine whether subscales scores were valid. Secondly, we felt a broader understanding of the validity and meaning of the scores obtained on the SPADI would be possible by evaluating the impact of dif-ferent pain coping strategies on SPADI scores. We wish to examine construct validity by comparing SPADI scores to joint irritability and the extent of shoulder pathology. Our final purpose was to supplement the published compari-sons of the SPADI with general health status measures (HAQ or SF-20) with a comparison to different health sta-tus measure (the SIP) that would address different domains of health.
Methods
SubjectsParticipants were 129 community volunteers who self-identified in response to newspaper ads or clinic posters recruiting patients having shoulder pain. All participants completed a screening examination that included self-report measures and physical assessment by a physical therapist. Subjects who were unable to read or write in English were excluded from the study. Subjects were par-ticipating in a larger study examining behavioural meas-ures of pain.
The Shoulder Pain and Disability Index (SPADI)
Figure 1
The Shoulder Pain and Disability Index (SPADI). This is a numeric version of the SPADI, used with permission of the developer K Roach.
SPADI (SHOULDER)
Name _______________________________ Date______________
PAIN SCALE
How severe is your pain:
1. At its worst. No pain 0 1 2 3 4 5 6 7 8 9 10 Worst Pain Imaginable
2. When lying on involved side. No pain 0 1 2 3 4 5 6 7 8 9 10 Worst Pain Imaginable
3. Reaching for something on a high shelf.
No pain 0 1 2 3 4 5 6 7 8 9 10 Worst Pain Imaginable
4. Touching the back of your neck. No pain 0 1 2 3 4 5 6 7 8 9 10 Worst Pain Imaginable
5. Pushing with the involved arm. No pain 0 1 2 3 4 5 6 7 8 9 10 Worst Pain Imaginable
DISABILITY SCALE
How much difficulty did you have:
1. Washing your hair. No difficulty 0 1 2 3 4 5 6 7 8 9 10 So difficult required help
2. Washing your back. No difficulty 0 1 2 3 4 5 6 7 8 9 10 So difficult required help
3. Putting on an undershirt or pullover sweater.
No difficulty 0 1 2 3 4 5 6 7 8 9 10 So difficult required help
4. Putting on a shirt that buttons down the front.
No difficulty 0 1 2 3 4 5 6 7 8 9 10 So difficult required help
5. Putting on your pants. No difficulty 0 1 2 3 4 5 6 7 8 9 10 So difficult required help
6. Placing an object on a high shelf. No difficulty 0 1 2 3 4 5 6 7 8 9 10 So difficult required help
7. Carrying a heavy object of 10 pounds.
No difficulty 0 1 2 3 4 5 6 7 8 9 10 So difficult required help
8. Removing something from your back pocket.
No difficulty 0 1 2 3 4 5 6 7 8 9 10 So difficult required help
DEVELOPED BY Roach 1991 [1];
Reference List
Test Procedures
All patients were examined using a standardized physical examination to insure the pain was attributable to
musc-uloskeletal dysfunction. This assessment included joint irritability, which was assessed by having the patient rate on a VAS pain scale, the extent of pain with active and
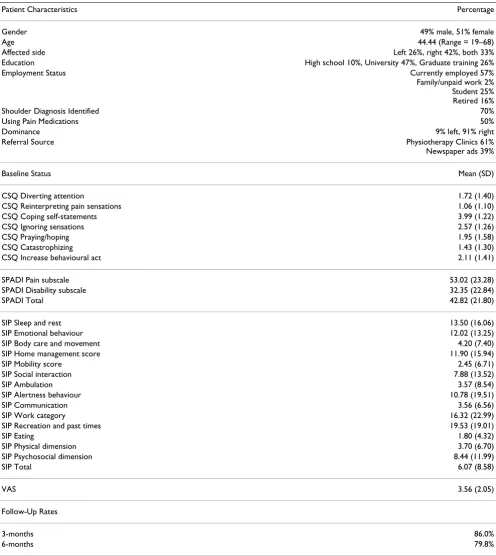
pas-Table 1: Patient Characteristics
Patient Characteristics Percentage
Gender 49% male, 51% female
Age 44.44 (Range = 19–68)
Affected side Left 26%, right 42%, both 33%
Education High school 10%, University 47%, Graduate training 26%
Employment Status Currently employed 57%
Family/unpaid work 2% Student 25% Retired 16%
Shoulder Diagnosis Identified 70%
Using Pain Medications 50%
Dominance 9% left, 91% right
Referral Source Physiotherapy Clinics 61%
Newspaper ads 39%
Baseline Status Mean (SD)
CSQ Diverting attention 1.72 (1.40)
CSQ Reinterpreting pain sensations 1.06 (1.10)
CSQ Coping self-statements 3.99 (1.22)
CSQ Ignoring sensations 2.57 (1.26)
CSQ Praying/hoping 1.95 (1.58)
CSQ Catastrophizing 1.43 (1.30)
CSQ Increase behavioural act 2.11 (1.41)
SPADI Pain subscale 53.02 (23.28)
SPADI Disability subscale 32.35 (22.84)
SPADI Total 42.82 (21.80)
SIP Sleep and rest 13.50 (16.06)
SIP Emotional behaviour 12.02 (13.25)
SIP Body care and movement 4.20 (7.40)
SIP Home management score 11.90 (15.94)
SIP Mobility score 2.45 (6.71)
SIP Social interaction 7.88 (13.52)
SIP Ambulation 3.57 (8.54)
SIP Alertness behaviour 10.78 (19.51)
SIP Communication 3.56 (6.56)
SIP Work category 16.32 (22.99)
SIP Recreation and past times 19.53 (19.01)
SIP Eating 1.80 (4.32)
SIP Physical dimension 3.70 (6.70)
SIP Psychosocial dimension 8.44 (11.99)
SIP Total 6.07 (8.58)
VAS 3.56 (2.05)
Follow-Up Rates
3-months 86.0%
[image:4.612.57.553.99.655.2]sive shoulder movement (flexion, abduction, internal, and external rotation). For this study, these scores were averaged.
All subjects completed the numeric version of the SPADI (Figure 1) [1]. The VAS was originally published as a VAS scale, and subsequently validated as numeric scale of 0– 10 [2]. The Coping Strategies Questionnaire (CSQ) [18] and a general health measure, the Sickness Impact Profile (SIP) [19-21] were completed on the same occasions. All scales were completed at enrolment and at 2 subsequent follow-up evaluations, 3 and 6 months later.
The CSQ [18] is a 44-item scale with 2 general questions and 7 subscales: Diverting attention, Reinterpreting pain sensation, Coping self statements, Ignoring sensations, Praying/hoping, Catastrophizing, and Increase behav-ioural act (version obtained from developer). This scale has variations across studies and the form used in this study was obtained directly from the developer.
The SIP [19-21] has 136 items divided across the follow-ing domains (number of items in brackets): Sleep and rest (7), Emotional behaviour (9), Body care and movement (23), Home management (10), Mobility (10), Social interaction (20), Ambulation (12), Alertness (10), Com-munication (9), Work (9), Recreation and past time (8), and Eating (9). In addition, the physical and mental sum-mary scores are computed.
Most subjects had some form of physical therapy for their shoulder problem, i.e., 82% for the total population. See Table 1 for a summary of demographic data. The study neither controlled therapy nor collected details about the type of therapy provided; although none had surgery over the course of the study.
Analyses
All data analyses were conducted using SPSS 13.0. The dis-tributions of our scores, skewness and kurtosis suggested data were normally distributed. Internal consistency was determined using Cronbach's alpha. Validity was evalu-ated by conducting three types of validation analyses: fac-tor, construct and longitudinal. Factor analyses with and without varimax rotation were used to evaluate the factor structure of the SPADI. Cross-sectional construct validity analyses were performed separately at each of the 3 time-points. Longitudinal validity was determined across the 3 assessment points by correlating changes observed on dif-ferent instruments.
Convergent and divergent validity were determined by comparing correlations with SPADI scores across related aspects of pain behaviour (CSQ) and the general health scale (SIP) using Pearson r correlations. SPADI scores were
also correlated to joint irritability scores. The clinical sig-nificance of correlations is debatable, as a variety of benchmarks have been described. We described the asso-ciation of different constructs using correlations and rated the effect size of these as defined by Cohen where the effect sizes for correlation coefficients are: r ≈ 0.10 is small effect with negligible practical importance, r ≈ 0.30 is a medium effect with moderate practical importance and r ≈ 0.50 is a large effect of crucial practical importance [22].
Construct validity was evaluated by testing two hypothe-ses. The first hypothesis was that subjects with diagnosed shoulder problems would have more severe pathology, and therefore more pain and disability than those who complained of shoulder pain, but did not have a specific diagnosis. The second hypothesis was participants who were taking pain medication for their shoulder problem would have higher SPADI scores. These hypotheses were tested using a generalized linear model (ANOVA), which evaluated the changes across the repeated factor (time) and between the two hypothesis-groups (medication or diagnosis hypotheses tested). Finally, longitudinal valid-ity was evaluated by correlating changes on the SPADI to changes in pain subscales on the SIP that were expected to be affected by shoulder pain, i.e., home maintenance and physical health.
Results
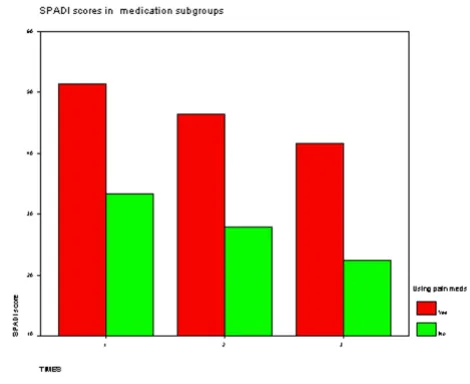
There were significant differences across time for all patients; but both patients who had diagnosed shoulder problems and those on pain mediation reported higher pain and disability scores on the SPADI at all time points (Figures 2 and 3). In fact, improvement over time in SPADI scores was nearly parallel in both comparisons, indicating similar rates of improvement over time. Although significant improvements in pain and disability occurred over time (p < 0.001), correlations between changes in scores on SPADI subscales and changes on the SIP or CSQ were low and non-significant except for pain catastrophizing.
Discussion
This study provides additional support for the use of the SPADI as a measure of pain and disability in patients with shoulder pain. Despite the availability of outcome meas-ures specific to upper extremity it has been shown that the rates of utilization of self-report measures are low in clin-ical practice [23]. Brevity and simplicity are properties that are highly valued by clinicians when considering whether to use an outcome measure in clinical practice [24]. The structure of the SPADI suggests that it would be practical in the clinical setting, particularly the numeric format used in this study (Figure 1), which lessens the scoring burden on the clinician when compared to the visual ana-logue version. Self-report disability measures are key out-comes in orthopaedic clinical trials. In this case, responsiveness is a prime concern as it determines sample size requirements. There are insufficient data from head-to-head comparisons of available shoulder instruments to identify the most responsive instrument for different shoulder pathologies [16]. This study did not address the validity or responsiveness relative to competing measures, but contributes to current studies providing support for
the SPADI as an option in clinical evaluation by providing additional evidence that the SPADI discriminates between subgroups and detects change over time.
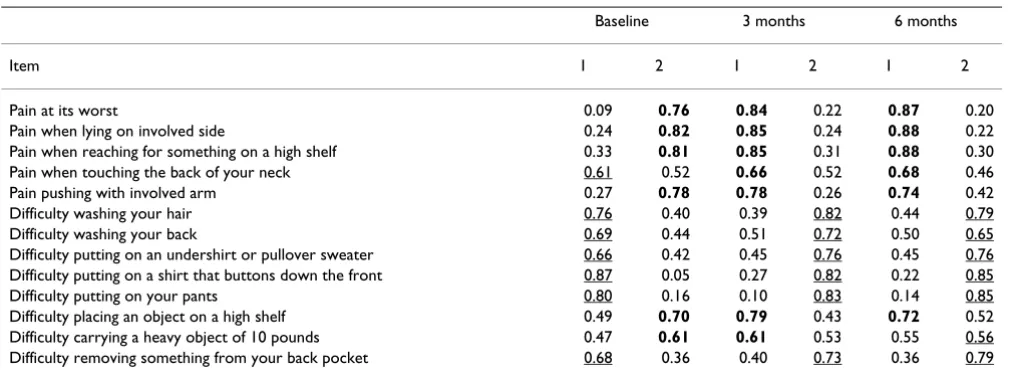
[image:6.612.54.563.98.286.2]Some of the current findings substantiate the results of previous validation. For example, Roach [1] originally reported a two factor solution to factor analysis when var-imax rotation was used. However, that study sample was much lower than typically required to conduct factor anal-yses, which would suggest that there might be some insta-bility in their results. Later, data from a much larger sample [9] suggested that the SPADI contained a single factor, although only unrotated analyses were performed. Our study indicated high internal consistency across SPADI items and an unrotated factor analyses indicated that 57% of variance loaded on a single factor. Varimax rotation has been recommended as it is preferable when inter-item correlations are anticipated [25] such as in the case of pain and disability items. The outcome of this analysis was consistent with the analysis performed in the original validation study [1]. Our results supported the concept of separate pain and disability subscales, although the items on overhead reaching and carrying heavy objects tended to load with pain in 2/3 of the evaluations. This may reflect that these higher demand activities are most painful for patients with shoulder problems. In one case, a pain item that included a functional component (reaching) loaded with disability items. Others have ques-tioned the extent to which functional items are independ-ent from pain items on the WOMAC's assessmindepend-ent of lower extremity musculoskeletal problems, particularly when items ask about pain during a functional task [26,27]. Our results suggest that some specific functional items might be difficult to separate from pain in musculoskeletal pathologies affecting the shoulder, and that items that
Table 2: Results of Factor Analysis for SPADI on 3 occasions
Baseline 3 months 6 months
Item 1 2 1 2 1 2
Pain at its worst 0.09 0.76 0.84 0.22 0.87 0.20
Pain when lying on involved side 0.24 0.82 0.85 0.24 0.88 0.22
Pain when reaching for something on a high shelf 0.33 0.81 0.85 0.31 0.88 0.30
Pain when touching the back of your neck 0.61 0.52 0.66 0.52 0.68 0.46
Pain pushing with involved arm 0.27 0.78 0.78 0.26 0.74 0.42
Difficulty washing your hair 0.76 0.40 0.39 0.82 0.44 0.79
Difficulty washing your back 0.69 0.44 0.51 0.72 0.50 0.65
Difficulty putting on an undershirt or pullover sweater 0.66 0.42 0.45 0.76 0.45 0.76
Difficulty putting on a shirt that buttons down the front 0.87 0.05 0.27 0.82 0.22 0.85
Difficulty putting on your pants 0.80 0.16 0.10 0.83 0.14 0.85
Difficulty placing an object on a high shelf 0.49 0.70 0.79 0.43 0.72 0.52
Difficulty carrying a heavy object of 10 pounds 0.47 0.61 0.61 0.53 0.55 0.56
Difficulty removing something from your back pocket 0.68 0.36 0.40 0.73 0.36 0.79
Extraction Method: Principal Component Analysis. Rotation Method: Varimax with Kaiser Normalization. Rotation converged in 3 iterations. The
include a reference to both pain and function may load on either factor. In situations where factorial analyses are quite different from the subscales described by develop-ers, it might be advisable to use only total scores in clinical or research reporting, particularly if the subscale structure does not hold up across repeated clinical studies. Given that some instability in factorial analyses across studies/ conditions might be anticipated, and that most items fol-lowed the pain and disability subscale structure described for the SPADI, we would interpret our findings as support-ing the existsupport-ing pain and disability subscales of the SPADI.
Previous studies have compared SPADI scores to shoulder motion and found that patients with better movement had less pain and disability [2]. We have focused on pain during motion as a comparator and demonstrated moder-ately strong correlation, providing evidence that joint irri-tability as defined in this study was related to pain and disability reported on the SPADI.
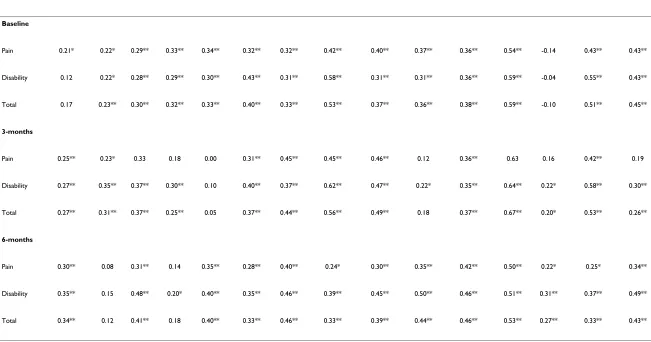
Other studies have correlated the SPADI with instruments measuring function (DASH, SST), pain or general health (SF-36). Our results are in general agreement with others who have reported that upper extremity instruments, including the SPADI are moderately related to physical subscales of the SIP [5,28,29]. Others have suggested that the SIP may exhibit ceiling effects with healthier subjects [30], which might be a consideration given the age and sampling used in our study. We had anticipated that SIP measures of disability on some physical dimensions, like
work, might have demonstrated stronger correlations with the SPADI. However, others have reported that the SIP is less correlated with musculoskeletal measures than is the SF-36 [31], suggesting that inherent properties of the SIP may explain the correlations observed. Similarly, we found that while the SPADI detected significant changes at each time point following assessment, these correlated poorly with changes on the SIP. Others have suggested that the SIP is less responsive in musculoskele-tal problems than the SF-36 [31,32] or suggested that despite its longer length, responsiveness was no better [33]. Furthermore, we know that even the SF-36 is much less responsive than measures specific to the upper extremity [34]. We interpret these findings as support for our conclusion that the low correlations between SPADI and SIP items observed on longitudinal change reflect a lack of responsiveness on the SIP to changes in health emanating from changes in shoulder status. This reflects an inherent methodological problem when comparing change on more responsive instruments to that occurring on less responsive instruments.
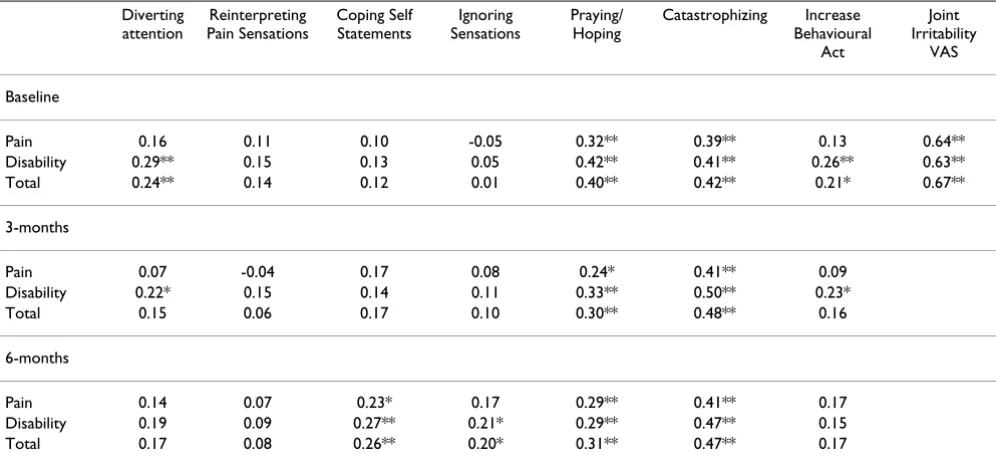
This study adds to previous validation studies in that a novel scale that addresses pain coping behaviour was included. This provides broader support for the SPADI and new information on the relationships between differ-ent aspects of pain coping and pain reporting on the SPADI. We were able to determine that negative or passive coping strategies were associated with higher levels of reported disability at each cross-sectional analysis.
Previ-Table 3: Correlations comparing the SPADI with different pain coping subscales (strategies) and joint irritability
Diverting attention
Reinterpreting Pain Sensations
Coping Self Statements
Ignoring Sensations
Praying/ Hoping
Catastrophizing Increase
Behavioural Act
Joint Irritability
VAS
Baseline
Pain 0.16 0.11 0.10 -0.05 0.32** 0.39** 0.13 0.64**
Disability 0.29** 0.15 0.13 0.05 0.42** 0.41** 0.26** 0.63**
Total 0.24** 0.14 0.12 0.01 0.40** 0.42** 0.21* 0.67**
3-months
Pain 0.07 -0.04 0.17 0.08 0.24* 0.41** 0.09
Disability 0.22* 0.15 0.14 0.11 0.33** 0.50** 0.23*
Total 0.15 0.06 0.17 0.10 0.30** 0.48** 0.16
6-months
Pain 0.14 0.07 0.23* 0.17 0.29** 0.41** 0.17
Disability 0.19 0.09 0.27** 0.21* 0.29** 0.47** 0.15
Total 0.17 0.08 0.26** 0.20* 0.31** 0.47** 0.17
** Correlation is significant at the 0.01 level (2-tailed). * Correlation is significant at the 0.05 level (2-tailed). According to Cohen (1987) the effect
sizes for correlation coefficients are r ≈ 0.10 is small effect with negligible practical importance, r ≈ 0.30 is a medium effect with moderate practical
[image:7.612.56.554.101.334.2]BMC Musculoskeletal Disorders
200
6,
7
:12
http
://www.bio
m
e
dcent
ral.com/147
1-247 Page 8 of
(page number not for citation purposes)
SPADI score
Communication Eating Alertness Behaviour
Mobility Emotional Behaviour
Ambulation Sleep & Rest
Body Care and Movement
Social Interaction
Psychosocial dimension
Recreation and Pastime
Home Management
Work Physical dimension SIP Total
Divergent→→→→→→→→→→→→→→→→→→→→→→→→→→Intermediate→→→→→→→→→→→→→→→→→→→→→→→→→→→→→→→→→Convergent
Baseline
Pain 0.21* 0.22* 0.29** 0.33** 0.34** 0.32** 0.32** 0.42** 0.40** 0.37** 0.36** 0.54** -0.14 0.43** 0.43**
Disability 0.12 0.22* 0.28** 0.29** 0.30** 0.43** 0.31** 0.58** 0.31** 0.31** 0.36** 0.59** -0.04 0.55** 0.43**
Total 0.17 0.23** 0.30** 0.32** 0.33** 0.40** 0.33** 0.53** 0.37** 0.36** 0.38** 0.59** -0.10 0.51** 0.45**
3-months
Pain 0.25** 0.23* 0.33 0.18 0.00 0.31** 0.45** 0.45** 0.46** 0.12 0.36** 0.63 0.16 0.42** 0.19
Disability 0.27** 0.35** 0.37** 0.30** 0.10 0.40** 0.37** 0.62** 0.47** 0.22* 0.35** 0.64** 0.22* 0.58** 0.30**
Total 0.27** 0.31** 0.37** 0.25** 0.05 0.37** 0.44** 0.56** 0.49** 0.18 0.37** 0.67** 0.20* 0.53** 0.26**
6-months
Pain 0.30** 0.08 0.31** 0.14 0.35** 0.28** 0.40** 0.24* 0.30** 0.35** 0.42** 0.50** 0.22* 0.25* 0.34**
Disability 0.35** 0.15 0.48** 0.20* 0.40** 0.35** 0.46** 0.39** 0.45** 0.50** 0.46** 0.51** 0.31** 0.37** 0.49**
Total 0.34** 0.12 0.41** 0.18 0.40** 0.33** 0.46** 0.33** 0.39** 0.44** 0.46** 0.53** 0.27** 0.33** 0.43**
[image:8.792.81.732.153.495.2]ous research has illustrated the importance of pain cata-strophizing as a determinant of self-reported pain or disability in other musculoskeletal problems [35-41]. Others have found that changes in pain catastrophizing were associated with clinical improvement in chronic pain patients [42]. Our findings suggest both of these phe-nomena also occur in shoulder pain. Changes in pain cat-astrophizing were associated with changes in SPADI scores, whereas other elements of pain coping were not associated with changes in SPADI scores. This may reflect a lack of responsiveness of the instrument(s) or suggest that these other strategies for coping with pain are less likely to change over time.
This study validates the SPADI for usage in patients pre-senting at the primary care level with shoulder pain. Our study did not determine the specific diagnosis, although a physical therapist confirmed it was of a musculoskeletal nature. Therefore, it was impossible to determine which patients had resolution of their problem, preventing tradi-tional responsiveness analyses. A further limitation is that we did not compare the SPADI to competing shoulder instruments. Despite these limitations, this study indi-cates that the SPADI detects change over time in excess of that reported on the SIP and that the extent of this change fits with constructed hypotheses. This supports the valid-ity of the SPADI as a measure of shoulder pain and disa-bility. This study also highlights that patients with different responses to pain may report pain and disability
differently confirming the importance of serial measure-ments when assessing the response to interventions and suggesting that further study on this phenomena and how it relates to treatment response is warranted. Given the number of shoulder instruments reported in the litera-ture, head-to-head comparisons determining the ability of different scales to detect treatment responses in different clinical situations are needed.
Conclusion
This study provides additional support for the validity of the SPADI in clinical evaluation of shoulder pain and dis-ability in that it discriminates between levels of pain and disability in a community-based sample. It provides new information suggesting that negative pain coping strate-gies are associated with greater self-reported pain and dis-ability. Future studies should focus on comparing competing measures to encourage greater uniformity or comparability across future clinical outcomes studies.
Competing interests
The author(s) declare that they have no competing inter-ests.
Authors' contributions
PS and KP formed the original study team that obtained the ethics approval and obtained grant funding for a study on facial recognition of pain. JM consulted on shoulder
[image:9.612.316.551.90.282.2]SPADI scores over time according to pain medication sub-groups
Figure 3
SPADI scores over time according to pain medica-tion subgroups. This graph shows the SPADI score in patients that had were using pain medication (at baseline evaluation) as compared to those who were not. Significant improvements in SPADI scores occurred across time in both groups. Patients that were using pain medication had higher pain and disability at all 3 time-points (p < 0.001).
SPADI scores over time according to diagnostic subgroups
Figure 2
scales during grant development and worked with PS to develop the research questions around instrument valida-tion. PS coordinated data collection/management. JM conducted statistical analyses and drafted the manuscript. All authors approved the final study protocol, contributed to interpretation of the study results and participated in revisions of the manuscript. All authors read and approved the final manuscript.
Additional material
Acknowledgements
We are grateful for financial support received from the Canadian Institute of Health Research (MOP 53301).
Joy MacDermid holds a New Investigator Award from the Canadian Insti-tute for Health Research.
Thanks to Margaret Lomotan for data entry/quality checking. Thanks to K. Roach for permission to reproduce a version of the SPADI in Figure 1.
References
1. Roach KE, Budiman-Mak E, Songsiridej N, Lertratanakul Y: Develop-ment of a shoulder pain and disability index. Arthritis Care Res
1991, 4:143-149.
2. Williams JWJ, Holleman DRJ, Simel DL: Measuring shoulder func-tion with the Shoulder Pain and Disability Index. J Rheumatol
1995, 22:727-732.
3. Cook KF, Roddey TS, Olson SL, Gartsman GM, Valenzuela FF, Hanten WP: Reliability by surgical status of self-reported outcomes
in patients who have shoulder pathologies. J Orthop Sports Phys Ther 2002, 32:336-346.
4. Di Fabio RP, Boissonnault W: Physical therapy and health-related outcomes for patients with common orthopaedic diagnoses. Journal of Orthopaedic & Sports Physical Therapy 1998,
27:219-230.
5. Heald SL, Riddle DL, Lamb RL: The shoulder pain and disability index: the construct validity and responsiveness of a region-specific disability measure. Phys Ther 1997, 77:1079-1089. 6. MacDermid JC, Chesworth BM, Patterson S, Roth JH: Validity of
pain and motion indicators recorded on a movement dia-gram of shoulder lateral rotation. Australian Journal of Physiother-apy 1999, 45:269-277.
7. Paul A, Lewis M, Shadforth MF, Croft PR, van der Windt DA, Hay EM:
A comparison of four shoulder-specific questionnaires in pri-mary care. Ann Rheum Dis 2004, 63:1293-1299.
8. Schmitt JS, Di Fabio RP: Reliable change and minimum impor-tant difference (MID) proportions facilitated group respon-siveness comparisons using individual threshold criteria. J Clin Epidemiol 2004, 57:1008-1018.
9. Roddey TS, Olson SL, Cook KF, Gartsman GM, Hanten W: Com-parison of the University of California-Los Angeles Shoulder Scale and the Simple Shoulder Test with the shoulder pain and disability index: single-administration reliability and validity. Phys Ther 2000, 80:759-768.
10. Cloke DJ, Lynn SE, Watson H, Steen IN, Purdy S, Williams JR: A comparison of functional, patient-based scores in subacro-mial impingement. J Shoulder Elbow Surg 2005, 14:380-384. 11. Ostor AJ, Richards CA, Prevost AT, Speed CA, Hazleman BL:
Diag-nosis and relation to general health of shoulder disorders presenting to primary care. Rheumatology (Oxford) 2005. 12. Beaton D, Richards RR: Assessing the reliability and
responsive-ness of 5 shoulder questionnaires. J Shoulder Elbow Surg 1998,
7:565-572.
13. Beaton DE, Richards RR: Measuring function of the shoulder. A cross-sectional comparison of five questionnaires. J Bone Joint Surg Am 1996, 78:882-890.
14. Angst F, Pap G, Mannion AF, Herren DB, Aeschlimann A, Schwyzer HK, Simmen BR: Comprehensive assessment of clinical out-come and quality of life after total shoulder arthroplasty: usefulness and validity of subjective outcome measures. Arthritis Rheum 2004, 51:819-828.
15. Michener LA, Leggin BG: A review of self-report scales for the assessment of functional limitation and disability of the shoulder. J Hand Ther 2001, 14:68-76.
16. Bot SD, Terwee CB, van der Windt DA, Bouter LM, Dekker J, de Vet HC: Clinimetric evaluation of shoulder disability question-naires: a systematic review of the literature. Ann Rheum Dis
2004, 63:335-341.
Additional File 1
Supplementary Tables 1–3 On Reliability, Validity and Responsiveness of SPADI reported in previous studies (word file with tables).
Click here for file
[image:10.612.55.555.99.255.2][http://www.biomedcentral.com/content/supplementary/1471-2474-7-12-S1.doc]
Table 5: Correlations between changes in health and coping strategies with SPADI
CHANGE SCORES SPADI PAIN SPADI DISABILITY SPADI TOTAL
SPADI Pain 0.66** 0.91**
SPADI Disability 0.66** 0.88**
SPADI Total 0.91** 0.88**
SIP Home Maintenance 0.10 0.27** 0.20*
SIP Physical Summary -0.06 0.18 0.06
CSQ Diverting attention -0.15 -0.15 -0.16
CSQ Reinterpreting Pain Sensations -0.07 -0.12 -0.09
CSQ Coping Self Statements 0.12 0.16 0.16
CSQ Ignoring Sensations 0.05 -0.03 0.01
CSQ Praying/Hoping -0.06 -0.02 -0.04
CSQ Catastophizing 0.20* 0.25* 0.25*
CSQ Increase Behavioural Act 0.05 -0.03 0.01
** Correlation is significant at the 0.01 level (2-tailed). * Correlation is significant at the 0.05 level (2-tailed). These correlations suggest that the relationship between changes in overall physical health on the SIP or coping strategies are poorly correlated. Changes in pain catastrophizing were
significantly correlated. According to Cohen (1987) the effect sizes for correlation coefficients are r ≈ 0.10 is small effect with negligible practical
Publish with BioMed Central and every scientist can read your work free of charge "BioMed Central will be the most significant development for disseminating the results of biomedical researc h in our lifetime."
Sir Paul Nurse, Cancer Research UK
Your research papers will be:
available free of charge to the entire biomedical community
peer reviewed and published immediately upon acceptance
cited in PubMed and archived on PubMed Central
yours — you keep the copyright
Submit your manuscript here:
http://www.biomedcentral.com/info/publishing_adv.asp
BioMedcentral
17. Rosenstiel AK, Keefe FJ: The use of coping strategies in chronic low back pain patients: relationship to patient characteris-tics and current adjustment. Pain 1983, 17:33-44.
18. Bergner M, Bobbitt RA, Kressel S, Pollard WE, Gilson BS, Morris JR:
The sickness impact profile: Conceptual formulation and methodology for the devlopment of a health status measure. International Journal of Health Services 1976, 6:393-415.
19. Bergner M, Bobbitt RA, Pollard WE, Martin DP, Gilson BS: The sick-ness impact profile: Validation of a health measure. Med Care
1976, 14:57-67.
20. Bergner M, Bobbitt RA, Carter WB, Gilson BS: The sickness impact profile: Development and final revision of a health status measure. Med Care 1981, 19:787-805.
21. Cohen J: Statistical Power Analyses for the Behavioural Sciences New York, N.Y, Academic Press, Harcourt Press; 1987.
22. Michlovitz SL, LaStayo PC, Alzner S, Watson E: Distal radius frac-tures: therapy practice patterns. J Hand Ther 2001, 14:249-257. 23. MacDermid JC, Turgeon T, Richards RS, Beadle M, Roth JH: Patient rating of wrist pain and disability: a reliable and valid meas-urement tool. J Orthop Trauma 1998, 12:577-586.
24. Norman GR, Streiner DL: Biostatistics. The Bare Essentials.Volume 1. 1st edition. St. Louis. MO, Mosby; 1994:2-260.
25. Kennedy D, Stratford PW, Pagura SMC, Wessel J, Gollish JD, Wood-house LJ: Exploring the factorial validity and clinical interpret-ability of the Western Ontario and McMaster Universities Osteoarthritis Index (WOMAC). Physiother Can 2003,
55:160-168.
26. Stratford PW, Kennedy DM: Does parallel item content on WOMAC's pain and function subscales limit its ability to detect change in functional status? BMC Musculoskelet Disord
2004, 5:17.
27. Bostrom C, Harms-Ringdahl K, Nordemar R: Relationships between measurements of impairment, disability, pain, and disease activity in rheumatoid arthritis patients with shoul-der problems. Scand J Rheumatol 1995, 24:352-359.
28. Kirkley A, Alvarez C, Griffin S: The development and evaluation of a disease-specific quality-of-life questionnaire for disor-ders of the rotator cuff: The Western Ontario Rotator Cuff Index. Clin J Sport Med 2003, 13:84-92.
29. Beaton DE, Bombardier C, Hogg-Johnson SA: Measuring health in injured workers: a cross-sectional comparison of five generic health status instruments in workers with musculoskeletal injuries. Am J Ind Med 1996, 29:618-631.
30. Stucki G, Liang MH, Phillips C, Katz JN: The Short Form-36 is preferable to the SIP as a generic health status measure in patients undergoing elective total hip arthroplasty. Arth Care Res 1995, 8:174-181.
31. Beaton DE, Hogg-Johnson S, Bombardier C: Evaluating changes in health status: reliability and responsiveness of five generic health status measures in workers with musculoskeletal dis-orders. J Clin Epidemiol 1997, 50:79-93.
32. Katz JN, Larson MG, Phillips CB, Fossel AH, Liang MH: Compara-tive measurement sensitivity of short and longer health sta-tus instruments. Med Care 1992, 30:917-925.
33. MacDermid JC, Richards RS, Donner A, Bellamy N, Roth JH:
Responsiveness of the short form-36, disability of the arm, shoulder, and hand questionnaire, patient-rated wrist evalu-ation, and physical impairment measurements in evaluating recovery after a distal radius fracture. J Hand Surg [Am ] 2000,
25A:330-340.
34. Buer N, Linton SJ: Fear-avoidance beliefs and catastrophizing: occurrence and risk factor in back pain and ADL in the gen-eral population. Pain 2002, 99:485-491.
35. France CR, France JL, al'Absi M, Ring C, McIntyre D: Catastrophiz-ing is related to pain ratCatastrophiz-ings, but not nociceptive flexion reflex threshold. Pain 2002, 99:459-463.
36. Jones DA, Rollman GB, White KP, Hill ML, Brooke RI: The relation-ship between cognitive appraisal, affect, and catastrophizing in patients with chronic pain. J Pain 2003, 4:267-277.
37. Severeijns R, Vlaeyen JW, van den Hout MA, Weber WE: Pain cat-astrophizing predicts pain intensity, disability, and psycho-logical distress independent of the level of physical impairment. Clin J Pain 2001, 17:165-172.
38. Severeijns R, van den Hout MA, Vlaeyen JW, Picavet HS: Pain cata-strophizing and general health status in a large Dutch com-munity sample. Pain 2002, 99:367-376.
39. Severeijns R, Vlaeyen JW, van den Hout MA, Picavet HS: Pain cata-strophizing is associated with health indices in musculoskel-etal pain: a cross-sectional study in the Dutch community. Health Psychol 2004, 23:49-57.
40. Sullivan MJ, Stanish W, Waite H, Sullivan M, Tripp DA: Catastro-phizing, pain, and disability in patients with soft-tissue inju-ries. Pain 1998, 77:253-260.
41. Jensen MP, Turner JA, Romano JM: Changes in beliefs, catastro-phizing, and coping are associated with improvement in multidisciplinary pain treatment. J Consult Clin Psychol 2001,
69:655-662.
Pre-publication history
The pre-publication history for this paper can be accessed here: