2018 International Conference on Computer, Communications and Mechatronics Engineering (CCME 2018) ISBN: 978-1-60595-611-4
Inverse Analysis for Microbial Depolymerization Process of Polyethylen
Glycol 4000
Masji Watanabe
1,* and Fusako Kawai
21Graduate School of Environmental and Life Science, Okayama University, Okayama, Japan
2Professor Emeritus, Okayama University, Okayama Japan
*Corresponding author
Keywords: Microbial depolymerization, Polyetylene glycol 4000, Mathematical model, Inverse problem, Numerical simulation.
Abstract. A microbial depolymerization process of polyethylene glycol 4000 was investigated mathematically. Weight distributions before and after cultivation of Sphingopyxis macrogoltabidus
strain 103 were introduced into inverse probelms for a molecular factor and a time factor of a degradation rate. Once those inverse problems were solved numerically, the microbial depolymerization process of polyethylene glycol 4000 was simulated.
Introduction
Polyethylene (PE) and polyethylene glycol (PEG) are typical polymers that are depolymerizable in exogenous type microbial depolymerization processes. In those processes, molecules liberate small compounds from their terminals. Microbial depolymerization processes of PEG have been often documented. Those include utilization of PEG of average molecular weight 20000 by Psedonomas aeruginosa [1], degradation of PEG 20000 by anaerobic bacteria isolated from sludge of a municipal anaerobic digester [2], and confirmation of efficient biodegradation of PEG by Pseudomonas stutzeri
[3]. Mathematical studies of microbial depolymerization processes of PE and PEG have also been conducted. A mathematical model was proposed in studies of biodegradation of PE numerically [4]. The mathematical techniques developed for PE biodegradation processes were reapplied in studies of biodegradation processes of PEG [5].
The random breakdown of molecules is the primary factor of endogenous type depolymerization processes. Polyvinyl alcohol (PVA) and polylactic acid (PLA) are typical polymers that are depolymerizable in endogenoustype type depolymerization processes. A mathematical model was proposed in numerical studies of enzymatic degradation process of PVA [6]. The mathematical techniques developed for PVA were reapplied to an enzymatic hydrolysis of polylactic acid (PLA) [7]. Techniques originally developed for endogenous type microbial depolymerization processes were reapplied to exogenous type depolymerization processes of PE and PEG [8].
In this study, previously developed techniques were reapplied to an exogenous type depolymerization process of PEG 4000. Weight distribution of PEG 4000 before and after cultivation of Sphingopyxis macrogoltabidus strain 103 were incorporated into inverse problems for a molecular factor and a time factor of a degradation rate.
Mathematical Model of Exogenous Type Depolymerization Process
Suppose that w(t,M) [mg] denotes the weight distribution of a polymer with respect to the molecular weight M at time t, and let v(t) [mg] be the total weight of polymer molecules with molecular weight between A and B at time t. The total weight v(t) over the interval
A,B
is expressed in terms of the integral
B
Awt M dM t
v ,
0 wt,M dM t
v
(2) Integral (1) is an appropriate approximation of the integral (2) with suitable values of A and B. In this study, integral (2) over the infinite interval was replaced with an integral over a finite interval (1) with A=103.5 and B=103.75. Similarly, integral with the lower limit 0was replaced with an integral
with the lower limit A=103.5, and an integral with the upper limit
was replaced with an integral with the upper limit B=103.75.Suppose that
t is the population of viable cells at time t. The following system of equations (3), (4) for the weight distribution w(t,M) and the microbial population
t was proposed in previous studies [9 - 14]. ,
M
w
t M w c M K d K w t K dK
t
(3)
, h t v k dtd
(4)
, log2.1 , L e K e K d Me M c K K M
Note that the parameter L is the molecular weight of a monomer unit, e.g. PE: L=28 (CH2CH2), PEG: L=44 (CH2CH2O), and k and h are positive parameters. Also note that the function
M is the molecular factor of degradation rate, and that the function
t is the time factor of degradation rate.Equations (2) and (3) lead to
0 , M ,
v t t
M w t M c M
K d K w t K dK dM System of equations (3), (4) is associated with the initial conditions
M
f
M w0, 0, (5)
0 0
, (6) where f0
M and 0 are the initial weight distribution and the initial microbial population, respectively.Analysis of Inverse Problems for Molecular Factor and Time Factor of Degradation Rate
The initial value problem (3), (4), (5), (6) is a solvable problem for unknown functions w(t,M) and
t provided the molecular factor
M and values of parameters 0, k, and h are prescribed. Inorder to obtain the function
M and values of parameters 0, k, and h, the following change of variables from t to was applied.
. 0
t ds s (7) Suppose that W
,M
, S
, and V
are functions that correspond to w(t,M),
t , and v(t) , respectively, according to the change of variables (7). Note that the expression t t t t 1
, , M
W
M W c M K d K W K dK
(8)
h,V k d
dS
(9) respectively. Also note that the expression
dv dV d
v t V t
dt d dt
is valid, and that the equation
t t v V
holds. Those expressions lead to the equation
0 , M , .
V
M W M c M
K d K W K dK dM Suppose that F1(M) is the weight distribution for T1so that
T1,M
F1
M ,W (10)
and that F2(M) is the weight distribution for T2so that
T2,M
F2
M .W (11)
Equation (8), the initial condition (10), and the final condition (11) form an inverse problem for
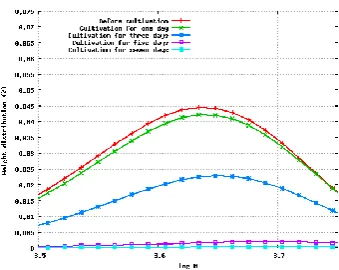
M [image:3.595.211.381.501.636.2] , for which the solution of the initial value problem (8), (10) also satisfies the final condition (11). Numerical techniques for the inverse problem (8), (10), (11) were already developed in previous studies. Those techniques were reapplied to weight distributions of PEG 4000 before and after cultivation of Sphingopyxis macrogoltabidus strain 103 for one day, three days, five days, and seven days (Figure I). Figure II shows the molecular factor
M of degradation rate base on weight distributions before after cultivation of the microorganism for one day.Figure 2. This figure shows the ten times multiple of the molecular factor of degradation rate based on weight distributions before and after cultivation of Sphingopyxis macrogoltabidus strain 103 for one day.
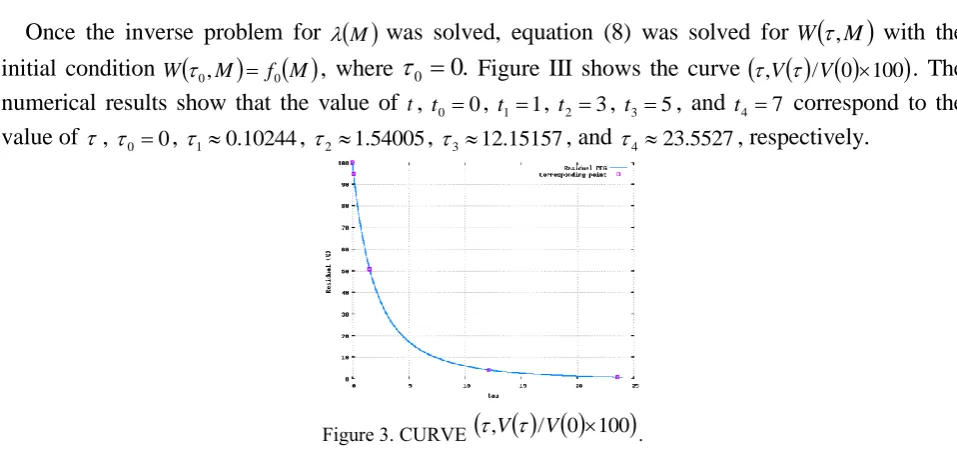
Once the inverse problem for
M was solved, equation (8) was solved for W
,M
with theinitial condition W
0,M
f0
M , where
0 0. Figure III shows the curve
,V
/V 0100
. Thenumerical results show that the value of t, t0 0, t11, t2 3, t35, and t4 7 correspond to the value of , 00, 10.10244, 2 1.54005, 3 12.15157, and 4 23.5527, respectively.
Figure 3. CURVE
,V
/V 0 100
.Application of Numerical Techniques in Inverse Analysis for Time Factor of Degradation Rate
A previous study shows that function V
is well approximated by an exponential function
,0 0 0
0
dM M f v e
v
V
(12)
so that V
v0e. In this study, function V
was replaced with the exponential function(12) with a value of the parameter approximately equal to 0.3465, and equations
vt i1,2,3,4
Vi i were solved numerically.
Suppose that function S
,0,k,h
is the solution of the equation (9) with initial value 0. The change of variables (7) leads to the expression tq
,0,k,h
, where
., , , ,
, ,
0
0
0
h k r S
dr h
k
q
Given m pairs of values of t and ,
ti,i
i1,,m
, equations for 0, k, and h, equations
k h
i m
gi 0, , 0 1,,
where gi
0,k,h
qi,0,k,h
ti , were set. Intervals I1
0.001,0.1
, I2
0.003,0.02
, and
[image:4.595.56.535.220.451.2]
20 3 2 0
2 ,k,h g ,k,h
g
was evaluated at the 1013 combinations of nodal points, among which
[image:5.595.79.509.200.518.2]
0,k,h
0.02674,0.01082,0.13234
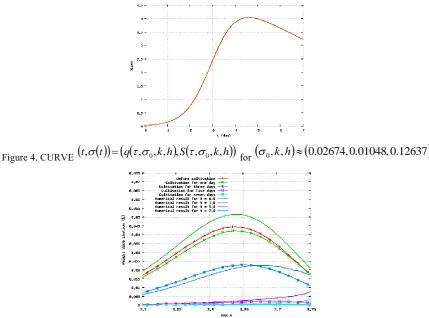
gave the minimum value to the error. Figure IV shows the curve
t,
t
q
,0,k,h
,S,0,k,h
for those values of 0, k, and h. Once the time factor
t was obtained, initial value problem (3), (5) was solved numerically. Figure V shows the weight distributions of PEG 4000 before and after cultivation of Sphingopyxis macrogoltabidus strain 103 for one day, three days, five days, and seven days, and corresponding numerical results.Figure 4. CURVE
t,
t
q
,0,k,h
,S,0,k,h
for
0,k,h
0.02674,0.01048,0.12637
.Figure 5. Weight distributions before and after cultivation of Sphingopyxis macrogoltabidus strain 103 for one day, three days, five days, and seven days, and corresponding numerical results.
Conclusion
In this study, the exogenous type depolymerization process of PEG 4000 was studied. Figure I shows the weight distributions of PEG 4000 before and after cultivation of Sphingopyxis macrogoltabidus
strain 103 for one day, three days, five days, and seven days. Figure II shows a ten times multiple of the molecular factor based on the weight distributions before and after cultivation for one day. The inverse problem for the time factor of the degradation rate was solved (Figure IV). Once the molecular factor and the time factor of the degradation rate were obtained, the initial value problem (3), (6) was solved numerically, and the exogenous type depolymerization process of PEG 4000 was simulated.
Acknowledgment
References
[1] J. R. Haines amd M. Alexander, “Microbial degradation of polyethylene glycol”, Applied Microbiology, May 1975, pp. 621-625.
[2] D. F. Dwyer and J. M. Tiedje, “Degradaton of ethylene glycol and polyethylene glycols by methanogenic consortia”, Applied and Environmental Microbiology, July 1983, pp. 185-190.
[3] N. Obradors and J. Aguilar, “Efficient biodgradation of high-molecular-weight polyethylene glycols by pure cultures of pseudomonas stutzeri”, Applied and Environmental Microbiology, Aug. 1991, pp. 2383-2388.
[4] M. Watanabe, F. Kawai, M. Shibata, S. Yokoyama, Y. Sudate, and S. Hayashi, “Analytical and computational techniques for exogenous depolymerization of xenobiotic polymers”, Mathematical Biosciences 192 (2004) pp. 19-37.
[5] M. Watanabe and F. Kawai, “Effects of microbial population in degradation process of xenobiotic polymers”, In P. Howlett, M. Nelson, and A. J. Roberts, editors, Proceedings of the 9th Biennial Engineering Mathematics and Applications Conference, EMAC-2009, vol 51 ANZIAM J., pp C682--C96, September 2010 http://journal.austms.org.au/ojs/index.php/ANZIAMJ/ article/view/2433
[6] M. Watanabe and F. Kawai, “Mathematical modelling and computational analysis of enzymatic degradation of xenobiotic polymers”, Applied Mathematical Modelling 30 (2006) 1497-1514.
[7] M. Watanabe, F. Kawai, S. Tsuboi, S. Nakatsu, and H. Ohara, “Study on enzymatic hydrolysis of polylactic acid by endogenous depolymerization model”, Macromolecular Theory and Simulations 16 (2007) pp. 619-626.
[8] M. Watanabe and F. Kawai, “Simulation for microbial depolymerization processes of polyethylene glycol”, Proceedings of the 2013 International Conference on Advances in Intelligent Systems in Bioinformatics, Editors: Dr. Ford Lumban Gaol, Dr. Benfino Soewito, Prof. Dr. Mohamed Bououdina, Prof. Dr. Mu-Song Chen, intel-13, Advances in Intelligent Systems Research, Atlantis Press, February 2014, 71–76. ISBN: 978-94-6252-000-4, ISSN: pp. 1951-6851.
[9] https://www.atlantis-press.com/proceedings/intel-13/11361
[10] M. Watanabe and F. Kawai, “Numerical techniques for inverse problems from modeling of microbial depolymerization processes”, International Journal of Applied Engineering Research ISSN 0973-4562 Volume 11, Number 8 (2016) pp. 5461-5468.
[11] M. Watanabe and F. Kawai, “Simulation of microbial depolymerization process with exponential consumption of carbon source”, 2016 International Conference on Computer, Mechatronics and Electronic Engineering (CMEE 2016), DEStech Publications, Inc., Lancaster, Pennsylvania, U.S.A., 2016, pp. 426-431, ISBN: 978-1-60595-406-6.
[12] M. Watanabe and F. Kawai, “Computational analysis for biodegradation of exogenously depolymerizable polymer”, 2017 the 5th International Conference on Mechanical Engineering, Material Science and Civil Engineering, December, 2017, Kuala Lumpur, Malaysia, 012015, IOP Conference Series: Materials Science and Engineering, Published online: 6 April 2018. IOP Publishing.
[14] M. Watanabe and F. Kawai, “Application of the Newton’s method and bisection method to three parameter problem for microbial depolymerization process”, Proceedings, ISER International Conference, 1st–2nd April, 2018| Venue: Kuala Lumpur, Malaysia.