C
RASH
A
VOIDANCE
S
YSTEMS
-S
AFETY
E
VALUATION OF AN
I
MPORTANT
C
LASS OF
E
LECTRONIC
C
ONTROL
S
YSTEMS
D
AVID
J.
L
E
B
LANC
,
C
AROL
A.
F
LANNAGAN
,
D
ANIEL
F.
B
LOWER
,
S
COTT
E.
B
OGARD
,
J
OHN
S
ULLIVAN
,
K
ATHLEEN
D.
K
LINICH
,
C.
R
AYMOND
B
INGHAM
,
A
NDREW
L
ESLIE
,
S
HAN
UMTRI-2017-10
4. Title and Subtitle
Crash Avoidance Systems-Safety Evaluation of an Important Class of Electronic Control Systems
5. Report Date
February 17, 2017
6. Performing Organization Code
7. Author(s)
David J. LeBlanc, Carol A. Flannagan, Daniel F. Blower, Scott E. Bogard, John Sullivan, Kathleen D. Klinich, C. Raymond Bingham, Andrew Leslie, Shan Bao, Michael J. Flannagan, Ding Zhao, Aditi Misra, Lisa Park, and Jennifer Zakrajsek
8. Performing Organization Report No.
9. Performing Organization Name and Address
University of Michigan Transportation Research Institute 2901 Baxter Rd. Ann Arbor MI 48109
10. Work Unit No. (TRAIS)
11. Contract or Grant No.
ContractNumber
12. Sponsoring Agency Name and Address
Toyota Class Action Settlement Safety Research and Education Program 13. Type of Report and Period Covered
Final Technical Report, January 2014-Februrary 2017
14. Sponsoring Agency Code
15. Supplementary Notes
This work was funded in part by the Toyota Class Action Settlement Safety Research and Education Program. The conclusions are those of the authors and have not been sponsored, approved, or endorsed by Toyota or plaintiffs’ class counsel.
16. Abstract
Crash avoidance systems are intended to help drivers avoid or mitigate the severity of crashes by providing warnings or active control interventions. This research program was conducted to provide new knowledge, models, and tools to enable improved designs of automotive crash avoidance systems and more effective deployment strategies. To undertake a comprehensive approach to analyzing these systems, this project considered other effects that influence crash types and mechanisms, including the use of other technologies, driver behavior differences, new public policies, driver demographics, or other influences.
As the first of several analyses, the team estimates the effectiveness and safety benefits of forward crash avoidance and mitigation technologies (FCAM), as well as lateral assist technologies. Crash data analyses were used to understanding causal mechanisms, particularly lateral crashes. Monte Carlo simulations seeded by crash data details and naturalistic driving crashes were then used to estimate effectiveness for different crash subtypes. A second activity was performing human factors experiments in vehicles with assistive technology or partial automation to explore the effect of experience on a driver’s mental model of those systems, particularly the understanding of the limits of the technology. Finally, two efforts focusing on teen safety were completed, including an investigation of the effect of teen passengers on teen driver behaviors and performance, and the effect of different state graduated licensing policies on teen driver safety outcomes relative to the effect of crash avoidance systems.
The UTMOST (Unified Theory for Mapping Opportunities for Safety Technology) tool is designed to allow visualization of the benefits of multiple safety countermeasures and to understand how combinations of those countermeasures might influence the crash population. As part of this project, the UTMOST module was
upgraded to add allow estimation of the safety benefits of several crash avoidance features, as well as the effects of safety legislation.
17. Key Word
Crash mitigation, crash avoidance, teen drivers, graduated licensing, safety countermeasures, legislation, crash data analysis
18. Distribution Statement
19. Security Classif. (of this report) 20. Security Classif. (of this page) 21. No. of Pages 164
22. Price
Table of Contents
List of Figures ... v
List of Tables ... vii
Acronyms ... ix
1 Introduction ... 2
2 Project Overview ... 4
2.1 Research Overview ... 4
2.2 Task Structure ... 7
3 Task 2: UTMOST Development ... 10
3.1 UTMOST Background ... 10
3.2 Countermeasures ... 12
4 Task 3: Forward Crash Avoidance & Mitigation – Effectiveness and Benefits Estimation ... 17
4.1 Characteristics of Forward Crashes using the GES ... 17
4.2 Forward Crash Characteristics using Electronic Data Recorders from CDS and SHRP2 ... 19
4.3 Simulation and Analysis Description ... 23
4.4 Safety Benefits Analyses and Results ... 24
4.5 Implementation in UTMOST ... 29
5 Task 4: Supplementing a Driver’s Understanding of an Advanced Driver Assistance System (ADAS) ... 31
5.1 Introduction ... 31
5.2 Method ... 33
5.3 Results ... 39
5.4 Discussion/Conclusion ... 52
6 Task 5: Lateral Assist Systems – Effectiveness and Benefits Estimation... 54
6.1 Characteristics of Lane- and Road-Departure Crashes ... 54
6.2 Scenarios, Mechanisms, and Countermeasures for Lane- and Road-Departure Crashes ... 63
6.3 Simulation Description ... 65
6.4 Analysis of Lateral Assist System Simulation Data ... 67
6.6 Implementation in UTMOST ... 70
6.7 Intentional Lane Departure Circumstances ... 71
7 Effect of Teen Passengers on Teen Driver Behaviors ... 76
7.1 Introduction ... 76
7.2 Methodology ... 76
7.3 Results ... 78
7.4 Summary and Future Directions ... 83
8 Task 7: UTMOST Comprehensive Benefits ... 85
8.2 Effects of Countermeasures on Teen Safety ... 86
9 Dissemination of Research ... 88
10 Summary ... 89
11 References ... 90
12 Acknowledgments... 94
Appendix A UTMOST Legislation Modules ... 95
Appendix B Further Characterization of Forward Crashes ... 109
Appendix C Models and Methods for Crash Avoidance System Effectiveness Simulation... 114
Appendix D Task 4 Surveys and Driver Information ... 128
Appendix E Analysis of Lane/Road Departure Crash Mechanisms ... 140
Appendix F Injury Probability Estimates for Road-Departure Crashes ... 145
List of Figures
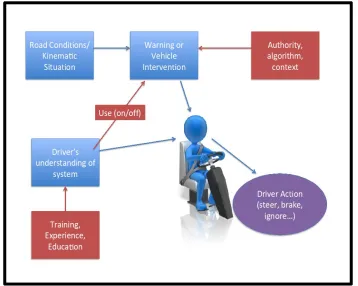
Figure 2-1 Diagram of human factors associated with crash countermeasures ... 6
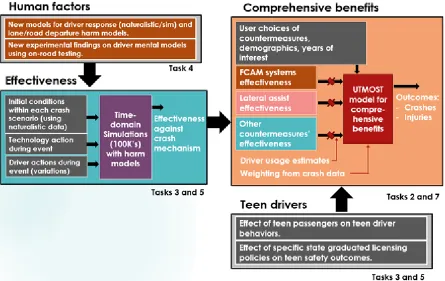
Figure 2-2 Overall project activities ... 9
Figure 3-1 Illustration of delta-V shift for mitigated crashes ... 15
Figure 4-1 Percent striking vehicles that did not brake prior to impact, by FC crash type... 20
Figure 4-2 Time of first brake application prior to collision, for FC crash types and all FC crashes .... 20
Figure 4-3 Speed profile for FC crashes by brake initiation ... 21
Figure 4-4 Selected statistics for braking profiles in FC crashes, SHRP-2 data ... 22
Figure 4-5. Driver gender by brake profile in FC crashes, SHRP-2 data ... 23
Figure 5-1. UMTRI’s generation-5 data acquisition system (GEN5 DAC). ... 37
Figure 5-2. Distribution of subjects among factors: vehicles (A, B), training (Baseline, Enhanced), Driver Age (Middle, Older), and Gender (Male, Female). ... 38
Figure 5-3. Average participant rating of disagreement with the statement that ACC detects all forward vehicles. Red indicates controls; blue indicates supplemental story condition. The difference in the two models is also apparent in this analysis. ... 40
Figure 5-4 Average participant rating of disagreement with the statement that ACC can assist by boosting emergency braking. ... 41
Figure 5-5. Average participant rating of the inappropriateness of using the ACC system around stopped vehicles on the roadway. ... 42
Figure 5-6. Average participant rating of appropriateness of ACC for curvy roadways. ... 43
Figure 5-7. Average participant rating of inappropriateness of ACC around pedestrians and cyclists. ... 44
Figure 5-8. Average participant rating of inappropriateness of use of ACC in rain and snow. ... 45
Figure 5-9. Average participant rating of level of inappropriateness of using LKA around construction areas. ... 47
Figure 5-10. Average participant rating of level of inappropriateness of using LKA in rain or snow, illustrating observed differences in rating by gender. ... 48
Figure 5-11. Average participant rating of level of inappropriateness of using LKA on curvy roads, illustrating observed differences in rating model vehicle driven. ... 49
Figure 5-12. Average participant rating of level of inappropriateness of using LKA on roads in which pedestrians and bicyclists are present, illustrating observed session effects. ... 50
Figure 5-13. Average participant rating of level of inappropriateness of using LKA on roads in which deer, potholes, or other debris might be present. Main effects were observed in session and model; a marginal effect of gender was also observed. ... 51
Figure 6-1 Simulation approach to support crash avoidance effectiveness estimates ... 66
Figure 6-2 Illustration of evaluation of lane departures ... 68
Figure 6-3 Roadway area of lane departures ... 73
Figure 8-1 Example of a law countermeasure as implemented in UTMOST. ... 85
Figure 8-2 Restraint override user interface in UTMOST ... 86
Figure 8-4. Number of teenagers in crashes by age group, baseline, and when 14 or 5
countermeasures are applied. ... 87
Figure 8-5 Effect of countermeasures on teens injured in crashes ... 87
Figure A-1 Total score of state ratings of child passenger safety laws relative to best practice recommendations for each age of child in 2015. ... 96
Figure A-2 Number of states meeting/exceeding current best practice recommendations by child age for years 2002-2015. Best practice by age group= Rear-facing, forward-facing (or RF), child restraint system, child restraint system, seatbelt or child restraint system. ... 97
Figure A-3 Predictions of child restraint use by age group and state law strength. Dotted lines indicate 95% confidence intervals. ... 98
Figure A-4 Child restraint law countermeasure as implemented in UTMOST. ... 99
Figure A-5 Distribution of states by type of seatbelt law. ... 100
Figure A-6 Distribution of population by type of seatbelt law. ... 101
Figure A-7 Seat belt law countermeasure as implemented in UTMOST. ... 102
Figure A-8 Motorcycle helmet law countermeasure as implemented in UTMOST. ... 104
Figure A-9 Hexagonal US map showing number of strong graduated licensing laws for each state, as well as the states used in analysis (outlined). ... 105
Figure A-10 Ratio of teen/adult crashes as a function of number of strong GDL laws... 107
Figure A-11 GDL law countermeasure as implemented in UTMOST. ... 108
Figure B-1 Crash severity of LTV FC and other crash types... 109
Figure B-2 Distribution of speed limit for FC crash types and other crashes ... 111
Figure B-3 Distribution of light condition for FC types and other crashes ... 112
Figure B-4 Distribution of fatigue and distraction for FC types and other crashes ... 113
Figure E-1 Driver “engagement” by driver age, L/RD crashes ... 143
List of Tables
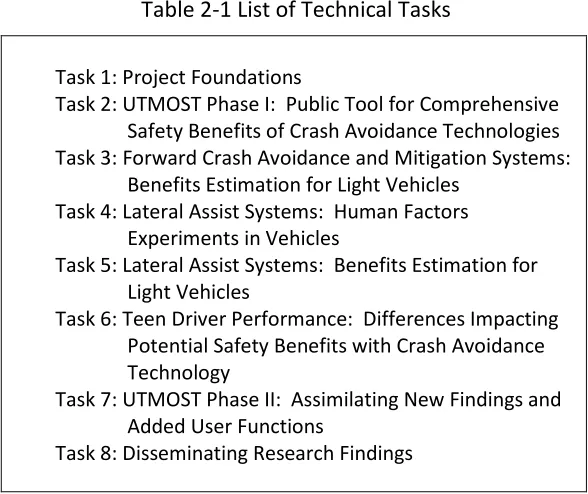
Table 2-1 List of Technical Tasks ... 8
Table 2-2 Updated terminology for targeted technologies ... 8
Table 3-1 Updated technologies available for selection, default value of effectiveness, applicable crash types, and sources. ... 14
Table 4-1 Annual average forward crash types ... 18
Table 4-2 Deceleration in g’s for striking vehicles that braked ... 21
Table 4-3 Simulation results for lead-vehicle braking scenario ... 26
Table 4-4 Simulation results for lead-vehicle fixed (stopped) scenario... 27
Table 4-5 Simulation results for lead-vehicle slower scenario ... 28
Table 4-6 Simulation results for lead-vehicle cut-in (other) scenario ... 29
Table 5-1. Comparative attributes of vehicle models. ... 36
Table 5-2. Differences in rated disagreement between drivers of Model A and Model B vehicles and driver gender regarding each model’s capabilities or appropriateness in different roadway scenarios. ... 46
Table 5-3. Differences in rated disagreement between drivers of Model A and Model B vehicles and driver gender regarding each model’s capabilities or appropriateness in different roadway scenarios. ... 52
Table 6-1 Lane/road departure crash types, with description and hypothesized mechanisms ... 56
Table 6-2 Average annual involvements of LTVs in L/RD crashes and other crash types ... 57
Table 6-3 Top-level L/RD crash mechanisms, weighted ... 60
Table 6-4 Percent distribution of mechanism by L/RD crash type ... 61
Table 6-5 Percent distribution of lane departure type by L/RD crash type ... 62
Table 6-6 Distribution of shoulder type for run-off-road crash involvements ... 62
Table 6-7 Key relationships between crash causation, crash types, and countermeasures for lane- and road-departure crashes ... 64
Table 6-8 Crash mechanisms and crash attributes addressed in analysis ... 65
Table 6-9 Simulation activity outputs to the post-simulation analysis stage ... 67
Table 6-10 Estimated benefits of lateral systems from simulation ... 70
Table 6-11 Lane departures by speed and direction ... 72
Table 6-12 Reasons for lane departures ... 74
Table 7-1 Basic description of the 5-second segments (n = 1,279). ... 79
Table 7-2 Means and standard deviations for the driving outcomes ... 80
Table 7-3 Frequency of distracted driving ... 81
Table 7-4 Frequency distribution of the leading activities demonstrated by teen passenger in the front seat ... 83
Table 9-1 Project research publications ... 88
Table A-1 Distribution of population by type of seat belt laws and current and predicted belt use rates. ... 101
Acronyms
ACC Adaptive cruise control
ADAS Advanced driver assistance system AEB Automatic emergency braking AIS Abbreviated Injury Scale CDS Crashworthiness Data System
CIB Crash imminent braking (now called AEB) DBS Dynamic brake support
EDR Electronic data recorder
FC Forward crash
FCAM Forward crash warning FCW Forward crash warning GDL Graduated driver licensing GES General Estimates System
IVBSS FOT Integrated Vehicle-Based Safety System Field Operational Test L/RD Lane- and/or road-departure
LCC Lane centering control
LDP Lane departure prevention system (now called LKA) LDW Lane departure warning
LKA Lane-keeping assist LTV Light trucks and vans
LV Lead vehicle
MAIS Maximum Abbreviated Injury Scale NASS National Automotive Sampling System NDS Naturalistic Driving Study
NHTSA National Highway Traffic Safety Administration NMVCCS National Motor Vehicle Crash Causation Study SHRP2 Strategic Highway Research Program - 2
1
Introduction
This is the final technical report for a grant entitled, “Crash Avoidance Systems: An Important Class of Electronic Control Systems,” awarded to the University of Michigan Transportation Research Institute (UMTRI) as part of the Toyota Class Action Settlement Safety Research and Education Program. This grant has supported a three-year research project involving an interdisciplinary team seeking to make a significant impact on the safety of automotive transportation by developing methods and specific findings to help the community determine the best suite of crash avoidance systems for real-world operations, while considering other approaches to reduce the target crash set.
This final technical report describes the research goals, methods, results, and findings from this project. The project also provides an online tool for public use that integrates effectiveness results so users can study how crash avoidance systems and other safety technologies, policies, or
behaviors may impact highway safety. Section 2 presents the high-level motivations and goals of the project, the structure of the research tasks (as originally proposed and as conducted), concepts behind the approaches taken, and the nature of the project outcomes.
Section 3 provides an overview of the model and associated online tool that provides the framework for the project. The UTMOST (Unified Theory for Mapping Opportunities for Safety Technology) tool is designed to allow visualization of the benefits of multiple safety countermeasures and to
understand how combinations of those countermeasures might influence the crash population. The project supported a major upgrade of the UTMOST model including the inclusion of several new modules with estimates of the safety benefits of several crash avoidance features, as well as effects of state laws on child restraint systems and teen graduated licensing.
Section 4 of this report documents the project efforts to improve the estimated effectiveness and safety benefits of forward crash avoidance and mitigation technologies (FCAM). Section 5 describes a significant human factors experiment to explore the effect of experience with active safety technologies on a driver’s mental model of those systems. Section 6 addresses effectiveness and safety benefits for lateral assist technologies, employing significant progress in aligning new insights into lane- and road-departure crashes with a simulation approach to estimating benefits of crash avoidance technologies.
Two efforts focusing on teen safety were completed, including an investigation of the effect of teen passengers on teen driver behaviors and performance, presented in Section 7, and the effect of different state graduated licensing policies on teen driver safety outcomes, presented in Section 8. Section 8 also addresses estimates of comprehensive benefits using the UTMOST framework, and the example used is how different sets of countermeasures affect the benefits for teens, including graduated licensing and crash avoidance systems.
The dissemination of this research is briefly described in Section 9, and Section 10 describes
2
Project Overview
2.1
Research Overview
Crash avoidance systems are intended to help drivers avoid or mitigate the severity of crashes by providing warnings or active control interventions. However, they are deployed in the context of a host of other safety countermeasures including legislation, roadway design, demographic
characteristics of occupants, and occupant protection technology. A major goal of this research program is to provide new knowledge, models, and tools to enable improved designs of automotive crash avoidance systems and more effective deployment strategies. To take a more comprehensive look at these systems, we consider in this approach other effects that influence crash types and mechanisms, whether those effects are via the use of other technologies, driver behavior differences, new public policies, driver demographics, or other influences.
More specifically, this research provides:
• Improved methods and a public tool for computing comprehensive benefits estimates for combinations of crash avoidance systems. UTMOST provides automakers and others with a decision-making tool to optimize the tradeoff between potential safety benefits and system costs.
• Methods and new results for estimating the potential safety benefits of both forward crash avoidance and mitigation systems as well as lane departure warning and prevention systems • Human factors experiments addressing whether additional information about crash
avoidance systems will improve drivers’ understanding and willingness to use the systems. • Work on understanding the unique considerations of teen drivers, including analysis of crash
data to estimate how safety may be impacted by specific elements of state laws addressing graduated driver licensing and child restraint systems.
• Research on driving performance effects, including effects of crash avoidance on driver performance.
• Research on evaluating active semi-automated lane keeping systems.
Together these activities are designed to inform crash avoidance system design, and to provide a way to simultaneously consider deployment of these devices and other approaches to improve highway safety.
The Unified Theory Mapping Opportunities for Safety Technology (UTMOST) model was initially developed in 2007 (Flannagan & Flannagan, 2007). The goal of UTMOST is to allow visualization of the benefits of multiple safety countermeasures, including those from all portions of the Haddon Matrix (Williams, 1999), to understand how combinations of those countermeasures might
• Crash type
• Crash characteristics • Direction of impact • Crash severity • Driver age • Occupant age • Restraint use
By separating these components in the model, we can implement countermeasures that influence any portion of the causal pathway. The crash avoidance countermeasures at the heart of this program generally prevent crashes, but in some cases, may mitigate crash severity (especially forward systems such as AEB or FCW). Other countermeasures, such as Graduated Driver Licensing (GDL) laws, influence specific driver demographic groups, while occupant protection measures such as airbags and seat belts influence injury risk but do not affect crash involvement.
Given the complexity of crash causation and the variety of measures being taken, it is important to be able to place the effects of vehicle technologies in the context of how prevalent the addressable crash type is, who is involved in such crashes, and what other measures might also influence those crashes. When a countermeasure or set of countermeasures is implemented in UTMOST, the problems that remain are highlighted, allowing the user to consider a suite of countermeasures that might most efficiently reduce a larger number of crashes and injuries.
While UTMOST is an effective integration and visualization tool, it does not itself estimate effectiveness of any countermeasure. Instead, effectiveness is an input to UTMOST. Much of this research project was thus aimed at estimating benefits of countermeasures to provide that input. A literature review was the starting point to gather information to form the basis for the work that followed. In particular, the literature review focused on several key areas: 1) existing estimates of safety benefits for a variety of countermeasures with special emphasis on lateral and forward crash avoidance systems; 2) methods used to estimate system effectiveness; 3) details of lateral and forward crash avoidance technologies themselves; 4) human factors issues that might influence effectiveness; and 5) the effects of different countermeasures on teen driver risk.
From a basis in the literature including our own previous work, we did extensive data-driven, simulation-based evaluations of the potential effectiveness of two classes of crash-avoidance technologies: forward crash avoidance and mitigation (FCAM) and lateral assist technologies. For FCAM, we extended simulation methods work from heavy trucks to light vehicles. We were also able to test different driver braking models and difference FCAM algorithms to understand the potential effectiveness range for these systems (and given human responses).
types, and we addressed these differences in the effectiveness estimations and the implementation in UTMOST. The lateral assist systems assessment approach combined analysis crash data, event-data-recorder (EDR) data, naturalistic driving data, and kinematic simulation to accomplish its goals. A major barrier to realizing the full potential of crash-avoidance technologies is, perhaps ironically, the driver. Whether the technology is a warning that relies on the driver to take proper action, an active vehicle control system that relies on the driver to not interfere inappropriately with its operation, or a driver assistance system that relies on the driver to initiate action under appropriate conditions, the driver is an essential partner with these technologies. At the most basic level, the driver may turn off systems he/she does not understand or trust.
Figure 2-1 illustrates ways in which the human and the system may interact. The red boxes show factors that can influence the effectiveness of the system. Two of these,
training/experience/education and use, are key human factors.
Teens represent a special target group for this research project. Crash risk per mile is highest for teen drivers and the primary countermeasures in use are legislative (GDL). Crash avoidance
technologies have the potential to address crash types that teens are particularly prone to: rear-end collisions (as the striking vehicle) and road departure crashes. The specific driving challenges
experienced by teens and the potential benefit of crash-avoidance countermeasures were studied and compared to the effectiveness of existing legal countermeasures.
Finally, the results of each of the activities that composed this project were implemented in UTMOST. Effectiveness estimates from the simulations were implemented as the default
effectiveness values for those systems. The information from the human factors experiments does not generate specific numeric changes to the effectiveness estimates from the simulation studies. However, it does provide guidance on how training and experience choices might influence effectiveness. This information is implemented in the guidance to users in UTMOST. Finally, UTMOST has separate tabs for different age groups, so that the user can focus on the relative effectiveness of different countermeasures for a particular group such as teens.
2.2
Task Structure
The research tasks are shown below in Table 2.1. Task 1 consisted of a literature survey (reported in the first annual report) and also included program management. Task 2 addressed the initial year’s work on the UTMOST too that incorporated early effectiveness results from the project. Some of those results came from Task 3, which included some unique methods and improved models for a modified Monte Carlo approach to generating effectiveness data for FCAM technologies. (FCAM is identified to include forward crash warning (FCW) and automatic emergency braking (AEB), as shown in
Table 2-2
). Injury models were constructed to estimate potential safety benefits and integrated into UTMOST, as also depicted inFigure 2-2
.Task 4 consisted of an experiment in which drivers were exposed several times to advanced active safety technologies, in order to observe the effect of training and experience on a driver’s mental model for the system. Appropriate mental models reduce the risk of drivers misunderstanding the functionality and increasing the level of risk in driving.
Table 2-1 List of Technical Tasks
Task 1: Project Foundations
Task 2: UTMOST Phase I: Public Tool for Comprehensive Safety Benefits of Crash Avoidance Technologies Task 3: Forward Crash Avoidance and Mitigation Systems:
Benefits Estimation for Light Vehicles Task 4: Lateral Assist Systems: Human Factors
Experiments in Vehicles
Task 5: Lateral Assist Systems: Benefits Estimation for Light Vehicles
Task 6: Teen Driver Performance: Differences Impacting Potential Safety Benefits with Crash Avoidance Technology
Task 7: UTMOST Phase II: Assimilating New Findings and Added User Functions
[image:16.612.149.443.75.322.2]Task 8: Disseminating Research Findings
Table 2-2 Updated terminology for targeted technologies
Technology class Specific technology elements Crash types to address: FCAM – forward
collision avoidance and mitigation
Forward collision warning (FCW) and
automatic emergency braking (AEB). Crashing into the rear-end of other vehicles
Lateral assistance
Figure 2-2 Overall project activities
Task 6 consisted of two separate studies on teen drivers. The first investigated the role of state laws in reducing teen driver-related crash harm. This was done by relating specific elements of such laws to changes in state crash outcomes. The second study used naturalistic data with teenagers to understand basic influences of teen passengers on surrogate measures of safety. Prior crash data analyses demonstrate that teen passengers can introduce added risk; this study sought to understand the mechanism.
In Task 7, the UTMOST system was upgraded with new mathematical models representing improved ways of combining different influences. This has resulted in a major new release, and represents a substantial step forward in the allowing the safety community to make efficient choices to
accelerate safety in the US. Task 8 disseminates sharing information from this large project with the public as well as safety professionals and decision-makers.
3
Task 2: UTMOST Development
3.1
UTMOST Background
The Unified Theory Mapping Opportunities for Safety Technology (UTMOST) model was
initially developed in 2007 (Flannagan & Flannagan, 2007). The goal of UTMOST is to allow
visualization of the benefits of multiple safety countermeasures, including those from all
portions of the Haddon Matrix (Williams, 1999), to understand how combinations of those
countermeasures might influence the crash population.
The underlying model for UTMOST separates the causal components of crashes to allow
estimation of the influences of different types of countermeasures on the appropriate
causal components. Separable causal components include:
•
Crash type (e.g., influenced by crash-avoidance systems such as lane-departure
warning)
•
Crash characteristics (e.g., alcohol involvement, time of day)
•
Direction of impact (influences crash severity and injury risk)
•
Crash severity (influences injury outcomes)
•
Driver age (e.g., influenced by legislation)
•
Occupant age (influences injury risk)
•
Restraint use (influences injury risk)
To populate these components with data, we use a combination of national datasets. First,
the 2013-2015 National Automotive Sampling System—General Estimates System
(NASS-GES) dataset was used to create a table of person counts. For each combination of crash
type, crash direction, and alcohol, the crash severity distribution was calculated using a
method described in Flannagan (2013) using NASS-GES as well. Injury risk curves were
modeled using the 2010-2015 National Automotive Sampling System—Crashworthiness
Data System (NASS-CDS) dataset. Details are in the next subsections.
3.1.1 Crash Distribution and Delta-V
Crash avoidance technologies typically apply to crashes defined according to the action that
caused the crash, such as run-off road or backing. For this study, the 37 types of crashes
proposed by Najm, Smith, and Yanigasawa (2007) were collapsed to a set of 25 types of
crashes. The reduction collapses crash types that are very similar with respect to damage
and crash types that have too few cases to analyze separately (collectively called “Other”
crashes). Within each of these 25 types of crashes, we must account for the resulting
rear damage to the striking vehicle and frontal or side damage to the struck vehicle, and
most animal crashes involve frontal damage to the striking vehicle.
The NASS-GES dataset was analyzed to develop a baseline distribution of crashes according
to the following variables:
•
Overall crash direction (front, near-side, far-side, rear, rollover, pedestrian,
pedalcyclist, motorcyclist, and other)
•
Crash type or mechanism (run-off-road, backing, etc.)
•
Occupant age group: (0-1,2-4,5-7,8-10,11-13,14-15,16-17,16-20,21-65,66+)
•
Occupant gender (Male, Female)
•
Driver age group (<16,16-17,18-20,21-25,25-65,66+)
•
Driver gender (Male, Female)
•
Driver alcohol involvement (Yes, No)
•
Light condition (light [includes dusk and dawn], dark, dark but lighted,
other/unknown)
•
Pedestrian alcohol involvement (Yes, No for pedestrians only)
•
Vehicle type (Passenger car, SUV, Van, Pickup, Pedalcyclist, Motorcyclist, Pedestrian,
Other)
The cross-tabulation of these variables produces a table of 43,658 rows. Each row contains
the annual number of occupants in crashes that occur involving each combination of
variables. The mean and standard distribution of delta V (crash severity in mph) are
provided for each row except for pedestrian, pedalcyclist, motorcyclist, and rollover
crashes. Delta-V distribution varies with crash type, crash direction, and alcohol
involvement.
3.1.2 Injury Risk: Vehicle Occupants in Frontal, Near-Side, Far-side, and Rear Impacts
Injury risk models for use in the software tool were developed using the NASS-CDS
database. A dataset was constructed for analysis using case years from 2002-2010 and
limiting vehicle model years to those less than 10 years old relative to each case year.
Pregnant occupants were not included, nor were children under 14. Occupants wearing
3-point belts or not using belts were included; those with lap belt only or shoulder belt only
were not. Seating position was classified as driver, front passenger (including the few front
center positions), and rear passenger.
•
delta V (expressed as ln [delta V])
•
Occupant age and gender
•
Belt restraint (yes/no)
•
Vehicle type (passenger car vs. other)
•
Alcohol involvement
3.1.3 Injury risk: Rollover Crashes
Injury risk for rollover crashes was calculated using NASS-CDS, but only considered occupant
age and belt use as predictors, because delta-V is not estimated in rollovers. Risk of injury in
rollovers was estimated using 2000-2010 NASS-CDS data as a function of occupant belt use
and age.
3.1.4 Injury Risk: Pedicyclists and Motorcyclists
The NASS-GES database from 2000-2010 was used to estimate the risk of pedestrian and
pedalcyclist injury, given that a pedestrian or pedalcyclist crash occurred, as a function of
pedestrian/pedalcyclist age, striking vehicle type, pedestrian/pedalcyclist alcohol use, and
light level as predictors. Motorcyclist injury risk was also calculated from this dataset, using
motorcyclist age, alcohol use, and light level as predictors.
Because NASS-GES categorizes injury severity using the KABCO scale rather than an AIS
value, injury models were developed for pedicyclists and motorcyclists to predict the
likelihood of a K or A injury. Then, using relationships between AIS and KABCO in NASS-CDS,
a scale factor was derived to translate risk of KA injury into risk of AIS3+ injury.
3.1.5 Injury Risk: Restraints
Restraint effectiveness was evaluated separately for children (by age group and child
restraint type), motorcyclists (helmet use), and vehicle occupants age 14+. For vehicle
occupants age 14+, the effect of using a lap/shoulder belt was estimated using NASS-CDS.
For motorcyclists and children, it was necessary to use NASS-GES to obtain enough sample
size to conduct analyses. For the NASS-GES analyses, K or A injury (Killed or Suspected
Serious Injury) was used as the outcome of interest rather than MAIS3+. This will, in
general, overestimate injury risk, but total injuries were adjusted to account for this. For
each of these groups, the current use rates of restraints were established as the baseline
corresponding to current injury outcomes in the crash data, and the risk models were
implemented as adjustments to the current rates.
3.2
Countermeasures
understand the role of these technologies in improving safety, it is important to be able to place the effects of crash avoidance systems in the context of many other types of countermeasures. In particular, for teens, most countermeasures involve legislation of licensing. Thus, we developed models of legislative countermeasures, crash-avoidance countermeasures, and restraint
countermeasures.
3.2.1 Crash Avoidance Technologies
In UTMOST, each crash-avoidance technology is implemented as a reduction in the number of people involved in certain relevant crash types. Based on the effectiveness literature, we identify the crash type(s) influenced by each technology and the default effectiveness. If a technology is 25% effective, then it results in a reduction of 25% of relevant crashes. However, if more than one technology influences the same crash type, the effectivenesses do not add. If, for example, Technology 1 reduces a crash type by 25% and Technology 2 reduces the same crash type by 50%, then the combined effectiveness is 1-(1-0.25)*(1-0.5)=62.5% rather than 75%. Benefits estimates from the results of work in this study (discussed in later chapters) were implemented in UTMOST as default levels of effectiveness.
Table 3-1 Updated technologies available for selection, default value of
effectiveness, applicable crash types, and sources.
Crash Avoidance technology
Relevant Crash Types
Lane departure warning
Head-on (from lane drift); Run-off-road
Adaptive cruise control
Rear-end crashes
Alcohol interlock
Alcohol involved
Electronic Stability Control
Single-vehicle run-off-road crashes rollovers
Frontal collision warning
Rear-end crashes, object crashes
Intelligent lighting systems
Pedestrian/cyclist low-visibility crashes
Lane change warning
Drifting and lane change crashes
Lane keeping assistance
Head-on collisions from lane drift, sideswipe crashes,
run-off-road crashes
Pedestrian detection system
Pedestrian crashes
Reverse collision warning system
Backing crashes
3.2.2 Mitigation Effects
[image:23.612.100.500.366.618.2]For some crash-avoidance technologies, such as forward collision warning and automatic
emergency braking, the system may mitigate the severity of some crashes without fully
avoiding the crash. To implement this effect, we subtract a constant from delta-V. Since
delta-V is represented as a distribution of values for each row, this amounts to a left shift of
the entire distribution by a fixed value. Subtracting a value will result in some crashes
having negative delta-V, which represents a crash that has been avoided.
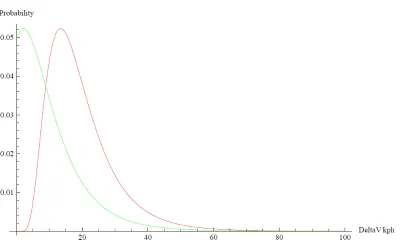
Figure 3-1
illustrates the mitigation process. The red curve represents the original delta-V
distribution for one row in the table (e.g., rear-end crash with frontal damage, no alcohol
involved). If a crash avoidance technology reduces delta-V by 10 mph on average, the
resulting distribution of delta-V will be shifted to the left as illustrated by the green curve.
All crashes that were originally below 10 mph delta-V would be avoided and the remaining
crashes will be less severe. The selection of 10 mph is determined by the crash avoidance
effectiveness estimate, which will be equal to the area to the left of 0 (i.e., avoided crashes)
in the shifted distribution.
Figure 3-1 Illustration of delta-V shift for mitigated crashes
3.2.3 Effects of Legislation
Legislation is a common approach to improving traffic safety. Notably, the primary
4
Task 3: Forward Crash Avoidance & Mitigation –
Effectiveness and Benefits Estimation
The objective of this task is to estimate the effectiveness and potential safety benefits of the FCAM systems. The section begins with a description of forward crashes, including some new material from using the General Estimate Systems (GES) database, as well as new work with electronic data recorders from the US Crashworthiness Data System and SHRP2 data. The method used to compute FCAM effectiveness and benefits is described below. Final analysis of data is underway, so there are no findings presented at this time.
4.1
Characteristics of Forward Crashes using the GES
The estimation of potential safety benefits for a countermeasure begins by investigating the crash problem that might be addressed with the countermeasure. For FCAM systems, the crash analysis focused on crashes into same-direction vehicles located in the travel lane of the striking vehicle. For this study, the interest is in light vehicles striking other vehicles. Light vehicles include all passenger cars as well as light trucks and vans (which includes SUVs, minivans, standard vans, and light duty pickups); this is the definition used by NHTSA. This report refers to this set of light vehicles, trucks, and vans as “LTVs.” In addition, since the analysis addressed driver interventions, particularly FCAM systems, crashes in which the driver was impaired by alcohol or drugs were excluded.
The crash analysis used the NASS-GES data. The GES file is compiled by the National Highway Traffic Safety Administration (NHTSA) from a nationally-representative sample of police-reported crashes. GES data are the standard source for crashes of all severities on U.S. roads. The GES data include a significant amount of detail on the vehicles and drivers involved, the crash environment, as well as details of the events of the crashes. Crash data from 2011 to 2013 were used to develop the estimates of crash types relevant to FCAM systems.
As earlier literature has shown, FC events are geometrically simple, with scenarios differentiated by the pre-crash motion of the lead vehicle (LV). The subsets of FC crashes are (a) LV stopped, (b) LV travelling at a steady pace but slower than the striking vehicle, (c) LV decelerating in front of the striking vehicle, and (d) LV cutting in front of the striking vehicle. Crash types were identified in GES using the ACC_TYPE variable for the striking vehicle and the pre-crash maneuver (P_CRASH1) variable for the LV. The LV motion is indicated on police reports and transferred into the GES file. There is no independent verification of LV motion, and in the case of vehicles coded as stopped at impact, there is some reason to question whether the vehicles were truly stopped. Analysis of similar crashes involving truck-striking crashes showed that about 20% of vehicles coded as stopped in fatal crashes, and up to 60% of the vehicles in nonfatal crashes, were likely in motion as the striking vehicle approached (Woodrooffe, Blower et al. 2012).
66.3% of these crashes, with 23.2% reported as LV decelerating. The LV slower and LV cut-in types represented 9.9% and 0.6%, respectively. LV cut-in was rare.
Table 4-1 Annual average forward crash types
FC crash
involvements N % LV stopped 1,031,770 66.3 LV slower 154,610 9.9 LV decelerating 360,030 23.2 LV cut-in 8,770 0.6 Total 1,555,180 100.0
The FC crash set was studied by analyzing these crash types. The details of the analysis are included in Appendix B, but the highlights of the remaining analyses follow:
• FC crashes tended to be less severe in terms of fatalities and serious injuries than other crash types. Nevertheless, about 828 persons were killed annually and 18,752 suffered incapacitating injuries in these crashes.
• In most (75-80%) FC crash involvements, the striking vehicles were simply going straight immediately prior to the crashes. In about 7.7%, the striking vehicles were just starting in lane, suggesting that these crashes occurred in stop-and-go traffic. A small percentage occurred immediately after the striking vehicles changed lanes, so the drivers may not have anticipated that the lanes were occupied. However, in the large majority of FC crashes, striking vehicles were simply lane-keeping prior to colliding with forward vehicles in their lanes.
• More often than other crash types, FC crashes occurred in daylight and not in darkness. About 15.8% occurred in dark conditions, compared with 23.5% of other crashes. LV-slower crashes were more likely in darkness than the other FC types, suggesting that the LV-slower type may have occurred more often in rural areas, and of course at night. In these
conditions, reduced sight distances in darkness may have contributed to the crashes. • With respect to the speed limit of the roads, FC crashes tended to occur on higher speed
roads compared with other crash types. Most (64.7%) occurred on roads with speed limits 35 to 50 mph. Crashes in which the LV was coded as stopped were somewhat more likely on lower speed roads than the other FC types, probably because this type was more likely in stop-and-go traffic.
• Drivers aged 25 and younger were significantly overinvolved in FC crashes, particularly where the LV was coded as stopped. FC crashes accounted for almost 25% of the LTV involvements of drivers under 18, compared with 17.6% of all LTV drivers. Older drivers were substantially under-involved (12.5%).
slower, and 20.7% of LV decelerating. These percentages compare with only 7.7% of LTV involvements in all other crash types.
In summary, the large majority of FC events represent a rather straightforward set of characteristics that would seem to be addressable with FCAM technologies. The next section describes the safety benefits methodology.
4.2
Forward Crash Characteristics using Electronic Data Recorders from
CDS and SHRP2
Data from Event Data Recorders (EDRs) were used for detailed information on driver behavior prior to FC crashes, primarily whether and how drivers braked prior to impact. EDRs record a time-series of data on vehicle state prior to and up to some triggering event. In the current case, the triggering event was a crash. EDRs typically retain data for a short period (e.g., 5s.) prior to the triggering event. The data are recorded at a rate of every second or less (e.g., 0.5s, 0.1s) up to the triggering event, and include information such as vehicle speed, brake status (on/off), accelerator status, engine speed, steering wheel angle, and so on. Information such as whether the driver braked, how long before impact, and braking profile prior to impact can be extracted from the EDR time-series data.
The EDR data used here were retrieved from two sources. The first was the NASS CDS, often called just CDS. The CDS data are from a sample of relatively late-model light vehicle crashes in which at least one vehicle was towed. Researchers perform an in-depth data collection on each crash, and collect a standard set of crash variables that matched the data in GES (which is complementary to CDS). The fact that CDS uses the same set of variables as GES to capture pre-crash maneuvers and crash geometry means that it was possible to identify precisely the same types of crashes as were used in the FC crash description elsewhere in this report.
Some of the vehicles in the CDS data were equipped with EDRs, and the data from those vehicles were available in the form of Portable Document Format (pdf) documents. Data were retrieved from and built into analytical files. Data on braking and vehicle speed at different time points were used to compute levels of deceleration in g’s, and to construct braking profiles of the striking vehicle in FC crashes. These data were used in simulations of different FC crash types to estimate the
effectiveness of different interventions.
Figure 4-1 Percent striking vehicles that did not brake prior to impact, by FC crash type Striking vehicle drivers also tended to brake late. Figure 4-2 shows the distribution of seconds prior to impact at which drivers first applied the brakes. For the LV-stopped crash type, the mode (most frequent value) was 1 second prior to impact. For the LV-decelerating type, it was 0.5 seconds.
Table 4-2 Deceleration in
g
’s for striking vehicles that braked
FC type N Mean Std. dev Max Min LV stopped 80 -0.34 0.28 -0.87 0.00 LV slower 9 -0.25 0.28 -0.77 0.00 LV decel 17 -0.36 0.32 -0.91 0.00 All FC 106 -0.34 0.29 -0.91 0.00
Figure 4-3 shows the speed profile for FC crash events extracted from EDRs in the CDS data. Profiles were categorized by the number of seconds prior to collision at which drivers initiated braking. The red line shows drivers who never braked at all. In addition, deceleration rates for the last second prior to impact are shown. The profiles for 1s, 2s, and 3s show that deceleration levels of 0.5g to 0.55g were achieved immediately prior to impact, but braking levels were much lower for the other profiles. When they braked, drivers tended to brake late, and many failed to brake as hard as they could have.
[image:29.612.86.473.346.549.2]Figure 4-3 Speed profile for FC crashes by brake initiation
The second source of EDR data analyzed was from the Strategic Highway Research Program 2 (SHRP-2) Naturalistic Driving Study (NDS). In the SHRP-2 project, over 2,000 subjects participated. Their vehicles were instrumented to record a wide variety of data, including vehicle state and condition, driver actions, and video of the driver and the scene outside the vehicles. The vehicles were used by the participants as they normally would. Participants were enrolled in the program for a year or more, so many vehicle-years of data were collected, including some crashes. EDR data were extracted for 45 FC crashes to further characterize how drivers react in FC crash events.
50 40 30 20 10 Av er age S peed, m ph
-5 -4 -3 -2 -1
Time prior to Event, s Brake duration; Count; Slope last sec
0 s; n=31; -2 to -1 s Ax = -.05 g 1 s; n=32; -2 to -1 s Ax = -.50 g 2 s; n=17; -2 to -1 s Ax = -.55 g 3 s; n=10; -2 to -1 s Ax = -.55 g 4 s; n=04; -2 to -1 s Ax = -.37 g 5 s; n=11; -2 to -1 s Ax = -.27 g
Speed Profile from 105 EDR Events
Review of the 45 FC crashes suggested that they could be grouped into five profiles: Ramp, Plunge-and-release, Plunge-and-hold, Plunge, and no reaction. In the Ramp profile, drivers braked early and gradually increased braking pressure. Plunge-and-release drivers braked hard initially, but then eased off on the brake pedal. Plunge-and-hold drivers hit the brakes hard and held the pressure. The Plunge drivers braked hard but collided almost immediately. Finally, the no-reaction drivers did not brake at all.
Figure 4-4 shows a set of statistics for the five braking profiles extracted from FC crashes in the SHRP-2 data. The proportion of drivers in the SHRP-2 dataset who failed to brake at all (10 of 45) is similar to the proportion in the CDS dataset (Figure 4-1). Thirteen of the 45 hit the brakes hard (Plunge), but then collided almost immediately. Brake-on duration for these drivers was the shortest (section B in the Figure), the time gap to the LV was the shortest of those that braked (D), and the range at brake application was the shortest at 2.7m. In contrast, the Ramp profile had the longest brake-on duration at 2.4s, the longest time gap (0.8s), and brakes were applied at the longest average distance (15.0m).
Figure 4-4 Selected statistics for braking profiles in FC crashes, SHRP-2 data
were disproportionately represented in the Plunge-and-release category, in which drivers braked hard, but then eased off and then often braking hard again before colliding. All of the profiles, of course, resulted in collisions, but there were striking differences in the (failed) strategies.
Figure 4-5. Driver gender by brake profile in FC crashes, SHRP-2 data
4.3
Simulation and Analysis Description
The light-vehicle frontal-collision prevention/mitigation simulation is based on previous work in the heavy-truck domain (Woodruff et al., 2011). The simulation approach is based on the assumption that rear-end crashes generally arise from normal initial vehicle-following conditions, but because the driver fails to react in a timely manner to developing conflict conditions (e.g. lead vehicle slowing or stopped, or range closure due to speed differentials), a crash occurs. This delay by the driver is most often due to distraction or inattention, although environmental, vehicle brake and roadway conditions can also contribute to the event. The approach for creating simulated crashes from naturalistic driving data contains the following steps:
1) A large number of vehicle-following events (or “conflicts”) are identified within a driving dataset. Starting conditions included lead vehicle braking, lead vehicle moving slower, lead vehicle stopped, and cut-in/cut-out situations. Braking profiles are developed for human drivers and automatic emergency braking (AEB). The driver braking profile is developed from Event Data Recorder (EDR) and the SHRP2 NDS data. This is used in Step 3 for both baseline crashes and any driver response to warnings. The AEB braking profiles are developed from deceleration profiles of AEB test conducted by UMTRI against both a moving and stationary target, as part of previous projects using several production AEB systems.
of simulated rear-end crashes was developed representing a wide range of crash types (LV slower, decelerating etc.), severity levels (small to large impact speeds), and initial starting conditions (high and low speed).
3) For each simulated crash, timing algorithms and braking profiles (from Step 2) for AEB and forward collision warning (FCW) are implemented. For FCW, a distribution of driver brake reaction times is used. For AEB, the countermeasure operates independent of simulated driver actions.
4) For each simulated crash outcome with and without countermeasures, we apply a distribution of vehicle mass ratios obtained from a national crash dataset. The mass ratio determines the distribution of impact speed to each vehicle as follows:
𝑑𝑑𝑑𝑑1=𝑑𝑑 ∗(𝑚𝑚1𝑚𝑚+𝑚𝑚2 2)
𝑑𝑑𝑑𝑑2 =𝑑𝑑 ∗(𝑚𝑚1𝑚𝑚+𝑚𝑚1 2)
where dvi is the delta-V for vehicle i, v is the impact velocity for the crash, and miis the vehicle mass for vehicle i
5) To ensure that the baseline simulated database accurately represents the frequency distribution of crashes in the real world in terms of severity levels (i.e. delta v’s), weighting factors are developed from the delta-V distributions generated in the crash-data analysis task. The weighting factors are applied to each of the simulated crashes so that the delta-V distribution in the reference dataset matches the delta-V distribution from real world crashes.
A detailed description of the steps 1 through 4 is presented as Appendix C.
Driver warnings and automatic braking actions are initiated when specific kinematic threshold levels are met. These control algorithms include timing of warnings and automatic braking events as well as the braking deceleration levels (i.e., brake force). Algorithms typical of production systems as well as experimental algorithms with different characteristics can be implemented.
Within the computer simulation environment, the effects of driver warnings and/or automatic braking events can be evaluated as to whether that particular crash was prevented, or the degree to which impact severity (delta V) was reduced. To account for driver variability in responding to warnings, a distribution of reaction times was developed and applied to each of the simulated crashes. (See Appendix C for more details.)
4.4
Safety Benefits Analyses and Results
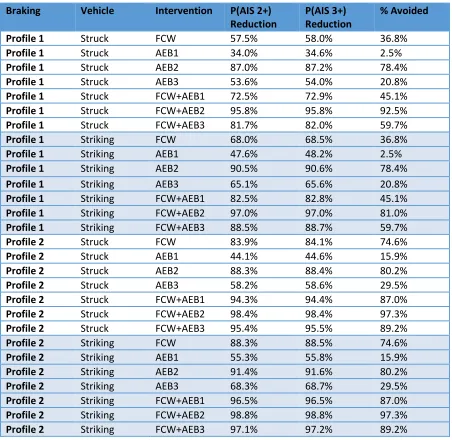
injuries and crashes avoided for the lead-vehicle braking scenario. Shaded sections distinguish reductions for struck and striking vehicles. Crashes avoided are the same for these vehicles since avoidance affects both equally. However, the injury risk profiles differ rear and frontal damage, so injury reductions are affected differently by the level of mitigation. The two driving braking profiles show that Profile 2 (harder braking) consistently leads to greater reductions compared to Profile 1, even for AEB. Finally, each section of the table shows results for seven different countermeasures: FCW alone (relying on driver braking response), three different AEB system algorithms, and the combination of FCW and AEB for the three algorithms.
Table 4-3 Simulation results for lead-vehicle braking scenario
Braking Vehicle Intervention P(AIS 2+)Reduction P(AIS 3+) Reduction % Avoided
Profile 1 Struck FCW 57.5% 58.0% 36.8%
Profile 1 Struck AEB1 34.0% 34.6% 2.5%
Profile 1 Struck AEB2 87.0% 87.2% 78.4%
Profile 1 Struck AEB3 53.6% 54.0% 20.8%
Profile 1 Struck FCW+AEB1 72.5% 72.9% 45.1%
Profile 1 Struck FCW+AEB2 95.8% 95.8% 92.5%
Profile 1 Struck FCW+AEB3 81.7% 82.0% 59.7%
Profile 1 Striking FCW 68.0% 68.5% 36.8%
Profile 1 Striking AEB1 47.6% 48.2% 2.5%
Profile 1 Striking AEB2 90.5% 90.6% 78.4%
Profile 1 Striking AEB3 65.1% 65.6% 20.8%
Profile 1 Striking FCW+AEB1 82.5% 82.8% 45.1%
Profile 1 Striking FCW+AEB2 97.0% 97.0% 81.0%
Profile 1 Striking FCW+AEB3 88.5% 88.7% 59.7%
Profile 2 Struck FCW 83.9% 84.1% 74.6%
Profile 2 Struck AEB1 44.1% 44.6% 15.9%
Profile 2 Struck AEB2 88.3% 88.4% 80.2%
Profile 2 Struck AEB3 58.2% 58.6% 29.5%
Profile 2 Struck FCW+AEB1 94.3% 94.4% 87.0%
Profile 2 Struck FCW+AEB2 98.4% 98.4% 97.3%
Profile 2 Struck FCW+AEB3 95.4% 95.5% 89.2%
Profile 2 Striking FCW 88.3% 88.5% 74.6%
Profile 2 Striking AEB1 55.3% 55.8% 15.9%
Profile 2 Striking AEB2 91.4% 91.6% 80.2%
Profile 2 Striking AEB3 68.3% 68.7% 29.5%
Profile 2 Striking FCW+AEB1 96.5% 96.5% 87.0%
Profile 2 Striking FCW+AEB2 98.8% 98.8% 97.3%
Table 4-4 Simulation results for lead-vehicle fixed (stopped) scenario
Braking Vehicle Intervention P(AIS 2+)Reduction P(AIS 3+) Reduction % Avoided
Profile 1 Struck FCW 96.9% 97.0% 95.2%
Profile 1 Struck AEB1 13.4% 13.9% 0.0%
Profile 1 Struck AEB2 89.7% 89.7% 86.4%
Profile 1 Struck AEB3 48.5% 49.1% 17.3%
Profile 1 Struck FCW+AEB1 95.9% 95.9% 95.2%
Profile 1 Struck FCW+AEB2 99.7% 99.7% 99.5%
Profile 1 Struck FCW+AEB3 97.7% 97.7% 96.1%
Profile 1 Striking FCW 97.8% 97.9% 95.2%
Profile 1 Striking AEB1 24.9% 25.7% 0.0%
Profile 1 Striking AEB2 90.0% 90.0% 86.4%
Profile 1 Striking AEB3 60.7% 61.2% 17.3%
Profile 1 Striking FCW+AEB1 96.6% 96.6% 95.2%
Profile 1 Striking FCW+AEB2 99.7% 99.7% 99.5%
Profile 1 Striking FCW+AEB3 98.4% 98.4% 96.1%
Profile 2 Struck FCW 84.5% 84.7% 77.5%
Profile 2 Struck AEB1 61.1% 61.4% 40.4%
Profile 2 Struck AEB2 96.9% 97.0% 94.1%
Profile 2 Struck AEB3 74.3% 74.6% 53.3%
Profile 2 Struck FCW+AEB1 97.7% 97.8% 94.6%
Profile 2 Struck FCW+AEB2 99.9% 99.9% 99.8%
Profile 2 Struck FCW+AEB3 98.7% 98.7% 96.6%
Profile 2 Striking FCW 88.2% 88.4% 77.5%
Profile 2 Striking AEB1 69.4% 69.7% 40.4%
Profile 2 Striking AEB2 98.0% 98.1% 94.1%
Profile 2 Striking AEB3 82.0% 82.3% 53.3%
Profile 2 Striking FCW+AEB1 98.8% 98.8% 94.6%
Profile 2 Striking FCW+AEB2 100.0% 100.0% 99.8%
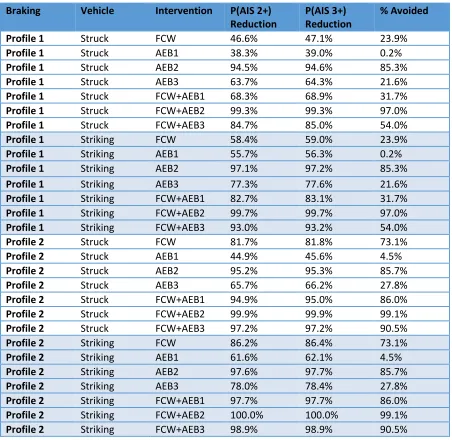
Table 4-5 Simulation results for lead-vehicle slower scenario
Braking Vehicle Intervention P(AIS 2+)Reduction P(AIS 3+) Reduction % Avoided
Profile 1 Struck FCW 46.6% 47.1% 23.9%
Profile 1 Struck AEB1 38.3% 39.0% 0.2%
Profile 1 Struck AEB2 94.5% 94.6% 85.3%
Profile 1 Struck AEB3 63.7% 64.3% 21.6%
Profile 1 Struck FCW+AEB1 68.3% 68.9% 31.7%
Profile 1 Struck FCW+AEB2 99.3% 99.3% 97.0%
Profile 1 Struck FCW+AEB3 84.7% 85.0% 54.0%
Profile 1 Striking FCW 58.4% 59.0% 23.9%
Profile 1 Striking AEB1 55.7% 56.3% 0.2%
Profile 1 Striking AEB2 97.1% 97.2% 85.3%
Profile 1 Striking AEB3 77.3% 77.6% 21.6%
Profile 1 Striking FCW+AEB1 82.7% 83.1% 31.7%
Profile 1 Striking FCW+AEB2 99.7% 99.7% 97.0%
Profile 1 Striking FCW+AEB3 93.0% 93.2% 54.0%
Profile 2 Struck FCW 81.7% 81.8% 73.1%
Profile 2 Struck AEB1 44.9% 45.6% 4.5%
Profile 2 Struck AEB2 95.2% 95.3% 85.7%
Profile 2 Struck AEB3 65.7% 66.2% 27.8%
Profile 2 Struck FCW+AEB1 94.9% 95.0% 86.0%
Profile 2 Struck FCW+AEB2 99.9% 99.9% 99.1%
Profile 2 Struck FCW+AEB3 97.2% 97.2% 90.5%
Profile 2 Striking FCW 86.2% 86.4% 73.1%
Profile 2 Striking AEB1 61.6% 62.1% 4.5%
Profile 2 Striking AEB2 97.6% 97.7% 85.7%
Profile 2 Striking AEB3 78.0% 78.4% 27.8%
Profile 2 Striking FCW+AEB1 97.7% 97.7% 86.0%
Profile 2 Striking FCW+AEB2 100.0% 100.0% 99.1%
Table 4-6 Simulation results for lead-vehicle cut-in (other) scenario
Braking Vehicle Intervention P(AIS 2+)Reduction P(AIS 3+) Reduction % Avoided
Profile 1 Struck FCW 38.3% 38.5% 22.9%
Profile 1 Struck AEB1 41.8% 42.4% 0.3%
Profile 1 Struck AEB2 97.8% 97.8% 89.9%
Profile 1 Struck AEB3 64.6% 65.1% 21.2%
Profile 1 Struck FCW+AEB1 64.9% 65.4% 30.5%
Profile 1 Struck FCW+AEB2 99.3% 99.3% 96.4%
Profile 1 Struck FCW+AEB3 80.3% 80.6% 51.3%
Profile 1 Striking FCW 45.0% 45.1% 22.9%
Profile 1 Striking AEB1 63.4% 63.8% 0.3%
Profile 1 Striking AEB2 99.3% 99.3% 89.9%
Profile 1 Striking AEB3 81.7% 81.9% 21.2%
Profile 1 Striking FCW+AEB1 79.6% 79.8% 30.5%
Profile 1 Striking FCW+AEB2 99.8% 99.8% 96.4%
Profile 1 Striking FCW+AEB3 90.3% 90.5% 51.3%
Profile 2 Struck FCW 75.0% 75.1% 67.5%
Profile 2 Struck AEB1 49.7% 50.3% 4.9%
Profile 2 Struck AEB2 97.7% 97.8% 89.9%
Profile 2 Struck AEB3 68.4% 68.8% 25.6%
Profile 2 Struck FCW+AEB1 92.9% 93.0% 82.6%
Profile 2 Struck FCW+AEB2 99.7% 99.7% 98.7%
Profile 2 Struck FCW+AEB3 95.3% 95.4% 86.5%
Profile 2 Striking FCW 78.0% 78.1% 67.5%
Profile 2 Striking AEB1 70.2% 70.6% 4.9%
Profile 2 Striking AEB2 99.3% 99.3% 89.9%
Profile 2 Striking AEB3 84.2% 84.4% 25.6%
Profile 2 Striking FCW+AEB1 96.3% 96.3% 82.6%
Profile 2 Striking FCW+AEB2 99.9% 99.9% 98.7%
Profile 2 Striking FCW+AEB3 97.9% 97.9% 86.5%
4.5
Implementation in UTMOST
Of the various system algorithms, we consider AEB1 to be the closest to current production systems. Driver braking profile 2 is the most similar to how drivers likely brake in panic situations on average, and it produces slightly conservative benefits estimates.
5
Task 4: Supplementing a Driver’s Understanding of an
Advanced Driver Assistance System (ADAS)
5.1
Introduction
Advanced driver assistance systems (ADAS) present a growing opportunity to improve driver safety by alerting drivers to dangerous conditions and relieving drivers of tedious control tasks through automation. However, the actual effectiveness of these systems for improving safety often depends on how drivers adapt their driving behavior to these systems, which in turn depends on how well drivers understand these systems. Current ADAS technologies include operating characteristics that often violate driver expectations or, at best, do not conform to a driver’s mental model of the system’s function. Several studies have documented instances in which drivers fail to recognize that an ADAS is functioning properly. For example, in simulator studies, drivers equipped with adaptive cruise control (ACC) were found to be generally slower than drivers equipped with manual control in reacting to critical traffic situations. These situations include abrupt lead vehicle braking, vehicle cut-ins, the sudden appearance of stationary vehicles on the roadway, and system failures (Bianchi Piccinini, Rodrigues, Leitão, & Simões, 2015; de Winter, Happee, Martens, & Stanton, 2014; Hoedemaeker & Brookhuis, 1998; Larsson, Kircher, & Andersson Hultgren, 2014; Nilsson, 1995; Stanton, Young, & McCaulder, 1997; Stanton, Young, Walker, Turner, & Randle, 2001; Vollrath, Schleicher, & Gelau, 2011; Young & Stanton, 2007). Nilsson (1995) observed later braking among ACC-equipped drivers approaching a stationary queue compared to manual driving. Stanton, Young, and McCaulder (1997) observed four of 12 drivers fail to regain control of their vehicle when the ACC system accelerated into a forward vehicle. Hoedemaeker and Brookhuis (1998) observed larger braking maximums and smaller minimum headway times for drivers equipped with ACC. Larsson, Kircher, & Andersson Hultgren (2014) observed longer brake reaction times in response to cut-ins with ACC compared to manual driving. A similar pattern was also observed in a test-track study of Rudin-Brown and Parker (2004) where drivers with ACC took about 2.6 to 2.8 s longer to react to a lead vehicle’s brake lights than when driving manually.
Recent theories of driver behavioral adaptation have suggested that drivers apply some form of attentional control policy/process to allocate and reallocate visual/cognitive resources to things that are important to the driver. This often occurs when a driver’s workload declines. A driver’s sense of workload is influenced by how much he or she believes that the ADAS technology has covered some part of the driving task. This belief is a direct consequence of what the driver believes the level of ADAS capability actually is—that is, the driver’s mental model of the ADAS functionality. Especially with short simulator-based or test-track exposures, drivers have relatively little experience with ADAS systems and appear to be poor at recognizing when an ADAS reaches a limit or malfunctions in an unanticipated way.
will try to match it to prior experience with a similar form of intelligent support—maybe even another human acting as an operator. This suggests that drivers may require substantially more time to develop an accurate understanding of an ADAS function, especially when the conditions where ADAS limitations are apparent are also uncommon. Longer-term studies of driver interaction with ADAS technologies thus seem warranted. Initially, this might help insure that the driver develops a reasonably accurate mental model of the ADAS capability. After stabilization of this mental model, continued observations may be warranted to investigate how driving behavior changes on the tactical and strategic levels. Recent work has begun to focus on longer observation periods to examine the evolution of trust and mental models (Beggiato & Krems, 2013) as well as the involvement of experienced users of the technology (Bianchi Piccinini et al., 2015).
For most drivers, the principal means used to describe the functions and limitations of an ADAS is primarily the owner’s manual or supplemental video instruction provided by vehicle manufacturers. While the information provided in these materials is usually detailed and complete, it is unclear how well this information is studied by new vehicle owners. It may well be that owner’s manual accounts of ADAS exceptions in functionality are not sufficiently salient to drivers, or that drivers
underestimate the complexity of ADAS technologies and assume no special effort is required to understand these new technologies. ADAS performance exceptions are thus unlikely to become fully integrated into the driver’s mental model of the ADAS. There is evidence that drivers often do not accurately remember this information even after receiving direct training (AAAFTS, 2008; Beggiato & Krems, 2013; Dickie & Boyle, 2009; Jenness, Lerner, Mazor, Osberg, & Tefft, 2008). If a driver’s mental model is flawed, it may be reflected in a driver’s use of an ADAS. Different flaws are likely to be manifest in different kinds of behavior adaptation. Thus, a behavior adaptation to ACC may result in a delay in braking because the driver’s mental model of ACC braking authority is based on the drivers knows he or she herself is able to do. Similarly, a behavior adaptation to active steering may result in lane departures on tightly curved roads, because the driver’s mental model of steering control is based on what the driver already knows about his or her own steering ability. A driver’s development of a flawed mental model can happen several ways. In some cases, the driver has limited information about the performance envelope of the ADAS. For example, while a driver may be cautioned about the limited braking authority of an ACC or limited steering authority of an LKA, these actual limits may not be clearly understood. In other cases, there are discontinuities in the ADAS behavior that depart from what might be considered a “natural” model. For example, drivers may be surprised by a steering assist system’s blindness to objects in the middle of the road, especially when the system seems to be clearly able to see lane lines so well. Many ACC systems do not react to stationary or approaching vehicles, but easily detect moving forward vehicles; they may also be blind to smaller objects in the roadway like motorcycles, bicycles, and pedestrians.
al., 2015). When a driver’s principal source of information about the operation of an ADAS is the owner’s manual, and boundary conditions are unlikely to be encountered during normal driving experience, it seems clear that gaps in a driver’s understanding of the system will commonly occur (Dickie & Boyle, 2009; Jenness et al., 2008). More troubling is that new gaps may also arise, as memories fade and are not reinforced by experience. Such knowledge gaps may result in the driver developing unrealistic expectations about the technology’s capability leaving drivers unprepared to take control when the technology falters (Merat, Jamson, Lai, Daly, & Carsten, 2014) or failing to recognize when a malfunction occurs (Strand, Nilsson, Karlsson, & Nilsson, 2014).
This study examines a driver’s mental model of two ADAS’s as drivers gain progressive experience with these systems implemented in two vehicle models over a