It is well known that hypertension prevalence is higher among African Americans than it is for any other race/ethnic group in the United States.1,2 Despite a growing body of research suggest-ing that social, environmental, and lifestyle factors may play an important role, the reasons for these disparities remain unclear.3–6 Understanding potential explanations for this variation within race/ethnic groups could help identify factors leading to hyper-tension and inform strategies to reduce racial/ethnic disparities.
Studies of race/ethnic differences in hypertension in the United States rarely investigate heterogeneity within groups,
although some research has suggested that important geo-graphic heterogeneity may exist. For example, evidence suggests that blacks and whites living in the South have higher hypertension prevalence and risk than those living in the rest of the country.7,8 In addition, a longitudinal study of young adults found that black men living in Chicago and Minneapolis were significantly less likely to develop elevated blood pressure lev-els over a 7-year period than black men living in Birmingham, after adjusting for education and established risk factors.9 A similar trend was observed among black women. Although no studies have investigated associations of region of birth with hypertension prevalence, being born in the South has been linked to increased cardiovascular disease mortality.10–12 However, the determinants of these geographic differences are not well understood.
Using data from black and white participants of the Multi-Ethnic Study of Atherosclerosis (MESA) we examined asso-ciations of region of birth and place of residence with the prevalence of hypertension. We also examined the contri-bution of the neighborhood environment, socioeconomic characteristics, and traditional hypertension risk factors to observed geographic differences. In addition, we explored how 1Center for Social Epidemiology and Population Health and Department of
Epidemiology, university of Michigan, School of Public Health, ann arbor, Michigan, uSa; 2Department of Preventive Medicine, northwestern university Feinberg School of Medicine, Chicago, Illinois, uSa; 3Department of Medicine, David Geffen School of Medicine, university of California, Los angeles, California, uSa; 4Division of Public Health Sciences, Department of Epidemiology and Prevention, Wake Forest university, Winston‑Salem, north Carolina, uSa; 5Department of Medicine, johns Hopkins university School of Medicine, johns Hopkins university, Baltimore, Maryland, uSa; 6Division of Epidemiology and Community Health, School of Public Health, university of Minnesota, Minneapolis and St Paul, Minnesota, uSa. Correspondence: Kiarri n. Kershaw (kkershaw@umich.edu)
Received 21 May 2009; first decision 15 July 2009; accepted 26 September 2009; advance online publication 12 November 2009. doi:10.1038/ajh.2009.211
© 2010 American Journal of Hypertension, Ltd.
Geographic Variation in Hypertension Prevalence
Among Blacks and Whites: The Multi-Ethnic
Study of Atherosclerosis
Kiarri N. Kershaw
1, Ana V. Diez Roux
1, Mercedes Carnethon
2, Christine Darwin
3, David C. Goff Jr
4,
Wendy Post
5, Pamela J. Schreiner
6and Karol Watson
3Background
Many studies have examined differences in hypertension across race/ ethnic groups but few have evaluated differences within groups.
Methods
We investigated within‑group geographic variations in hypertension prevalence among 3,322 black and white participants of the Multi‑ Ethnic Study of atherosclerosis (MESa). Place of birth and place of residence were included in multivariate Poisson regression analyses.
results
Blacks born in southern states were 1.11 (95% confidence interval (CI): 1.02, 1.23) times more likely to be hypertensive than non‑ southern states after adjusting for age and sex. Findings were similar, though not statistically significant, for whites (prevalence ratio (Pr): 1.15, 95% CI: 0.98, 1.35). Blacks and whites living in Forsyth (blacks, Pr: 1.23, 95% CI: 1.07, 1.42; whites, Pr: 1.32, 95% CI: 1.09, 1.60) and Baltimore (blacks, Pr: 1.14, 95% CI: 1.00, 1.31; whites, Pr: 1.24, 95%
CI: 1.05, 1.47) were also significantly more likely to be hypertensive than those living in Chicago after adjusting for age and sex. among blacks, those living in new york were also significantly more likely to be hypertensive. Geographic heterogeneity was partially explained by socioeconomic indicators, neighborhood characteristics or hypertension risk factors. There was also evidence of substantial heterogeneity in black–white differences depending on which geographic groups were compared (ranging from 82 to 13% higher prevalence in blacks compared with whites).
conclusions
a better understanding of geographic heterogeneity may inform interventions to reduce racial/ethnic disparities.
Keywords: blood pressure; disparity; epidemiology; geography; hypertension; neighborhoods
black–white differences in hypertension changed depending on which geographic subgroups were compared.
Methods
Study population. MESA is an observational cohort study designed to examine the determinants of subclinical cardio-vascular disease in adults aged 45–84 years.13 Participants free of clinical cardiovascular disease at baseline were recruited from six study sites (New York, New York; Baltimore City and County, Maryland; Forsyth County, North Carolina; Minneapolis, Minnesota; Los Angeles County, California; and Chicago, Illinois) between 2000 and 2002.13 This study used the cross-sectional data collected at baseline. At each site, ran-dom population samples were selected using various lists of area residents. Additional details are provided elsewhere.13 Of the selected persons deemed eligible after screening, 59.8% participated in the study. White participants were recruited from all six study sites; black participants were recruited from all sites except Minneapolis. In order to facilitate comparisons across race groups, these analyses are restricted to the five sites from which both groups were recruited. Institutional review board’s approval was obtained at each site and all participants gave informed consent. MESA participants represented four race/ethnic groups, but our analyses focused on self-identified blacks and whites only because data on Hispanics and Asian Americans were collected in fewer study sites.
Hypertension definition and measurement. Resting seated blood pressure was measured three times at a single baseline visit by trained and certified clinic staff using a Dinamap PRO 100 automated oscillometric device (Critikon, Tampa, FL), and the average of the last two measurements was used in the analyses.14 Hypertension was defined as having a mean systolic blood pressure ≥140 mm Hg, a mean diastolic blood pressure
≥90 mm Hg, or a self-reported history of hypertension and report of being on medication for it.15
Geographic measures. Participants were asked to report the state in which they were born. Place of birth was categorized as southern state, non-southern state, and foreign-born. The South is often defined as those states that seceded from the Union during the Civil War.16 One critique of such a catego-rization is that it fails to take into consideration the shared history and culture of certain states in the southern part of the country. In an attempt to account for this, we included the following as southern states in these analyses: Alabama, Arkansas, Florida, Georgia, Kentucky, Louisiana, Mississippi, North Carolina, Oklahoma, South Carolina, Tennessee, Texas, Virginia, and West Virginia. Given their physical and cultural distance from the Deep South, we did not include Delaware, Maryland, and District of Columbia (states that are considered the South by the US Census17) as southern states. Instead, we included them in the non-southern-born category. The for-eign-born category included all participants born outside the US. Place of residence was defined as the study site in which the participant lived at baseline: Forsyth County, North Carolina;
New York, New York; Baltimore City and County, Maryland; Chicago, Illinois; and Los Angeles, California.
Covariates. Several sets of covariates were examined as potential contributors to observed geographic differences including socioeconomic position (SEP); neighborhood factors; and tra-ditional risk factors for hypertension.
Individual SEP: parental education was categorized as less than high school, high school, and college or more. Education information was collected on both parents, and the educa-tion level of the parent with the higher level of attainment was used in the analyses. Individual education was measured as the highest level completed and categorized as high school or less, some college/technical school, and bachelors degree or more. Annual household income was grouped into quartiles (less than $25,000; $25,000–$39,999; $40,000–$74,999; and $75,000 and greater). Baseline income was available and used for 91.6% of black participants and 97.3% of white participants. When baseline income was missing, exam 2 data were used (5.1% of black participants and 1.4% of white participants).
Neighborhood environment: we examined four survey-based scale measures of the neighborhood environment previously shown to be associated with hypertension in this cohort18: neighborhood safety (three items), social cohesion (five items), walkability (six items), and healthy food availability (two items). Each participant’s scores were based on the average of the responses given by all other participants living within a mile of the participant, and higher scores represented better environments.
Because some of these neighborhood characteristics were highly correlated, these four scores were entered into a factor analysis with oblique rotation. Two factors were identified that accounted for 81.3% of the variation in the data. Factor one, the physical environment, included neighborhood walkability and healthy food availability. Factor two, the social environ-ment, consisted of neighborhood safety and social cohesion. Factor-based scores were created for the neighborhood physi-cal and social environments by summing the respective sphysi-cales within each factor. All factor loadings were comparable (physi-cal environment: 0.87, 0.93; social environment: 0.79, 0.88), so these scales were not weighted by their respective loadings. Number of years living in current neighborhood was included as a control variable to account for varying lengths of exposure to a given neighborhood environment.
Statistical analyses. Key covariates were compared across place of birth and place of residence using analysis of vari-ance and the χ2 statistic. Because hypertension is not a rare condition, the odds ratio is not a good approximation of the prevalence ratio (PR).19 As recommended in prior work,20,21 Poisson regression with robust variance estimates was used to estimate PRs of hypertension comparing the different place of birth (with US birth outside the South as the reference group) and place of residence (with Chicago as the reference group) categories. Although we did not find a statistically significant interaction between race/ethnicity and place of birth or place of residence, all analyses were conducted separately for white and black participants in order to assess within-race variation in hypertension by area and race-specific predictors. Models were sequentially adjusted for socioeconomic characteristics, neighborhood characteristics, and cardiovascular risk factors.
In addition, we conducted analyses pooling whites and blacks in order to contrast different race-geography combina-tions. We analyzed differences by place of birth and place of residence separately. We used two different reference groups for these analyses: whites born in/residing in the area with the highest hypertension prevalence and whites born in/resid-ing in the area with the lowest hypertension prevalence. This was done to investigate how contrasts between whites and blacks differ depending on which geographic subgroups are compared.
Of the 1,894 blacks and 2,018 whites living in the five MESA study sites at baseline, 324 blacks and 249 whites were miss-ing information on state of birth, parental or personal SEP, or neighborhood characteristics. An additional eight blacks and nine whites were missing data on body mass index or health behaviors, leaving 1,562 blacks and 1,760 whites for analysis. All analyses were conducted using SAS 9.2 (SAS, Cary, NC).
results
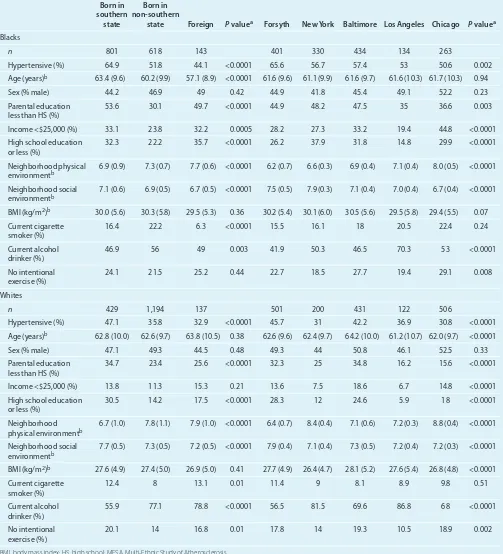
Descriptive statistics comparing covariates by place of birth and place of residence for blacks and whites are shown in Table 1. Most participants living in Forsyth at baseline were born in southern states (91.3%), and between 34.1 and 45.5% of those living in the other sites were born in southern states (data not shown). Unadjusted hypertension prevalence among blacks was highest in those born in the southern states and lowest among the foreign-born. Prevalence of hypertension was high-est among those living in Forsyth and lowhigh-est in those living in Chicago. Blacks born in southern states generally had the lowest levels of parental education and individual SEP whereas those born in non-southern states had the highest. New York residents had the lowest levels of parental education and individual edu-cation of all the sites, but the best reported neighborhood social environment. Those living in Chicago generally had the highest levels of parental education and individual SEP of all the sites, as well as the best neighborhood physical environment.
Hypertension prevalence among whites was lower than among blacks within every place of birth and place of residence category. Just over 67% of whites living in Forsyth were born in southern states (data not shown); a much smaller percentage
of whites living in the other sites were born in southern states (between 2.5 and 10.2%). Whites born in the South had the highest unadjusted hypertension prevalence and foreign-born whites had the lowest. As with blacks, whites living in Forsyth had the highest hypertension prevalence and those living in Chicago had the lowest. Whites born in non-southern states had the highest level of parental education and individual SEP, whereas those born in southern states had the lowest paren-tal and individual educational attainment. Whites living in Forsyth and Baltimore had the lowest parental education levels and individual SEP, whereas those in Los Angeles had the best. Chicago residents reported the best physical environments and Forsyth residents reported the best social environments.
Table 2 shows PRs of hypertension among blacks by place of birth and place of residence. Blacks born in southern states were 1.11 (95% confidence interval (CI): 1.01, 1.23) times more likely to be hypertensive than those born in non- southern states. This association was not substantially modified after adjustment for individual SEP and neighborhood characteris-tics (PR: 1.10, 95% CI: 0.99, 1.22). Further adjustment for risk factors had little effect. Blacks living in Forsyth (PR: 1.23, 95% CI: 1.07, 1.42), New York (PR: 1.16, 95% CI: 1.00, 1.34), and Baltimore (PR: 1.14, 95% CI: 1.00, 1.31) were all significantly more likely to be hypertensive than those living in Chicago. All associations were slightly attenuated after adjustment for indi-vidual SEP but a larger reduction in associations (especially for Forsyth) was observed when neighborhood characteristics were accounted for (Forsyth, PR: 1.13, 95% CI: 0.90, 1.42; New York, PR: 1.09, 95% CI: 0.94, 1.26; Baltimore, PR: 1.06, 95% CI: 0.89, 1.26). These associations were slightly reduced after addi-tional adjustment for hypertension risk factors.
Whites born in southern states were 1.15 (95% CI: 0.98, 1.35) times more likely to be hypertensive than those born in non-southern states (Table 3). This association was slightly attenu-ated with each subsequent adjustment for parental SEP and individual SEP, was not substantially modified after adjustment for neighborhood characteristics, and increased after adjust-ment for hypertension risk factors (PR: 1.17, 95% CI: 1.00, 1.38). Whites living in Forsyth (PR: 1.32, 95% CI: 1.09, 1.60) and Baltimore (PR: 1.24, 95% CI: 1.05, 1.47) had significantly higher hypertension prevalence compared with those living in Chicago. Los Angeles residents also had higher hypertension prevalence than those in Chicago, though this association was not statistically significant (PR: 1.20, 95% CI: 0.93, 1.56), pos-sibly due to the smaller sample size. These associations were weakened after adjusting for parental and individual SEP but were strengthened after subsequent adjustment for neighbor-hood characteristics.
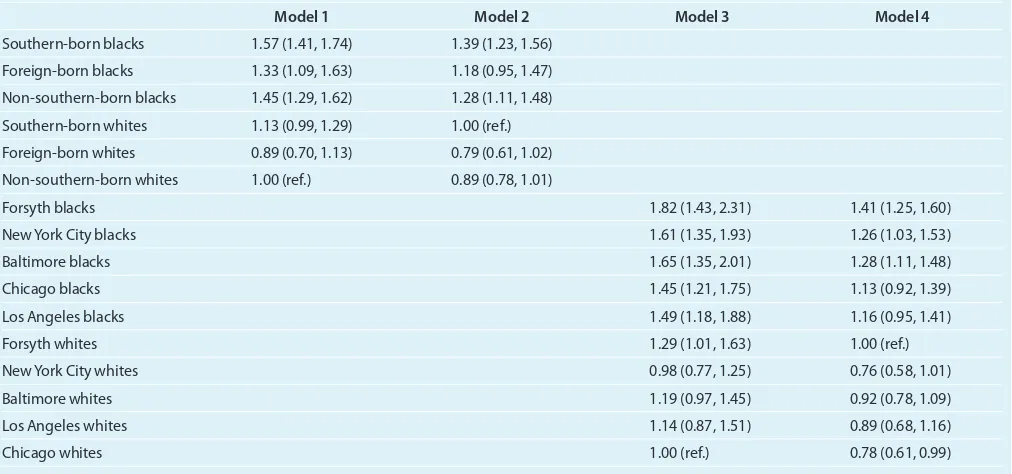
depending on which subgroups of blacks and whites are com-pared. Substantial variability exists when subgroups when dif-ferent places of birth are compared: the largest race difference was observed when blacks born in the southern states were
[image:4.594.47.550.98.652.2]compared with non-southern-born whites (model 1, PR: 1.57, 95% CI: 1.41, 1.74). In contrast, a much smaller race difference was observed when foreign-born blacks were compared with southern-born whites (model 2, PR 1.18, 95% CI: 0.95, 1.47).
table 1 | selected socioeconomic, neighborhood, and risk factor characteristics of blacks and whites by place of birth and place of residence, the Mesa study 2000–2002
Born in southern
state
Born in non-southern
state Foreign P valuea Forsyth New York Baltimore Los Angeles Chicago P valuea
Blacks
n 801 618 143 401 330 434 134 263
Hypertensive (%) 64.9 51.8 44.1 <0.0001 65.6 56.7 57.4 53 50.6 0.002
age (years)b 63.4 (9.6) 60.2 (9.9) 57.1 (8.9) <0.0001 61.6 (9.6) 61.1 (9.9) 61.6 (9.7) 61.6 (10.3) 61.7 (10.3) 0.94
Sex (% male) 44.2 46.9 49 0.42 44.9 41.8 45.4 49.1 52.2 0.23
Parental education less than HS (%)
53.6 30.1 49.7 <0.0001 44.9 48.2 47.5 35 36.6 0.003
Income <$25,000 (%) 33.1 23.8 32.2 0.0005 28.2 27.3 33.2 19.4 44.8 <0.0001
High school education
or less (%) 32.3 22.2 35.7 <0.0001 26.2 37.9 31.8 14.8 29.9 <0.0001
neighborhood physical
environmentb 6.9 (0.9) 7.3 (0.7) 7.7 (0.6) <0.0001 6.2 (0.7) 6.6 (0.3) 6.9 (0.4) 7.1 (0.4) 8.0 (0.5) <0.0001 neighborhood social
environmentb 7.1 (0.6) 6.9 (0.5) 6.7 (0.5) <0.0001 7.5 (0.5) 7.9 (0.3) 7.1 (0.4) 7.0 (0.4) 6.7 (0.4) <0.0001 BMI (kg/m2)b 30.0 (5.6) 30.3 (5.8) 29.5 (5.3) 0.36 30.2 (5.4) 30.1 (6.0) 30.5 (5.6) 29.5 (5.8) 29.4 (5.5) 0.07 Current cigarette
smoker (%) 16.4 22.2 6.3 <0.0001 15.5 16.1 18 20.5 22.4 0.24
Current alcohol
drinker (%) 46.9 56 49 0.003 41.9 50.3 46.5 70.3 53 <0.0001
no intentional
exercise (%) 24.1 21.5 25.2 0.44 22.7 18.5 27.7 19.4 29.1 0.008
Whites
n 429 1,194 137 501 200 431 122 506
Hypertensive (%) 47.1 35.8 32.9 <0.0001 45.7 31 42.2 36.9 30.8 <0.0001
age (years)b 62.8 (10.0) 62.6 (9.7) 63.8 (10.5) 0.38 62.6 (9.6) 62.4 (9.7) 64.2 (10.0) 61.2 (10.7) 62.0 (9.7) <0.0001
Sex (% male) 47.1 49.3 44.5 0.48 49.3 44 50.8 46.1 52.5 0.33
Parental education
less than HS (%) 34.7 23.4 25.6 <0.0001 32.3 25 34.8 16.2 15.6 <0.0001
Income <$25,000 (%) 13.8 11.3 15.3 0.21 13.6 7.5 18.6 6.7 14.8 <0.0001
High school education
or less (%) 30.5 14.2 17.5 <0.0001 28.3 12 24.6 5.9 18 <0.0001
neighborhood
physical environmentb 6.7 (1.0) 7.8 (1.1) 7.9 (1.0) <0.0001 6.4 (0.7) 8.4 (0.4) 7.1 (0.6) 7.2 (0.3) 8.8 (0.4) <0.0001 neighborhood social
environmentb 7.7 (0.5) 7.3 (0.5) 7.2 (0.5) <0.0001 7.9 (0.4) 7.1 (0.4) 7.3 (0.5) 7.2 (0.4) 7.2 (0.3) <0.0001 BMI (kg/m2)b 27.6 (4.9) 27.4 (5.0) 26.9 (5.0) 0.41 27.7 (4.9) 26.4 (4.7) 28.1 (5.2) 27.6 (5.4) 26.8 (4.8) <0.0001 Current cigarette
smoker (%)
12.4 8 13.1 0.01 11.4 9 8.1 8.9 9.8 0.51
Current alcohol
drinker (%) 55.9 77.1 78.8 <0.0001 56.5 81.5 69.6 86.8 68 <0.0001
no intentional
exercise (%) 20.1 14 16.8 0.01 17.8 14 19.3 10.5 18.9 0.002
BMI, body mass index; HS, high school; MESA, Multi-Ethnic Study of Atherosclerosis.
The most extreme race difference was observed when Forsyth blacks are compared with Chicago whites (PR: 1.82, 95% CI: 1.43, 2.31) whereas the smallest difference was observed when Chicago blacks are compared with Forsyth whites (PR: 1.13, 95% CI: 0.92, 1.39).
discussion
Our findings confirm that there is important geographic vari-ation in hypertension prevalence among US blacks and whites. Hypertension prevalence was higher among blacks born in southern states than those born in non-southern states, and was significantly higher among blacks living in Forsyth, Baltimore and New York than in those living in Chicago. Important heterogeneity was also observed in whites: Southern-born whites had marginally higher hypertension prevalence than non- southern-born whites and whites living in Forsyth and Baltimore had significantly higher hypertension prevalence than those in Chicago. Adjustment for SEP and neighborhood characteristics reduced many of these associations. Additional
adjustment for hypertension risk factors generally had little impact.
[image:5.594.46.552.98.467.2]An important consequence of this geographic heterogeneity is that differences in hypertension prevalence between blacks and whites are not constant but vary substantially depend-ing on which geographic groups are compared. In a model adjusted for demographics, parental and individual SEP, and neighborhood characteristics, hypertension prevalence was 57% higher among southern-born blacks compared with non-southern-born whites. In contrast, hypertension prevalence was only 18% higher among foreign-born blacks compared with southern-born whites. The differences were even more striking when comparing race differences in hypertension prevalence across place of residence. Hypertension prevalence was 82% higher among blacks living in Forsyth compared with whites living in Chicago. On the other hand, hyperten-sion prevalence was just 13% higher among blacks living in Chicago compared with whites living in Forsyth, a difference similar to within-race differences in hypertension prevalence
table 2 | Prevalence ratios of hypertension among blacks by place of birth and place of residence before and after adjustment for socioeconomic factors, neighborhood characteristics, and hypertension risk factors
Model 1a Model 2a Model 3a Model 4b Model 5c
Born in southern state 1.11 (1.01, 1.23) 1.11 (1.00, 1.23) 1.10 (1.00, 1.22) 1.10 (0.99, 1.22) 1.10 (0.99, 1.22) Foreign‑born 0.90 (0.74, 1.09) 0.90 (0.74, 1.10) 0.88 (0.72, 1.07) 0.88 (0.72, 1.07) 0.87 (0.72, 1.06) uS‑born, non‑southern
state 1.00 (ref.) 1.00 (ref.) 1.00 (ref.) 1.00 (ref.) 1.00 (ref.)
Forsyth 1.23 (1.07, 1.42) 1.24 (1.07, 1.42) 1.20 (1.04, 1.38) 1.13 (0.90, 1.42) 1.10 (0.88, 1.38)
new york 1.16 (1.00, 1.34) 1.16 (1.00, 1.34) 1.09 (0.94, 1.26) 1.09 (0.94, 1.26) 1.06 (0.92, 1.23) Baltimore 1.14 (1.00, 1.31) 1.14 (0.99, 1.31) 1.10 (0.96, 1.27) 1.06 (0.89, 1.26) 1.03 (0.87, 1.23) Los angeles 1.05 (0.86, 1.26) 1.05 (0.87, 1.27) 1.00 (0.83, 1.21) 0.97 (0.79, 1.20) 0.97 (0.79, 1.19)
Chicago 1.00 (ref.) 1.00 (ref.) 1.00 (ref.) 1.00 (ref.) 1.00 (ref.)
Parental education
less than HS 1.07 (0.94, 1.23) 1.04 (0.90, 1.19) 1.03 (0.90, 1.19) 1.02 (0.89, 1.17)
Parental education HS complete
1.09 (0.95, 1.24) 1.08 (0.94, 1.23) 1.07 (0.93, 1.23) 1.05 (0.92, 1.20)
Parental education
college complete 1.00 (ref.) 1.00 (ref.) 1.00 (ref.) 1.00 (ref.)
HS or less 1.07 (0.96, 1.19) 1.06 (0.95, 1.19) 1.03 (0.93, 1.15)
Some college/technical
degree 1.01 (0.91, 1.13) 1.01 (0.91, 1.13) 0.99 (0.89, 1.10)
Bachelors/graduate
school 1.00 (ref.) 1.00 (ref.) 1.00 (ref.)
Income <$25,000 1.30 (1.10, 1.54) 1.28 (1.08, 1.52) 1.30 (1.09, 1.54)
Income $25,000–$39,999 1.33 (1.13, 1.57) 1.32 (1.11, 1.56) 1.32 (1.12, 1.57)
Income $40,000–$74,999 1.20 (1.02, 1.41) 1.19 (1.01, 1.40) 1.18 (1.01, 1.39)
Income >$74,999 1.00 (ref.) 1.00 (ref.) 1.00 (ref.)
neighborhood physical environment
0.95 (0.87, 1.04) 0.96 (0.88, 1.04)
neighborhood social
environment 0.97 (0.88, 1.07) 0.96 (0.87, 1.06)
HS, high school.
by residence. The presence of large variations in black–white differences suggests that race differences are not immutable and may vary substantially according to the social and envi-ronmental context.
Adjustment for hypertension risk factors had little impact on the associations between place of residence and hyperten-sion. Although diet was not included in the analyses due to missing data, the inclusion of a Dietary Approaches to Stop Hypertension (DASH)22,23 adherence measure derived from a food frequency questionnaire did not substantially modify results (data not shown). The failure of established risk factors to fully explain geographic variability is consistent with prior studies.7,9 Possible explanations include measurement error in risk factors and an absence of risk factor history, which both limit our ability to examine the role of these factors as contributors to geographic differences.
Other work has previously reported differences in hypertension incidence and prevalence by region within the US, and our findings are generally consistent with prior results
showing higher levels of hypertension among those living in southern states.7–9 Our study builds on prior research by examining not only place of current residence, but also place of birth. We found that being born in southern states was associated with increased probability of being hypertensive independent of place of residence. These findings are consist-ent with mortality studies in Ohio and New York City which showed that cardio vascular disease mortality rates were higher among blacks born in the South than those born in other parts of the country regardless of where they later lived.10,11
[image:6.594.46.552.98.466.2]There are several plausible mechanisms through which characteristics of place of birth may influence hypertension. Individuals who leave the South may bring along adverse eating habits. Persons living in the South report consuming lower levels of fiber and higher amounts of sodium and cho-lesterol compared with persons living in the Northeast, the Midwest, and the West.24 Lower SEP in childhood may have persistent effects leading to hypertension in adulthood,25–27 and educational attainment and per capita income have
table 3 | Prevalence ratios of hypertension among whites by place of birth and place of residence before and after adjustment for socioeconomic factors, neighborhood characteristics, and hypertension risk factors
Model 1a Model 2a Model 3a Model 4b Model 5c
Born in southern state 1.15 (0.98, 1.35) 1.14 (0.97, 1.34) 1.12 (0.95, 1.32) 1.13 (0.96, 1.33) 1.17 (1.00, 1.38) Foreign‑born 0.90 (0.71, 1.14) 0.91 (0.71, 1.15) 0.90 (0.71, 1.14) 0.90 (0.71, 1.15) 0.89 (0.71, 1.13) Born in non‑southern
state 1.00 (ref.) 1.00 (ref.) 1.00 (ref.) 1.00 (ref.) 1.00 (ref.)
Forsyth 1.32 (1.09, 1.60) 1.30 (1.08, 1.58) 1.23 (1.01, 1.50) 1.32 (0.95, 1.84) 1.29 (0.94, 1.78)
new york 1.01 (0.79, 1.28) 1.00 (0.79, 1.27) 0.99 (0.78, 1.26) 1.01 (0.80, 1.29) 1.03 (0.81, 1.31) Baltimore 1.24 (1.05, 1.47) 1.22 (1.03, 1.44) 1.17 (0.98, 1.39) 1.26 (0.99, 1.60) 1.21 (0.91, 1.62) Los angeles 1.20 (0.93, 1.56) 1.20 (0.93, 1.55) 1.13 (0.88, 1.47) 1.22 (0.90, 1.66) 1.01 (0.85, 1.20)
Chicago 1.00 (ref.) 1.00 (ref.) 1.00 (ref.) 1.00 (ref.) 1.00 (ref.)
Parental education less
than HS 1.12 (0.95, 1.31) 1.03 (0.87, 1.23) 1.04 (0.87, 1.24) 1.01 (0.85, 1.20)
Parental education HS complete
1.03 (0.88, 1.20) 0.99 (0.84, 1.15) 0.99 (0.85, 1.16) 0.96 (0.82, 1.12)
Parental education
college complete 1.00 (ref.) 1.00 (ref.) 1.00 (ref.) 1.00 (ref.)
HS or less 1.24 (1.05, 1.47) 1.26 (1.06, 1.49) 1.24 (1.05, 1.47)
Some college/technical
degree 1.17 (1.00, 1.36) 1.17 (1.01, 1.36) 1.16 (1.00, 1.35)
Bachelors/graduate
degree 1.00 (ref.) 1.00 (ref.) 1.00 (ref.)
Income <$25,000 0.97 (0.80, 1.18) 0.98 (0.80, 1.21) 0.94 (0.76, 1.16)
Income $25,000–$39,999 1.02 (0.84, 1.22) 1.03 (0.85, 1.24) 0.98 (0.82, 1.19)
Income $40,000–$74,999 1.09 (0.94, 1.27) 1.10 (0.94, 1.28) 1.07 (0.92, 1.25)
Income >$74,999 1.01 (0.95, 1.07) 1.00 (ref.) 1.00 (ref.)
neighborhood physical environment
1.05 (0.95, 1.16) 1.05 (0.96, 1.15)
neighborhood social
environment 1.05 (0.91, 1.22) 1.05 (0.91, 1.21)
HS, high school.
traditionally been lower in the South than other parts of the country.28,29 In our study, associations were not substan-tially modified after adjustment for parental or adult SEP or available behavioral factors, but the measures we had avail-able were limited. The DASH dietary adherence measure we investigated in sensitivity analyses was not associated with hypertension in this sample, and did not contribute to geo-graphic differences. However, diet is notoriously difficult to measure and deserves further exploration as a contributor to geographic differences. In addition, a number of studies have reported an inverse relationship between birth weight and adult blood pressure30 and the prevalence of low birth weight is higher in the South.31 Unfortunately birth weight data were not available in our sample.
One limitation of this study is that we do not have complete information on where the participants lived between when they were born and the time they joined the MESA study. However, we do have a 20-year residential history on 3,380 black and white participants included in these analyses. These data show that the majority of blacks and whites (~80–87% depending on the state) lived in the same state 20 years ago as they did at the start of the study. These data suggest that measures based on current residence reflect long-term exposures.
Our results reveal substantial geographic heterogeneity in hypertension prevalence within race/ethnic groups and also demonstrate that black–white differences vary substantially depending on which geographic groups are compared. A better understanding of the presence and causes of geographic differences in hypertension within and across race/ ethnic groups may help guide efforts to prevent the disease and reduce the disparity.
acknowledgments: We thank the other investigators, the staff, and the participants of the MESa study for their valuable contributions. a full list of participating MESa investigators and institutions can be found at http://www.mesa‑nhlbi.org. MESa was supported by contracts n01‑HC‑ 95159 through n01‑HC‑95165 from the nIH/nHLBI. This work was also supported by the Michigan Center for Integrative approaches to Health Disparities P60 MD002249 and the university of Michigan Promoting Ethnic Diversity in Public Health Training Grant 2 r25 GM058641‑09. K.N.K. drafted the paper and conducted the analyses. a.V.D.r. supervised the project and helped draft the paper. The other authors provided critical feedback on successive drafts.
Disclosure: The authors declared no conflict of interest.
1. Glover MJ, Greenlund KJ, Ayala C, Croft JB. Racial/ethnic disparities in prevalence, treatment, and control of hypertension—United States 1999–2002. MMWR 2005; 54:7–9.
2. Kramer H, Han C, Post W, Goff D, Diez-Roux A, Cooper R, Jinagouda S, Shea S. Racial/ethnic differences in hypertension and hypertension treatment and control in the multi-ethnic study of atherosclerosis (MESA). Am J Hypertens 2004; 17:963–970.
3. Cooper RS, Kaufman JS. Race and hypertension: science and nescience.
Hypertension 1998; 32:813–816.
4. Cooper RS, Rotimi CN, Ward R. The puzzle of hypertension in African-Americans.
Sci Am 1999; 280:56–63.
5. Cooper RS, Wolf-Maier K, Luke A, Adeyemo A, Banegas JR, Forrester T, Giampaoli S, Joffres M, Kastarinen M, Primatesta P, Stegmayr B, Thamm M. An international comparative study of blood pressure in populations of European vs. African descent. BMC Med 2005; 3:2.
6. Morenoff JD, House JS, Hansen BB, Williams DR, Kaplan GA, Hunte HE. Understanding social disparities in hypertension prevalence, awareness, treatment, and control: the role of neighborhood context. Soc Sci Med 2007; 65:1853–1866.
7. Hicks LS, Fairchild DG, Cook EF, Ayanian JZ. Association of region of residence and immigrant status with hypertension, renal failure, cardiovascular disease, and stroke, among African-American participants in the third National Health and Nutrition Examination Survey (NHANES III).
Ethn Dis 2003; 13:316–323.
[image:7.594.46.552.84.321.2]8. Obisesan TO, Vargas CM, Gillum RF. Geographic variation in stroke risk in the United States. Region, urbanization, and hypertension in the Third National Health and Nutrition Examination Survey. Stroke 2000; 31:19–25.
table 4 | Prevalence ratios of hypertension by race and study site
Model 1 Model 2 Model 3 Model 4
Southern‑born blacks 1.57 (1.41, 1.74) 1.39 (1.23, 1.56)
Foreign‑born blacks 1.33 (1.09, 1.63) 1.18 (0.95, 1.47)
non‑southern‑born blacks 1.45 (1.29, 1.62) 1.28 (1.11, 1.48)
Southern‑born whites 1.13 (0.99, 1.29) 1.00 (ref.)
Foreign‑born whites 0.89 (0.70, 1.13) 0.79 (0.61, 1.02)
non‑southern‑born whites 1.00 (ref.) 0.89 (0.78, 1.01)
Forsyth blacks 1.82 (1.43, 2.31) 1.41 (1.25, 1.60)
new york City blacks 1.61 (1.35, 1.93) 1.26 (1.03, 1.53)
Baltimore blacks 1.65 (1.35, 2.01) 1.28 (1.11, 1.48)
Chicago blacks 1.45 (1.21, 1.75) 1.13 (0.92, 1.39)
Los angeles blacks 1.49 (1.18, 1.88) 1.16 (0.95, 1.41)
Forsyth whites 1.29 (1.01, 1.63) 1.00 (ref.)
new york City whites 0.98 (0.77, 1.25) 0.76 (0.58, 1.01)
Baltimore whites 1.19 (0.97, 1.45) 0.92 (0.78, 1.09)
Los angeles whites 1.14 (0.87, 1.51) 0.89 (0.68, 1.16)
Chicago whites 1.00 (ref.) 0.78 (0.61, 0.99)
9. Kiefe CI, Williams OD, Bild DE, Lewis CE, Hilner JE, Oberman A. Regional disparities in the incidence of elevated blood pressure among young adults: the CARDIA study. Circulation 1997; 96:1082–1088.
10. Fang J, Madhavan S, Alderman MH. The association between birthplace and mortality from cardiovascular causes among black and white residents of New York City. N Engl J Med 1996; 335:1545–1551.
11. Mancuso TF, Redmond CK. Heart disease mortality among black migrants: a study of Ohio residents (1960–1967). Am Heart J 1975; 90:380–388.
12. Schneider D, Greenberg MR, Lu LL. Region of birth and mortality from circulatory diseases among black Americans. Am J Public Health 1997; 87:800–804. 13. Bild DE, Bluemke DA, Burke GL, Detrano R, Diez Roux AV, Folsom AR, Greenland P,
Jacob DR Jr, Kronmal R, Liu K, Nelson JC, O’Leary D, Saad MF, Shea S, Szklo M, Tracy RP. Multi-ethnic study of atherosclerosis: objectives and design. Am J Epidemiol 2002; 156:871–881.
14. Chang JJ, Rabinowitz D, Shea S. Sources of variability in blood pressure measurement using the Dinamap PRO 100 automated oscillometric device.
Am J Epidemiol 2003; 158:1218–1226.
15. Chobanian AV, Bakris GL, Black HR, Cushman WC, Green LA, Izzo JL Jr, Jones DW, Materson BJ, Oparil S, Wright JT Jr, Roccella EJ; Joint National Committee on Prevention, Detection, Evaluation, and Treatment of High Blood Pressure. National Heart, Lung, and Blood Institute. Seventh report of the Joint National Committee on Prevention, Detection, Evaluation, and Treatment of High Blood Pressure. Hypertension 2003; 42:1206–1252.
16. Morris JE, Monroe CR. Why study the US South? The nexus of race and place in investigating black student achievement. Educational Researcher 2009; 38:21–36.
17. U.S. Census Bureau, Geography Division. Geographic Areas Reference Manual. Washington, DC, 1994.
18. Mujahid MS, Diez Roux AV, Morenoff JD, Raghunathan TE, Cooper RS, Ni H, Shea S. Neighborhood characteristics and hypertension. Epidemiology 2008; 19:590–598. 19. Greenland S. Interpretation and choice of effect measures in epidemiologic
analyses. Am J Epidemiol 1987; 125:761–768.
20. Spiegelman D, Hertzmark E. Easy SAS calculations for risk or prevalence ratios and differences. Am J Epidemiol 2005; 162:199–200.
21. Zou G. A modified poisson regression approach to prospective studies with binary data. Am J Epidemiol 2004; 159:702–706.
22. Sacks FM, Obarzanek E, Windhauser MM, Svetkey LP, Vollmer WM, McCullough M, Karanja N, Lin PH, Steele P, Proschan MA. Rationale and design of the Dietary Approaches to Stop Hypertension trial (DASH). A multicenter controlled-feeding study of dietary patterns to lower blood pressure. Ann Epidemiol 1995; 5:108–118. 23. Sacks FM, Svetkey LP, Vollmer WM, Appel LJ, Bray GA, Harsha D, Obarzanek E,
Conlin PR, Miller ER 3rd, Simons-Morton DG, Karanja N, Lin PH; DASH-Sodium Collaborative Research Group. Effects on blood pressure of reduced dietary sodium and the Dietary Approaches to Stop Hypertension (DASH) diet. DASH-Sodium Collaborative Research Group. N Engl J Med 2001; 344:3–10. 24. Hajjar I, Kotchen T. Regional variations of blood pressure in the United States
are associated with regional variations in dietary intakes: the NHANES-III data.
J Nutr 2003; 133:211–214.
25. Blane D, Hart CL, Smith GD, Gillis CR, Hole DJ, Hawthorne VM. Association of cardiovascular disease risk factors with socioeconomic position during childhood and during adulthood. BMJ 1996; 313:1434–1438.
26. Hardy R, Kuh D, Langenberg C, Wadsworth ME. Birthweight, childhood social class, and change in adult blood pressure in the 1946 British birth cohort.
Lancet 2003; 362:1178–1183.
27. Wannamethee SG, Whincup PH, Shaper G, Walker M. Influence of fathers’ social class on cardiovascular disease in middle-aged men. Lancet 1996; 348:1259–1263.
28. Barnett E, Halverson J. Disparities in premature coronary heart disease mortality by region and urbanicity among black and white adults ages 35–64, 1985–1995.
Public Health Rep 2000; 115:52–64.
29. Fox K. Uneven regional development in the United States. Rev Radic Polit Econ
1978; 10:68–86.
30. Barker DJ. Fetal and infant origins of adult disease. BMJ 1990; 301:1111. 31. United States Department of Health and Human Services (US DHHS), Centers