u
C) C~0
03 U 0E
10 c -C
c)
CD
U~
0
H H
z
0
H
0
z
POWER BOAT OPERATORS'
VISUAL BEHAVIOR PATTERNS
SUSANNE M. GATCHELL, PhD
THE UNIVERSITY OF MICHIGAN,1977
H
SRIABSTRACT
POWER BOAT OPERATORS'
VISUAL BEHAVIOR PATTERNS
by
Susanne Marie Gatchell
Chairman: James M. Miller
The role of vision has been extensively studied in the control
of automobiles and aircraft, but little is known about the visual
characteristics displayed by recreational power boat operators.
Thus, a research effort was structured to: (1) develop a research
methodology for collecting boaters' eye fixation data and demonstrate
its feasibility; (2) evaluate factors which affect boaters' visual
behavior as measured by their eye fixation patterns; and, (3) compare
these .eye fixation results from boating with similar automobile driver
studies where. eye fixation data were collected.
To accomplish these objectives, corneal reflection eye fixations
were video taped while three experienced boaters performed the
follow-ing operations under low traffic density situations: three navigation
tasks (compass, visual reference point, center in channel); at three
velocities (29, 42, 56 kmh); and in two boating environments
tribution which. can be generalized for other applications.
Results demonstrated that boaters'' eye fixations can be recorded
in various conditions with acceptable accuracy; but careful procedures
are necessary.
Boaters' fixation durations were not normally distributed and
were, thus, analyzed after performing log normal transforms. This
finding of non-normality may have general implications to all past
and future eye fixation research, since it may not have been given
due consideration previously.
Analyses of the data indicate that boaters scanned a
signifi-cantly larger area to the right front of the vessel during a limited
access water condition than during an open water condition. More
fixations to the right may be related to the cockpit station being
traditionally on this starboard side of.the test boat.
During a center in channel task, durations increased with
in-creased velocities. Decreases in durations with increasing velocity
levels were exhibited during the compass and visual reference point
tasks. Possible explanations for this velocity-navigation task
inter-action are suggested.
When comparing the visual patterns of boaters with automobile
drivers, differences were noted in both the horizontal and vertical
horizontal locations were similar to automobile drivers! (50 to the
right of center) although their standard deviations were considerably
greater (22* for boaters and 3* for automobile drivers). Mean
verti-cal locations indicated that boaters scanned below the horizon (-2*),
while automobile drivers scanned above the horizon (20). This may be
related to boaters being primarily interested in collision avoidance
while automobile drivers are primarily concerned with tracking and
POWER BOAT OPERATORS'
VISUAL BEHAVIOR PATTERNS
by
Susanne Marie Gatchell
A dissertation submitted in partial fulfillment of the requirements for the degree of
Doctor of Philosophy
(Industrial and Operations Engineering) in The University of Michigan
1977
Doctoral Committee:
Associate Professor Assistant Assistant Professor
Professor James M. Miller, Chairman Don B. Chaffin
Professor Gary D. Herrin Professor Gary D. Langolf
ACKNOWLEDGEMENTS
This author wishes to express her gratitude. to her doctoral
committee, especially the Chairman, Dr. James M. Miller, and the
other members, Drs. Don B. Chaffin, Gary D. Herrin and Gary D. Langolf
of the Department of Industrial and Operations Engineering and Dr.
Richard G. Snyder of the Biomedical Department of the Highway Safety
Research Institute and the Department of Anthropology.
Special thanks are also extended to the following individuals:
Mr. James A. Foulke for his development of the visual activity
ioni-toring system and continued technical assistance in implementing the
data collection; Mr. Allan B. Hegg, President of Century Boat Company,
for donating a test vessel to the University in order that this
re-search may be accomplished; Mr. Daniel R. Dykstra for his assistance
in the data collection and data reduction phases; Mr. Robert L. Gebbie
for his assistance with the experiments; Ms. Barbara Reed-Polatty and
Edith J. Baise for their assistance in typing the numerous drafts;
to Ms. Susan S. Moffatt and Danielli Viecelli for their illustrations;
and to the Medical School Human Use Committee for their approval for
conducting this research.
This Mresearch was partially supported by Contract No. DOT-CG-61098-A
from the United States Coast Guard, Century Boat Company, and by Grant
No. 2-TO1-OH-00161-04 from the National Institute for Occupational
Safety and Health. The author also wishes to express her gratitude to
General Motors Design Staff for sponsoring a significant portion of her
graduate education.
H
2~J
TABLE OF CONTENTS
ACKNOWLEDGEMENTS LIST OF TABLES LIST OF FIGURES
ii v
vi
CHAPTER I:
CHAPTER I]
CHAPTER I
CHAPTER I
BACKGROUND AND LITERATURE REVIEW Introduction
Literature Review Boating Research Automotive Research
Automotive Eye Fixation Research
I: RESEARCH APPARATUS Test Boat
Visual Activity Monitoring System Eye Marker Calibration
II: RESEARCH METHODOLOGY
Independent Research Variables Navigation Tasks
Velocity
Boating Environment Subjects
Experimental Design
Uncontrolled Measured Variables Test Location.
Test Procedures
Pre-Test Subject Preparation Phase Familiarization Phase
Coast Guard Data Collection Phase Experimental Data Collection Phase
V: RESULTS
Data Reduction
Fixation Definition
Fixation Location Determination Fixations Eliminated from Data Sets Analysis of Results
Spatial Patterns - Horizontal and Vertical
Fixation Locations Navigation Task Effects
Boating Environment Effects Subject Effects
Subject-Boating Environment Effects
Components of Variance for Horizontal Location
Spatial Patterns - Eye Spot Travel Distance
Subject. Effects
Boating Environment Effects
Temperal Chatacteristics Fixation Durations
Fixation Targets
Analyses with Navigation Targets Excluded Analyses with Navigation. Targets Included
CHAPTER VI:
Temporal Characteristics
Summary of Comparison Characteristics
Spatial Temporal
94 98 98 99
SUMMARY AND RECOMMENDATIONS 100
Objective #1: Collection of Boater Eye Fixation
Data 100
Objective #2: Some Factors Affecting Boaters'
Visual Behavior 101
Boating Environment Navigation Task Effects 101
Fixation Locations 101
Fixation Durations 102
Subject Effects 103
Objective #3: Comparison of Boater Vs. Automotive
Visual Behavior Patterns 104 Future Research Recommendations
Recommendations Related to Literature Review 104
Recommendations Related to Resultant Boating
Data 105
BIBLIOGRAPHY 107
APPENDIX
LIST OF TABLES
Table Page
1.1 Results from three Rockwell Eye Movement Studies 16
3.1 Independent Variables 34
3.2 EMS Table for Independent Variables 39
3.3 Analysis to Determine Number of Subjects 41
3.4 Experimental Design 41
3.5 Traffic Density Measurements 44
3.6 Environmental Conditions Recorded for Each Test Run 44
3.7 Data Collection Test Day Events 52
4.1 Criteria for Data Selected for Reduction 59
4.2 Dependent Measures Recorded by Data Reducer 62
4.3 Criteria for Defining a Fixation 64
4.4 Dependent Eye Fixation Variables Analyzed 69
4.5 Significant Results from the Analysis of Variance
for Horizontal Location of Eye Fixations 72
4.6 Significant Results fropn the Analysis of Variance
for Eye Spot Travel Distances 81
5.1 Comparison of Boat and Automobile Operator's Eye
Fixation Data 92
1.1: Operators' primary search .directions to detect
potential collision yehicles 10
1.2: Photograph illustrating vehicle produced glare.
in the boating environment 14
2.1: Original test boat2
2.2: Modified test boat 22
2.3: Original and modified instrument panel 24
2.4: Layout of experimental boat 26
2.5: Illustration of visual activity monitoring helmet 27
2.6: Illustration of visual activity monitoring system 28
2.7: Illustration of VAM eye marker system TV picture. 30
3.1: Test site location 45
3.2: Boating test course 47
3.3: Limited access boating test course 48
3.4: Open water boating test course 49.
4.1: Spatial reference coordinates 60
4.2: Histograms of horizontal location including and
excluding compass fixations 67
4.3: Representative distribution of horizontal fixatin
locations 71
4.4: Navigation task effects on spatial fixation coordinates73
4.5: Boating environment effects, on spatial fixation
coordinates 75
4.6: Subject effects on spatial fixation coordinates 76
4.7: Subject-boating environment effects on spatial
coordinates 77
4.8: Components of variance for horizontal locations 79
4.9: Fixation duration distribution 83
4.10: Histogram of lognormal transform of duration data 85
4.11: Illustration of fixation.durations for
velocity-navigation task. interaction 6
4.12: Percent fixation time by target type for each
subject 87
4.13: Percent fixation time by target. type for subjects and
- navigation tasks 91
5.1: Elliptical illustration of automobile drivers' and
boaters' spatial scanning patterns. 92
5.2: Velocity effects: boating center in channel task
vs. McDowell (1975) automobile driving 96
CHAPTER I
BACKGROUND AND LITERATURE REVIEW
INTRODUCTION
Extensive research has been performed to investigate behavior
patterns of .operators in various transportation modes (primarily
aircraft and automobile); however, little is known about the behavior
patterns of recreational power boat operators. The problems of these
boat operators are just beginning to receive attention. The United
States Coast Guard has recently developed an interest in the human
factors aspects of smallcraft operators, and is supporting research
in hopes of determining causal relationships between the behavior of
operators and boating collision accidents. It will, however, take
many years of extensive and expensive research to gain an understanding
of boaters which is even comparable to our limited understanding of
automobile or aircraft operator behavior. To assist in this definition
of the boater's behavior, it would be advantageous to utilize that
research which is applicable from these other transportation modes.
Vision is an important sensory modality for vehicle operators;
and determining eye fixation points is a method which has proven
par-ticularly successful in quantifying the visual behavior of automobile
drivers. Thus, in order to explore similar visual behaviors in boaters,
the research reported herein was undertaken with the following
re-search objectives:
1. to develop a research methodology and establish the
feasibility of collecting boaters' eye fixation data;
2. to evaluate several factors which affect boaters' eye
fixations; and
3. to compare these eye fixation results with similar
auto-mobile drivers studies where eye fixation data were collected.
The literature review section develops reasons, for these
objec-tives and discusses why the -comparisons are limited to automobile
drivers.
LITERATURE REVIEW
Boating Res.earch
Boating human factors research was initiated by Miller (1973)
who applied the knowledge and techniques gained from experiments in
other environments to the boating arena. His research included
ex-tensive literature reviews in the area of stressors. (e.g., heat,
vibration, noise, etc.), perception, decision making, anthropometrics,
and cockpit design practices. He also performed an in-depth
statisti-cal re-analysis of the 1972 Coast Guard Boating Accident Report
(Miller, 1973). Finally, future research needs were proposed
which included recommendations to study visibility related problems
which might lead to collisions.
The following results were among those reported by Miller in
3
1. Of the 4308 vessels having damage, injuries or fatalities
the following was reported:
a. 78% of the operators had 100 hours or more boating'
experience.
b. In 79% of the cases, the weather and visibility were
good.
c. In 56% of the cases, the water was calm, while only
24% of the cases reported the water condition as
choppy.
d. In 63% of the cases, the wind was reported as none
to light.
2. Of the 120 "Other Deaths," 45% of the vessels had a
col-lision with another boat or an object.
3. Of the 3127 vessels damaged, 50% were cruising at the
time of the accident, and 49% had a collision with
another vessel.
It was not unskilled beginning boaters who lost control of
their vessels in rough water and who caused the majority of accidents.
Rather, it was experienced operators, cruising in other than rough
water, who collided with another object which they either 1) did not
see in time to avoid, 2) did not recognize as being on a collision
course with then, or 3) did not know how to avoid, with their
particu-lar skill, knowledge, or experience level.
As a result of this initial focus on the collision problem, the
attempted to further identify causal factors in collision accidents
in accordance to some of the recommendations made in the Miller
1973 reference. In analyzing 55 collisions reported to the Coast
Guard in 1974, MacNeill (1975, p 55) stated that 'inattention was...
the primary cause for 22% of the collisions." This, inattention can
be interpreted as operators failing to observe, process or act on the
visual information which. should have been used to avoid the collision.
As a result of ten in-depth investigations involving 15 boats,
MacNeill in the next report (1976b, p. 9-10), followed this
"in-attention" suggestion and found that:
"Visibility oriented problems were identified as causing the collision in 94% of the cases; broken down as follows:
- he didn't see boat/object in time to avoid it
but tried to 27%
didn't try 7%
- he didn't see boat/object at all because:
he wasn't looking 27%
his vision was obscured 20%
it wasn't visible 13%
94%
In the latest series of studies under Coast Guard sponsorship,
MacNeill, et al., (1976a) also discussed the series of three tests
which used a Visual Alertness Stress Test (the VAST system). This
5
position surrounded by a semicircular light display. Subjects were
instructed to steer a particular course and respond to the stimulus
lights by depressing a button on the throttle. A primary function
of this system was to test fatigue effects on peripheral vision
re-sponse times. (In order to induce fatigue, subjects spent three
hours performing specific activities, such as playing baseball, riding
in a boat, etc.) The original idea for the VAST experiment was
ceived by J. Miller, G. Herrin and S. Gatchell while acting as
con-sultants to Wyle Laboratories. The engineers at Wyle then refined
the conceptland implemented it in the present form of the VAST boat.
The reported results of the-VAST-1 test indicated that in the fatigued
states the six subjects had significantly more missed signals and
slower response times. For example, boaters' reaction times doubled
from 2100 msec in the rested state to 4000 msec in the fatigued state.
The second experiment (VAST-2) studied the primary and synergistic
effects of fatigue and alcohol. Results indicated that fatigue still
had a significant effect although not as large as in VAST-1 (RT's
increased from 1800 to 2000 msec in the fatigued state). It was also
found that there was a significant effect due to alcohol and an
inter-action effect between fatigue and alcohol.
VAST-3 was an ambitious undertaking which attempted to study
al-cohol, fatigue, noise, shock/vibration, glare and their interactions
in a three subject experiment. These factors were thought to be
major among the important potential stressors in boating. The results
response times. Alcohol was statistically significant as a main
effect on response time performance, but it "improved" response time
performance at the middle .05%.level.
These studies, by MacNeill, et al., (1976a) using the VAST
system, imparted a simulation type environment on a boating task,
the fidelity of which might be questioned. Moreover, the subjects in
the VAST-1 task were all Coast Guard personnel and in the VAST-2
and VAST-3 were Wyle personnel. Selecting subjects in this nature
may have resulted in a biased subject pool which is not
representa-tive of the average smallcraft boater. In performing further
boat-ing research studies, it would be advantageous to get a more
repre-sentative subject population.
While performing the VAST task, the subject's primary task was
to maintain compass headings. Their secondary task was to perform
the VAST task. However, analytical judgments were never -made as to
the degree or percentage of time that subjects spent on the primary
vs. secondary tasks. Given there was enough latitude maintaining
compass headings and that the boating situation was non-stressful,
then -it would be feasible to .assume that subjects spent a larger
percentage of their time monitoring the VAST apparatus than on their
primary task of maintaining compas.s heading.
Traffic density would seem to be an important factor in
oper-ators' visual behavior related to colliaion avoidance but MacNeill
never mentions the traffic density characteristics in the immediate
7
Another methodology used to determine boaters' behavior is a
simple photographic survey of boaters. Sowa and Fraser (1974)
ob-served 156 smallcraft boaters, and found that approximately 13%
were sitting on the top of the seat back; while MacNeill's (1976a,
p. 113) survey of 270 boaters "showed that 1/3 of the operators were
standing, kneeling, etc. in order to get their eye point high enough
to see adequately." Operators in this type of position, although
achieving better external visibility, reduce their ability to reach
and operate their controls.
Other methods besides those. mentioned above are available for
gaining more quantitative information of boaters' visual responses
but have not as yet been attempted. In particular, many researchers
have utilized an eye fixation apparatus to study automobile drivers'
visual behavior. This technique seems particularly suited to gain
additional information about boat operators. Thus, the first
re-search objective for this rere-search has been chosen as follows:
OBJECTIVE 1: DEVELOP A RESEARCH METHODOLOGY AND ESTABLISH
THE FEASIBILITY OF COLLECTING BOATERS' EYE
FIXATION DATA.
Because of the research precedence established in the automobile
arena, the following section examines, first, some relevant automobile
driver research, and then discusses some specific automotive eye
fixation studies which may provide insight into what might be expected
Automotive Research
Due to the cockpit similarities, and since adult boat operators
are also experienced automobile drivers, one might expect that a
large portion of boat operators': behavior may result from a "transfer
of training" from automobile driving. However, boaters should
com-pensate for the differences between the two environments when driving
a boat.
Differences between these two types of operations become apparent
when one considers the primary tasks. McDowell (1975, p. 38). summarized
the task of automobile driving as follows:
"1. Driving is primarily a preview control task where the driver previews the roadway ahead and attempts to
mini-mize the deviation between the vehicle's actual state
and the desired state over some time interval.
2. The task is primarily two dimensional with the driver controlling the vehicle's lateral position and velocity.
3. The driver is a discrete data sampling controller, as opposed to a continuous process monitor, with vehicle, dynamics and roadway geometry playing an important role
in determining the sampling strategy."
Many of the automobile drivers' tasks are necessitated by, the fact
that they have a limited, confined path in which. to maneuver their
vehicles. Boat operators have more flexibility in lateral
position-ing and velocity maintenance, thus, navigation may not be their
primary task. Instead, collision avoidance may be the primary
task for boaters. This, is necessitated by the fact that many potential
non-vehicular collision objects (e.g., logs or debris) are. difficult to
9
collision avoidance, but given that they stay in their limited
track-ing area, there is, a lower probability that a potential non-vehicular
object will be in their path. In discussing automobile drivers'
de-tection of obstacles in their roadway, McDowell (1975) assumes that
detection is not difficult; instead, the drivers are faced with the
greater task of deciding the necessary control action required by
the situation. This. detection process may be extremely difficult
for boaters because many potential non-vehicular obstacles may be
partially or totally submerged in the water. Even those obstacles
which are above the water may be difficult to detect due to glare
or low contrast ratios with the surrounding water.
In their searching and scanning behavior, automobile drivers
are aided by mirrors which have been studied by many researchers
(Pettit, 1966; Marcus, 1968; Mansour, 1971; and Mourant and Donahue,
1974). The amount of time that automobile drivers spend fixating
to the mirror depends on their immediate driving task. Mourant and
Donahue (1974) studied two such mirror systems, one with a 25% larger
field of view than the other, and found no differences in fixation
durations and frequencies to either mirror. This suggests that
auto-mobile drivers do not gain additional information from larger mirror
systems, but rather within each task they need a fixed amount of time
to acquire rear visual information. Unfortunately for boaters, this
type of mirror system has limited availability and usefulness.; and
ob-taining information from a rear visual system on a boat may be hindered
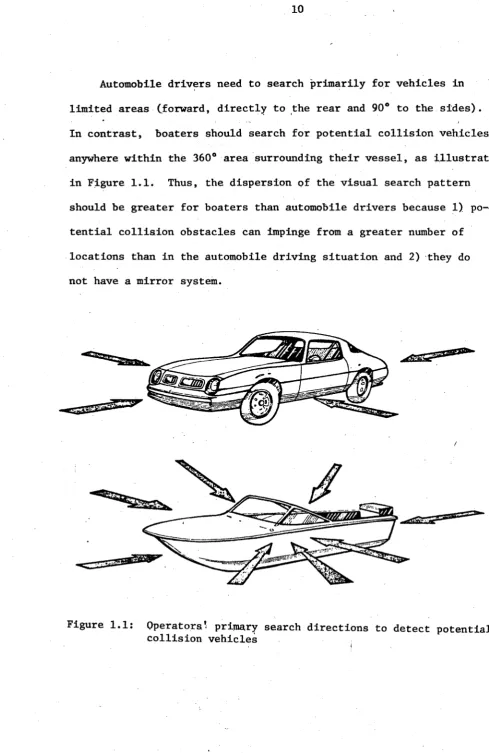
Automobile drivers need to search primarily for vehicles in
limited areas (forward, directly to the rear and 90* to the. sides).
In contrast, boaters should search for potential collision vehicles
anywhere within the 360* area surrounding their vessel, as illustrated
in Figure 1.1. Thus, the dispersion of the visual search pattern
should be greater for boaters than automobile drivers because 1)
po-tential collision obstacles can impinge from a greater number of
locations than in the automobile driving situation and 2) they do
not have a mirror system.
Figure 1.1: Operators' primary search directions to detect potential
[image:24.547.34.524.25.780.2]11
In determining where one would expect operators to scan, it
is also important to know the types and probable locations of task
related information. This was accomplished for automobile drivers
by Ford Motor Company (1972). A 2400 mile photographic survey was
undertaken to determine those areas around an automobile where
drivers were most likely to view such objects as other vehicles,
traffic signs and signals or pedestrians. It is undesirable to place
vehicular structures in locations which would obstruct driver vision
to such objects. A -method for accessing the obstructed and
non-obstructed visual areas for automobile drivers was developed by
Barnoski, et al., (1970). His method allows one to make objective
visibility comparisons between vehicles by assigning a number
between 0 and 100 to the particular vehicle being evaluated.
Boats have similar problems to automobiles in that they
con-tain pillars and other structures which can interfere with driver
visibility. Dissimilarity arises from visual obstructions caused
by the changing planing angles of the boat. A computer graphic
method for assessing this type of visual problem was developed by
Miller (1973).
In addition to potential structural interference, there are
also possible visual problems related to the foveal and peripheral
capabilities of individual drivers. -Salvatore (1968) used subjects
seated as passengers in an automobile with their heads in a chin rest.
with peripheral cues than foveal. Newsome (1967) determined that the
further in the periphery an object was, the further away an observer
judged its distance; an object at a peripheral angle of 180* was judged
by observers to be 100 feet away when the correct distance was only
65 feet. Glasses can also restrict peripheral vision capabilities
(Smith and Weale, 1966 and Bewley, 1969). Burg (1968a) reported that
age will cause a decrease in the lateral visual field. From these
above findings, one can infer, for example, that boaters might have
a tendency to underestimate the hazards associated with a boat seen
in the periphery. Moreover, velocity estimates may be more difficult
in open water, where the relevant peripheral cues similar to a traffic
roadway are not prevalent.
Detection problems may be further apparent when one considers
night boating. Night myopia has been detected in young automobile
drivers; and, positive after images can result as an automobile
driver looks directly at oncoming headlights (Fry, 1968). Dark
adaptation is also a problem in automobile driving. This is
defin-itely age related, where Domey and McFarland (1961) have recorded
that it takes a teenager 10 minutes to become dark adapted and a
60 year old 28 minutes.
One might expect these adaptation problems to be prevalent during
night boating, which in themselves makes the detection of collision
obstacles difficult. However, these problems are compounded by
13
vehicle, they can easily lose sight of it if its background has
several light sources, such as those emitted from shore.
Additional boating problems were reported by Stiehl (1975).
In a survey of 150 people involved in nighttime boating accidents,
he noted that the glare produced by the 3600 stern light (manditory
on boats) was a common problem in these collisions. Many boaters
travel at night without their stern light on in order that they
might be able to detect other boats. Problems arise when two boats
in the same vicinity are traveling without using these stern lights.
Stiehl indicated that 42% of the accident involved persons surveyed
said that the other boat's light were off. Judging whether another
boat's lights were on can be difficult for operators depending on
1) the number of irrelevant lights in the background and 2) whether
they were looking in the direction of the approaching vessel. Of
course, it is easier to get these operators. to admit that someone
else's lights were not on.
Another boating problem is related to glare. Glare. interferes
with visual detection due to the scattering of light on the retina.
Burg (1968b) analyzed drivers' visual performance and ita
relation-ship to accidents. He used a measure of glare recovery and found that
it was a predictor of accident rate. This, however, did not predict
as well as his dynamic visual acuity measure. MacNeill, et al.,
(1976a) felt that the glare factor was important enough. to include
it in the VAST-3 study. In controlling for glare, in this VAST-3
never mentioned the visual properties of the sunglasses; thus,
replications of this experiment would be difficult.
Automobile manufacturers found that a large amount of glare
comes from the vehicle structure itself. The Motor Vehicle
Safety Standard No. 107 (1968) addresses this problem with respect
to such things as the finish on metal objects which could reflect in
drivers' eyes (i.e., windshield wiper arms). Similar vehicle glare
problems are particularly relevant in the boating arena. Boat
manu-facturers do not utilize much glare reducing material and still
insist on many chrome objects around the boat, particularly in the
instrument panel area. Figure 1.2 is an illustration of the effect
[image:28.547.5.530.22.739.2]of glare on the windshield.
Figure 1.2: Photograph illustrating vehicle produced glare in the
15
The previous section discussed some of the automotive research
which has relevance to the boating arena. The following section
contains examples of various types of automotive eye fixation
re-search.
Automotive Eye Fixation Research
Numerous automotive eye fixation type studies have been
per-formed by Rockwell and others at Ohio State University (e.g.,
Rockwell, Overby and Mourant, 1968; Rockwell, Ernst and Rulon,
1970; and -Zell, Rockwell and Mourant, 1969). Using a corneal
reflec-tion eye marker system, Rockwell and others. have been able to
deter-mine areas where drivers fixate to during different types of tasks.
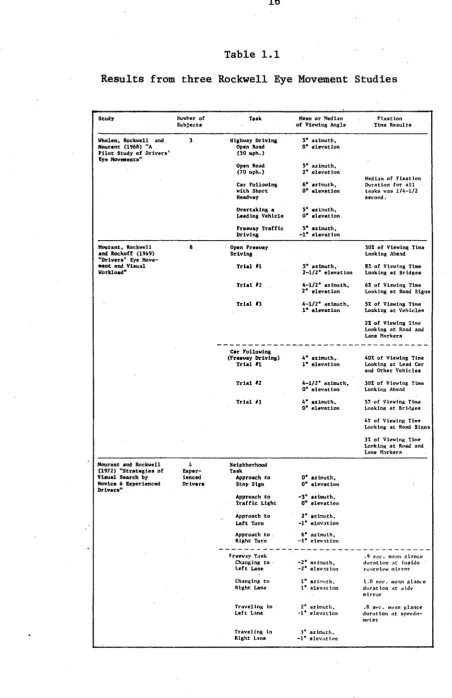
Some of their results are summarized in Table 1.1. From this table,
the most noticable inference is that the drivers' time is spent
pri-marily looking at objects in a straight ahead viewing area (-3 to
5° azimuth and -2* to.2* elevation). This is true whether the drivers
are on an open freeway, changing lanes on a freeway, following a car
or driving in a neighborhood area. The familiarity of the route does
not greatly affect the viewing area, although there does seem to be
a downward trend of fixation location. with repeated familiarity
(Mourant, et al., 1969). It is also obvious- from the fixation
dura-tion results in Table 1.1 that automobile drivers spent most of their
time looking straight ahead. Less than 10% of their time was spent
Table 1.1
Results from three Rockwell Eye Movement Studies
Study .Muaher of Tsk Mean or Median Fixation Subjects of Viewing Angle Time Results
Whalen, Rockwell and. 3 Highway Driving 5 azimuth,
Mourant (1968) "A Open Road 0 elevation
Pilot Study of Drivers' (50 mph.)
Eye Movements
Open Road 5 azimuth,
(70 mph.) 2 elevation
Median of Fixation
Car Following 6 azimuth, Duration for all with Short 0 elevation tasks was 1/4-1/2
Headway second.
Overtaking a 5' azimuth, Leading Vehicle 0' elevation Freeway Traffic 5' azimuth, Driving -1 elevation
Mourant, Rockwell 8 Open Freeway 502 of Viewing Time
and Rockoff (1969) Driving Looking Ahead
"Drivers' Eye
Move-sent and Visual Trial 01 5' azimuth, 8% of Viewing Time Workload" 2-1/2' elevation Looking at Bridges
Trial 02 4-1/2' azimuth, 62 of Viewing Time 2' elevation Looking at Road Signs
Trial 03 4-1/2' azimuth, 52 of Viewing Time
1' elevation Looking at Vehicles
22 of Viewing Time Looking at Road and
Lane Markers
Car Following
(Freeway Driving) 4' azimuth,. 402 of Viewing Time
Trial #1 1° elevation Looking at Lead Car and Other Vehicles
Trial #2 4-1/2' azimuth, 302 of Viewing Time 0' elevation Looking Ahead Trial #3 4' azimuth, 5 of Viewing Time
0' elevation Looking at Bridges
4% of Viewing Time Looking at Road Signs
3% of Viewing Time
Looking at Road and
Lane Marker .
Mourant and Rockwell SNeighborhood
(1972) "Strategies of Exper- Task
Visual Search by ienced Approach to 0 azimuth,
Novice & Experienced Drivers Stop Sign 0' elevation
Drivers"
Approach to -3' azimuth,
Traffic Light 0' elevation
Approach to 2' azimuth, Left Turn -1' elevation Approach to. 6' azimuth, Right Turn -1' elevation
Freeway Task .9 see. mean dnte
Changing to -2' azimuth, duration at inside Left Lane -2' elevation r;rview mirror
Changing to 1' ainth. 1.0 sec. mean glance
Right Lane 1' elevation duration at side mirror
Traveling in 2' azimuth, .8 sec. mean glance Left Lane --1 elevation duration at
speedo-meter Traveling in 3' azimuth,
17
In the Kaluger and Smith study (1970), fatigue caused the eye
fixation patterns to be less concentrated (i.e., scanned a larger
area), indicating that the fatigued drivers probably had to use
foveal vision in the areas typically monitored peripherally.
McDowell (1975) reported that fixation durations were longer
with increased velocity and suggested that this was related to operators
processing information more accurately at higher velocities. Such
velocity effects may be particularly pertinent in boating, due to the
fact that -the operators' have the freedom to select their speed in
most types of boating environments.
Bhise (1973) studied automobile drivers as they merged onto
freeways via a ramp. He noted that drivers on the entrance ramp made
considerably more use of their side view mirror than when they were
on the freeway.
Automobile driver's eye fixation patterns have also been studied
for other types of roadway geometry. Shinar,. et al., (1977) found
that drivers approaching a curve alternate their fixations between
the road ahead and the right road edge.
Additional studies have been performed to investigate the role of
carbon monoxide, marijuana and alcohol on automobile drivers' eye
fixations. Rockwell and Weir (1973) found that with elevated carbon
monoxide levels drivers increased their percent of fixations in the
looking ahead area. This was suggested as being related to a type
increased. Moskowitz, et al., (1976) had subjects drive a simulator
while recording their eye fixation patterns; they reported an
in-creased dwell (duration) time with alcohol and a dein-creased fixation
frequency. These authors suggest that this alcohol effect is related
to a decreased information processing rate. In the same simulator
but with different subjects, marijuana did not produce the effects
that Moskowitz had reported with alcohol. In fact, none of the eye
fixation dependent measures exhibited any significant effects due to
marijuana (Moskowitz, et al., 1976).
The above automotive driver eye fixation studies reviewed the
results from a variety of independent variables. In order to gain
a comparable understanding of boaters, research objective #2 was
undertaken.
OBJECTIVE #2: TO EVALUATE SEVERAL FACTORS WHICH AFFECT
BOATERS' EYE FIXATIONS.
Discussing the results from Objective #2 with respect to some of the
above automotive studies occurs as the third research objective.
OBJECTIVE #3: TO COMPARE THESE EYE FIXATION RESULTS WITH.
SIMILAR AUTOMOBILE DRIVERS' STUDIES WHERE
EYE FIXATION DATA WERE COLLECTED.
Regarding other than the automotive arena, airplane pilots have
detection problems similar to boaters, in that they must scan their
exterior environment for potential collision objects (i.e., other
planes, etc.). However, researchers who have studied these pilots
19
and not on their external fixations (Fitts, et al.,
1950;
Jones,et al., 1949; and Senders, et al., 1966); thus, the findings from
these researchers have limited application to boaters and will not
be discussed. The following section describes the changes which
were incorporated into-the research apparatus in order to make it
This chapter pertains to the portion of Objective #1 related
to the feasibility of collecting boaters' eye fixation data. For
the purpose of recording boaters' eye fixations, two major pieces
of equipment were necessary: an eye marker system, and a test boat.
Each of these items is discussed below.
TEST BOAT
A 6 meter (22 ft.) cabin motor boat was donated to the University
by Century Boat Company for the purpose of performing operator
visi-bility related research (see Figure 2.1). Although this vessel is
larger than the average size boat, it was selected for the following
reasons:
1. The delicate nature of the electronic data collection
equip-ment required that it be protected from water, extreme
vi-brations, and engine electrical interferences. Since this
test boat had a more stable ride than smaller boats,
vibra-tions on the equipment were minimal.
2. The hardtop and glassed-in-areas offered more protection to
the subject and test equipment; and the hardtop reduced
some of the glare on the subject.
3. The vessel was large enough for three experimenters to
perform different tasks without distracting the subject
from his primary task of driving the boat.
21
/
IF'I A
I
/9
Y I
H
'H
CX4 9'z
'9
4d
4. The forward located starboard helm position was similar to
many popular boats in the 4.9 to 7.9 meter ranges and the
research results. might, therefore, be fairly representative.
Although the test boat in its original state offered many
advan-tages, it did not fully satisfy the experimenters as to the ease and
safety of conducting the study. Thus, extensive modification had to
be made to this vessel before any data could successfully be collected.
An illustration of the modified test boat is contained in Figure 2.2
and some of the modifications are as follows:
z
ms,
[image:36.539.3.527.19.753.2]23
1. The driver's seat was a pedestal type seat with fore and
aft seat adjustment. It was modified to include vertical
seat adjustment. Thus, if the subject felt his seated
posi-tion height was not optimal, he could raise or lower the
seat. This was necessary in order to improve the forward
visibility of. the driver while trying to scan the water.
2. Gauges and controls on the instrument panel were relocated
to improve visibility and ease of operation. The original
and the modified instrument panels are illustrated in Figure
2.3.
3. Glare reducing material was installed on the bow of the
boat, the underside of the roof, the instrument panel and
several chrome areas which were glare sources (e.g., the
spokes of the steering wheel).
4. The roof of the boat was raised 15". This was necessary in
order to provide enough head room such that the driver
while wearing the corneal reflection eye movement system
would not contact the roof in rough water.
5. Each front windshield was replaced with a single piece of
glass. Originally, these windshields were a two piece unit
with vented lower portion (see Figure 2.1).
6. The bow rail was lowered to improve forward visibility. This
was necessary because at a normal planing angle the bow rail
Original Instrument Panel
Modified Instrument Panel
[image:38.547.6.528.14.751.2]25
7. The passenger seat directly behind the driver was removed
in order to locate the test equipment electronics as close
to the subject as possible without distracting him from his
task.
During testing the subject occupied a starboard helm seat with
the experimenter occupying a port seat (see Figure 2.4). Behind the
experimenter was the camera man who took 35 mm photographs at various
locations along the test route and recorded traffic densities. The
equipment monitor was located directly behind the subject.
An electrical modification was made to the boat's engine by adding
an auxiliary battery. The two batteries were connected with a battery
isolator. Then an inverter drew current off this battery system in
order to supply the 120 volts A.C. to the test equipment,
VISUAL ACTIVITY MONITORING SYSTEM
Numerous apparatus have been developed to record eye fixations.
Many of these apparatus used in laboratory settings (e.g.,
electro-oculography and contact lenses) restrict subjects to limited head
movements (see Yarbus, 1967 for a discussion of eye fixation/movement
recording devices). Automotive eye fixation researchers have usually
used portable corneal reflection type recording apparatus.
The corneal reflection eye marker recorder used for this study
was developed at the University of Michigan's Industrial and Operations
Engineering Department. This "Visual Activity Monitoring" (VAM) system
EPEIMENfEEQUPMENT
CAMERAEQUIPMENT
MONITOR
7r
7
-J
27
F
'
i
o
o
i4! i
r
SEYE MOVEMENT
HELMET
J
.1
I
FL::
DATA
ANNOTATOR P
4)
V
CAMERA
CONTROL CONSOLE
MIXER AND SEQUENCER
IDEO
APE RECORDER
TV.
MONITOR
29
This VAM system was similar in concept to the one discussed by
Rockwell, Bhise, and Mourant (1972). It consisted of a helmet with
a custom fitted foam innerliner and stabilized by means of side
brackets attached to a bite bar. Television vidicon tubes were
mounted on the helmet in front of the left eye to pick up the corneal
reflection and vertically on the subject's forehead to record the
forward scene. A combination of electronic and mechanical
adjust-ments allowed the corneal reflection image to be superimposed on the
field view image. This resulted in a small white dot which was
calibrated in such a way as to correspond to the subject's actual
viewing location, as illustrated in Figure 2.7.
Pilot tests with the VAM apparatus indicated that the original
design had to be. modified in order to record data in the boating
en-vironment. The following modifications were made:
1. Neutral density filters were added to the head vidicon lens
to reduce the amount of light entering the tube..
2. A red light emitting diode (LED) originally used as the
corneal reflection light source was neither visible to the
experimenters not on the video tape under sunlight boating
conditions. Thus, a brighter miniature incandescent lamp
was used for the light source.
3. Several ground wires were added to the system.
4. The VAM helmet was painted flat black in order to reduce
44
14-
Ll(iIIHt1. 0
__. t I rt I 1 1 i:. F N
31
5. The power supply had voltage surges which were related to
the engine r.p.m. An adjustable transformer (VARIAC) was
added to reduce these surges.
In addition to the above, the auxiliary electronic equipment
(e.g., mixer, video tape recorder) was mounted in a plywood cabinet
to protect them from the environment..
Eye Marker Calibration
During the test sessions, calibration adjustment of the system
was accomplished using a calibration board which was 2.4 m (8 ft.)
away. This board had horizontal and vertical lines 12 cm (5 in.)
apart and subtended visual angles of 160 horizontal and 100 vertical.
To check the calibration at distances other than the 2.4 m
location, the subject fixated on a.) the instrument panel gauges
and controls which were approximately .5 m (20 in.) away from him,
b.) external items (such as a point of land, a flagpole) which were
at least 100 m (325 ft.) away, and c.) bow rail markers which were
approximately 2.9 m (9 ft.) away. During these calibration sequences
the calibration error was considered acceptable
i.f
less than 20.The initial calibrations for all test runs were recorded on the
video film. Periodically through the testing sequence, the
calibra-tion was checked by having the subject fixate on certain objects.
larger variations were noted the test was stopped and the system
was recalibrated mechanically (with the adjustments available on
the helmet). Calibration error was usually caused by the helmet
slipping. This occurred because of such things as rough water
conditions or the subject trying to "scratch his head." The
average calibration error during testing was 1.50 horizontal and
CHAPTER III
RESEARCH METHODOLOGY
The development of a research methodology for collecting boaters
eye fixation data was one of the major objectives of this research.
Another objective was the evaluation of factors which affect these
types of data. In order to have satisfactorily completed these
objectives, the factors which were believed to have large affects
on boaters' eye fixation were selected as research variables. The
selection and implementation of these factors is discussed in this
chapter.
INDEPENDENT RESEARCH VARIABLES
In order to determine differences in boaters' fixation patterns,
it was decided to vary their spare capacity using the concept of
"attentional demand." Senders, et al., (1967) referred to the
"attentional demand" placed on an automobile driver as being a
function of 1) the roadway, 2) the traffic situation, and 3) the
velocity of his vehicle. Translating this concept to boating, the
"attentional demand" placed on a boat operator might be a function
of 1) the waterway characteristics (boating environment), 2) traffic
density,. and 3) boat velocity. The type of driving task should
probably also be added to Sender's model; and, thus, one would add
type of navigation task to the boating analogy. These variables
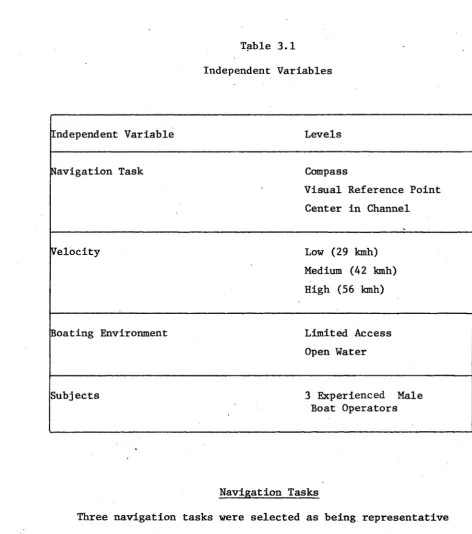
were, thus, considered within the present research as listed in
Table 3.1, and how each was involved in the experimental design will
now be discussed.
Table 3.1
Independent Variables
Independent
Variable Levelsavigation Task Compass
Visual Reference Point
Center in Channel
Velocity Low (29 kmh)
Medium (42 kmh)
High (56 kmh)
oating Environment Limited Access
Open Water
Subjects 3 Experienced Male
Boat Operators
Navigation Tasks
Three navigation tasks were selected as being. representative
boating tasks. First, a compass task was included in order to
replicate the type of task which the subjects were asked to perform
in the VAST studies by MacNeill, et al., (1976a). Second, heading
the boat to a visual reference point was included since this is one
[image:48.547.47.520.46.581.2]35
task, centering in a channel, was similar to the automobile driver's
task of keeping his car in the center of a traffic lane.
In addition to being representative, these navigation tasks
also controlled the subject's focus of attention. The compass task
forced subjects to look inside the boat. The visual reference point
task focused attention to a distant point directly in front of the
boat, and the channel task focused attention to the external peripheral
environment.
A brief description of each task now follows:
1. Compass task: Subjects were instructed to take a 0* or 1800
heading on a spherical marine compass. These heading were
selected because they were the easiest gradient markings to
read. The compass task was not a simple task for the subjects
since it was constantly oscillating. Thus, subjects were
forced to continually monitor it in order to perform the task.
2. External visual reference point task: Subjects were
instruc-ted to head the boat to a target such as a water tower or
smoke stack which was at least 1.6 km (1 mi) away. These
target objects were selected to be easily visible from a
distance because they were high above the shoreline silhouette.
3. Centering in channel task: Subjects were instructed to
center the boat in freighter channels marked by buoys. At
the narrowest location, these channels were .3 km (.2 mi)
These navigation tasks were structured in order to obtain
meaningful results related to boaters' fixation patterns. For
ex-ample, focusing these power boaters' attention to several different
areas provided additional information concerning tasks which were
not studied. An example of this is the compass task, which focused
the boater's attention inside his boat. This could also be related
to a boater preoccupied with something inside his boat, e..g., a
passenger, equipment, or some other item which would distract him
from his primary task of boating.
Velocity
The above three navigation tasks were performed at three speeds:
29, 42, and 56 kilometers per hour (kmh) (18, 26, and 35 mph). The
minimum speed (29 kmh) was selected as being just above planing with
the top speed of 56 kmh chosen as the maximum safe and comfortable
speed in choppy water. The intermediate speed, besides allowing
for a determination of quadratic velocity effects, approximates a
normal, comfortable speed in this. 4.9 to 7.9 meter (16 to 26 foot)
boat category.
At the minimum speed of 29 kmh, the tests could be best described
as boring, the boat was not in an optimal control condition in that
more steering movements were required than at the other speeds.
Furthermore, this low velocity felt "perceptually slow." The boater
should have had more spare capacity at this tninimal speed. The medium
and high speeds were more characteristic of normal boating speeds in
37
Boating Environment
In order to test possible differences due to type of waterway,
it was decided to run the test in two different types of boating
environments. The first, designated as "limited access water",
gave the appearance of being on a medium sized lake. This limited
access condition had the following characteristics: a) land was
close to the boat, b) it was easy for the driver to determine the
location of other vessels in the immediate area, and c) vessels
could only enter this area from a few "limited" locations.
The second boating environment was labeled "open water" and
gave the appearance of being on a large lake. This large lake
environment had the following characteristics: a) land was usually
far away from the boat on at least two sides of the vessel, b) it
was more difficult to determine the number of boats in the immediate
area, and c) boats could approach or enter the area from a multitude
of directions.
Subjects
Prior to selecting subjects,.the University of Michigan Medical
School Human Use Committee was contacted for approval of the planned
research, and this approval was granted.
Subjects were solicited through. an advertisement placed in a
newspaper which was distributed in the area where the research was
However, a preliminary statistical analysis indicated that the minimum
number of subjects to be used for this research should be three.
(This analysis is discussed in conjunction with the experimental
design.) The three subjects selected met the following criteria:
1. They were experienced boaters who had operated power boats
for over five years.
2. They averaged over five hours of boat driving per week during
the boating season.
3. They had operated a starboard helm, inboard-outboard drive
boat similar to the experimental boat.
4. They were familiar with the test site area.
5. They had normal physical, visual and teeth characteristics.
The subjects chosen turned out to be 20-30 years old and had the
speci-fic characteristics as listed in Appendix A.
EXPERIMENTAL DESIGN
Prior to developing an experimental design for this research,
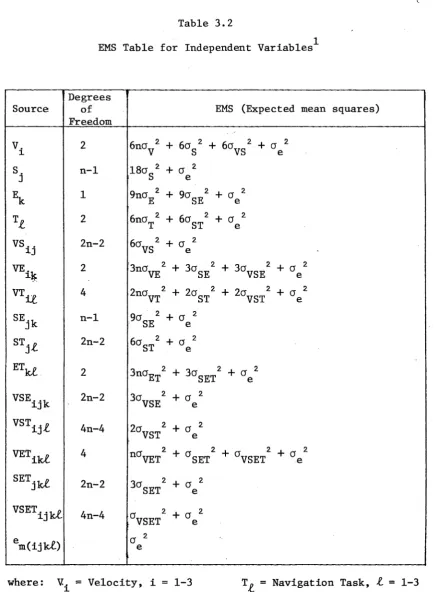
the preferred number of subjects was determined. An EMS (expected
mean squares) table was developed and is contained in Table 3.2.
This EMS table determined the tests of significance which would be
used in the data analysis. From Table 3.2, it can be seen that the
task main effects were tested against the subject-task interaction.
In order for the task effects to be significant, the following
39
Table
3.2EMS Table for
Independent
Variables'Degrees
Source of EMS (Expected mean squares)
_ _ _ Freedom _ _ _ _ _ _ _ _ _
2 V. 1 S. J Ek VS.. VE. VTQ
SE Jk
ST.t
ETkt
VSEiik
VST..
VETi1c
SET .
k
VSET1.ktC
em(ij kte)
n-I 1 2 2n-2 2 4 n-1 2n-2 2 2n-2 4n-4 4 2n-2 4n-4
6n 2 +6a 2 +6a
2.+CY 2
V
S VS e18cr 2 +a
Y2
S e
9ncf 2 +
9(y
2 +62E SE e
6nc 2
+ 6Cr 2 +a r2
T ST e
6 VS2+6 e2
3ncr 2+
3a
2+acsr
2+C
VE SE VSE e
2 VT 2 2aST 2 2aVST 2
C
e29CF 2 +c 2
SE e
6cr S 2 +6e2
3nQ
ET
2 +3cr
ST2+
Qea3
TVSE 2+ Se22cr 2
VST
n6 2
nVET
+
+
e
2r 2+a 2 2
SET VSET e
ar
2e 3cr 2 +
SET
arVE
VSET 2 +62 ea
2e
I
where: V.
1
S.
J
Ek
=Velocity, i = 1-3
=Sub
jec
t, j - 1-n= Boating Environment,
T = Navigation Task,Z = 1-3
em(ij'kZ) = Error, m = 1
k = 1, 2
[image:53.547.49.489.58.651.2]2 2 2
6na +6 S + d
T ST -e
F(3,2n-2)
2.
6aST
where n
T
ST
By assuming that 0
ST
aT
2 +a
e
= number of subjects
= task
= subject-taak
is zero, this equation can be reduced to:
1/2 632n-2)
F6n
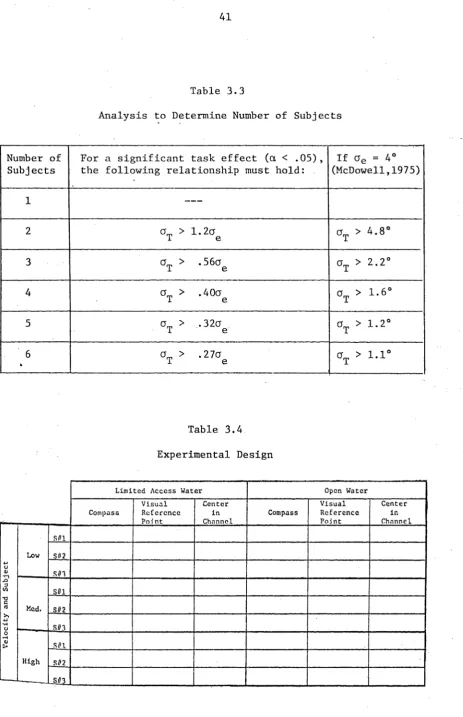
Table 3.3 contains the resultant inequalities for various n (number
of subjects). Automotive eye fixation researchers have reported
standard errors (a
)
for horizontal location of from 2* to 40e
(McDowell, 1975). Using this standard error estimate, the greatest
"gain" is obtained in going from two to three subjects. Having
three subjects appears to be economically beneficial because the
gains are smaller in increasing the number beyond three.
The experimental design used for data analysis is contained
in Table 3.4 and the mathematical model for this design is of the
41
Table 3.3
Analysis to Determine Number of Subjects
Number of For a significant task effect (a~ <
.05),
If Ge = 4°Subjects the following relationship must
hold:
(McDowell,1975)2 Cr T>l1.26 7T>4.a
3 aT > 56(T > 2.20
4 Ca > .40a
a
>1.60
T eT
5 6T > .32a 6T > 1.20
6 6a > .27a T > 1.10
T eT
Table 3.4.
Experimental Design
Limited Access Water Open Water
Visual Center1 Visual
1
CenterCompass Reference in Compass Reference in
_______ Point Channel _______ Point
J
Channel.n
'5
b
0 a
S2 __________ ____________________
Low
Med. S/#2_______
I.9#3I
High
S/#2
I.'
[image:55.547.38.502.17.735.2]ijklm +
V.
+ S + Ek +T + VS + VEik + VT + SEjk + ST+ ETkl + VSEijk + VST + VETikl + SETjkl + VSETijkl
ijk
+em(ijkl)
where: Y. . = Eye fixation parameters (e.g., durations)
ijklm
11 =Mean
V. = Velocity, i= 1-3
1
S. = Subject,
j
= 1-3E = Boating environment, k = 1,2
k
T = Navigation task, 1 = 1-3
e -Error, m = 1
m(ijkl)
Observations within this design were randomized with respect to
velocity and sequenced through boating environment and navigation
task. Use of this factorial design allowed the determination of both
the main effects and the interactions. The testing order is
dis-cussed in the Test Procedures section.
UNCONTROLLED MEASURED VARIABLES
In order to insure satisfactory completion of each test run, the
43
1. Wave- conditions were at a light chop (i.e., not more than
1-2 ft. waves).
2. Weather conditions. were such that a storm would not occur
prior to completion of all test segments.
3. Boating traffic was light during data collection, such that
not more than one boat was within .2 km (250 yds) of the
test vessel.
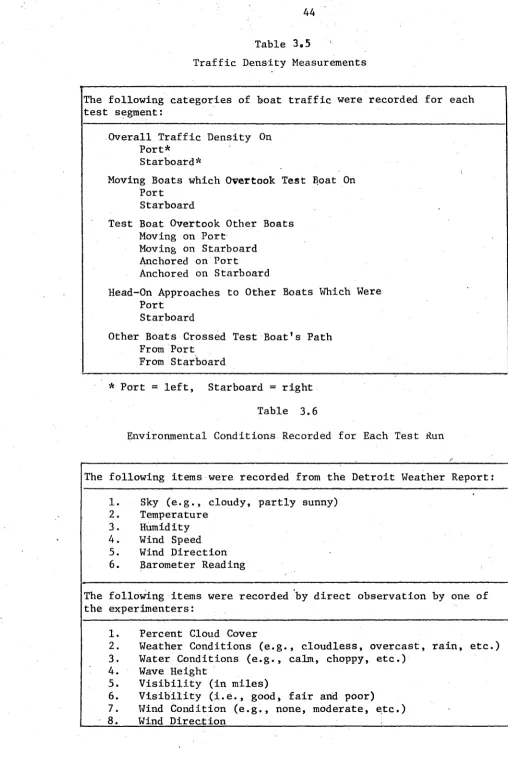
To insure that the data selected for reduction had light boating
traffic, one of the experimenters recorded the moving and anchored
boats within the area. For each test segment, this experimenter
recorded those boats within .4 km (.25 mi) and + 1000 around the
subjects' forward vision. The specific categories for which this
experimenter recorded observations are listed in Table 3.5.
Other environmental variables, although not controlled during
the testing, were recorded at the initiation of each'run. These
measured environmental variables are listed in Table 3.6.
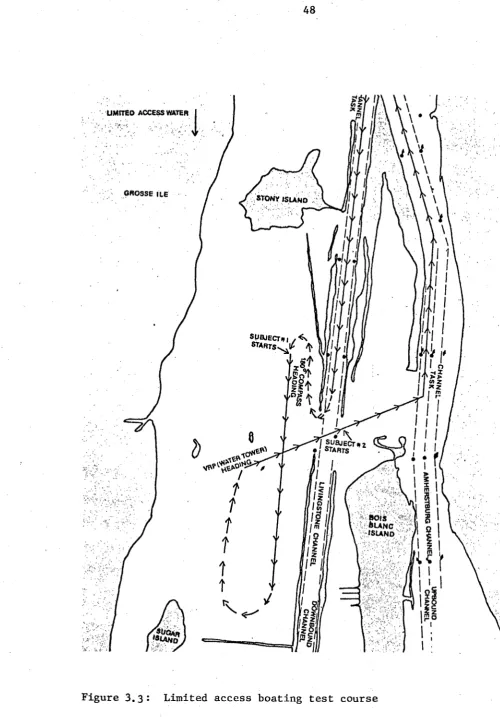
TEST LOCATION
The test site used for collecting the data was located
approxi-mately one hour away from Ann Arbor, Michigan. The specific
geograph-ical area of the test run was among the islands and lake-like bays
of the lower Detroit River as it opens into
-Lake
Erie (see Figure3.1). This area was ideal for conducting such studies since
islands, bays, coastal waters, rivers, and large water type