Journal of Criminal Law and Criminology
Volume 58 | Issue 4
Article 5
1968
Some Factors in Sentencing Policy
Robert M. Carter
Leslie T. Wilkins
Follow this and additional works at:
https://scholarlycommons.law.northwestern.edu/jclc
Part of the
Criminal Law Commons,
Criminology Commons, and the
Criminology and Criminal
Justice Commons
This Article is brought to you for free and open access by Northwestern University School of Law Scholarly Commons. It has been accepted for inclusion in Journal of Criminal Law and Criminology by an authorized editor of Northwestern University School of Law Scholarly Commons.
Recommended Citation
TImL JOL°RNAL OF CRIMINAL LAW, CRIMINOLOGY AND POLICE SCIENCE Vol. 58, No. 4 ('opyright © 1967 by Northwestern University School of Law Printed in U.S.A.
SOME FACTORS IN SENTENCING POLICY
ROBERT M. CARTER AND LESLIE T. WILKINS
Robert M. Carter received his D. Crim. from the University of California in 1966 and is a research criminologist at the School of Criminology, University of California at Berkeley. Dr. Carter has served as Correctional Officer at San Quentin from 1952-53; in counter-intelligence work in the U. S. Army 1953-57; as an agent of the Federal Bureau of Narcotics in 1957; and from 1958-64 as a United States Probation and Parole Officer.
Leslie T. Wilkins is a professor with the School of Criminology, University of California at Berke-ley. In 1949 he was awarded the Francis Wood Memorial Prize of the Royal Statistical Society for out-standing social research. Mr. Wilkins served in operational research in flying safety with the Royal Air Force, as a Senior Research Officer with the Government Social Survey, and as a Deputy Director of Research (Crime Research Unit) with the Home Department. From 1964 to 1966 he was a Senior Advisor at the United Nations Asia and Far East Institute for the Prevention of Crime and Treat-ment of Offenders in Tokyo, Japan. Mr. Wilkins is the author of Social Policy, Action and Research.
In their paper the authors present a documented conclusion that will undoubtedly be a surprise to many jurists, lawyers, and crininologists with respect to the disparities in the sentences imposed by federal district court judges.
The probation officer as a member of the court staff has two major functions to fulfill. The first is to conduct an investigation of an offender which culminates in a preseitence or probation report. This report is frequently accompanied by a recom-mendation to the court as to the selection of an appropriate sentence. The second function is to provide supervision for offenders placed on proba-tion or some other form of condiproba-tional liberty. Despite the recent focus of correctional interest and attention, and a considerable volume of literature, the terms and conditions of these func-tions remain relatively vague. It is proposed to examine here a segment of one of these, namely the presentence report recommendation and its relationship to the court disposition. Our purpose is not so much to provide data. but to make explicit some questions about presentence report recom-mendations and their relation to court dispositions. Even though corrections is a relatively new field in the United States, some of its components have already become so institutionalized that they form a cornerstone for the development of a correctional folklore or mythology. In essence, it appears that the increasing problem of crime and delinquency is being addressed by the application of principles and practices which have not been substantially modified, or even questioned, since their inception. Yet, the correctional systems must change if for no other reason than that of the increasing number of offenders processed.
Tradi-tion would have it that the changes be in the 'direction of increased probation and parole staff, prison personnel, new institutions, and related services. If these be the sole nature of the changes -more of what already exists-there will be a reliance upon a view of the past without a realistic vision of the future.
CASE LoAD SIZE
The fifty-unit workload as the standard for probation and parole supervision is an example of one of the myths. Where did this number come from? On what empirical data is it based? Is it an appropriate limitation of case load size? If it is not appropriate, what should be the workload for corrections? A search of the literature dates the fifty-unit concept back to at least 1922, when Charles L. Chute, then President of the National Probation Association, observed: "To this end fifty cases is as many as any probation officer ought to carry."1 The fifty-unit concept found its way in the prestigious academic literature when Sutherland2 in 1934, and Tannebaum3 in 1938, suggested that fifty cases "is generally regarded as the maximum number" and "the best practice would limit the caseload of a probation officer to
1 Chute, Probation and Suspended Sentence, 12 J. Ciut. L. & C. 562 (1922).2
SUTHERLAND, PRINCIPLES OF CRIMINOLOGY 359
(1934).3
ROBERT Al. CARTER AND LESLIE T. IWILKINS fifty cases". The concept of fifty entered the
professional literature when the American Prison Association in 1946 indicated that a probation officer "should not have more than fifty cases under continuous supervision."' An almost identical statement appears in the 1954 revision of the Manual of Correctional Standards.5
Not until 1966, (while still suggesting a fifty-unit workload) did the American Correctional Association indicate that "where methods of classification for case loads have been developed through research, varying standards of workloads may prevail".6
The institutionalization of the fifty-unit concept is now firmly entrenched. Budgets for operating agencies, testimony before legislative bodies, standards of practice, and projections for future operational needs all center about this number. There is no evidence of any empirical justification for fifty, nor for that matter, any other number. The following discussion relates mainly to the federal probation system, and we are indebted to the Administrative Office of the United States Courts for furnishing pertinent data. Information has also been drawn from the San Francisco Proj-ect, a study of the federal probation system, supported by the National Institute of Mental Healthy It should be noted that these data cover different populations over different periods of time, and are not to be seen as interesting in themselves, but as throwing light on the presentence report recommendation and court disposition.
RECOMmENDATIONS AND DISPOSITIONS:
THE RELATIONSHIP
The presentence report is a document basic to the functioning of both judicial and correctional administrations. The contents of the report, including the recommendation, assist the court in making a judgment consistent with its dual responsibilities to society and the defendant. Within the federal system the report aids the institutions within the Bureau of Prisons in deter-mining classification and treatment programs and also in planning for subsequent release. The report provides information to the Board of Parole,
4 Manual of Suggested Standards for a State
Correc-tional System (Am. Pris. Assn.) 13 (1946).
5 Manual of Correctional Standards (Am. Corr. Assn.)
43 (1954).
6 Ibid. 109 (1966). 7
See Lobman, Wahl & Carter, A Non-Technical Description of the San Francisco Project, The San Fran-cisco Project series (April 1965).
furnishing information believed to be pertinent to its deliberations. Furthermore, the report con-tributes to the probation officer's rehabilitative efforts while an offender is under his supervision.6 In February, 1965, with the publication of a 39
page mongraph entitled The Presentence
Investiga-tion Report, a standard outline and format was
adopted for the preparation of presentence reports in the federal courts.9 The final paragraph headings of the report are "Evaluative Summary" and "Recommendation". The importance of these paragraphs is recognized by the American Correc-tional Association which includes among its standards for the preparation of presentence re-ports a "recommendation for or against probation, or for other disposition according to court policy." 1 0
The fact that there is a substantial number of sentencing alternatives available to federal judges also means that an equal number of possible recom-mendations may be considered by the probation officer. The selection ranges, of course, from probation with or without a fine or restitution, and/or a jail sentence, and imprisonment under various statutes which determine parole eligibility, to other dispositions which include commitment for observation and study and continuances for community observation.
Because of this variety of available disposals, the relationship between a recommendation and a disposition may be more simply considered from one of two directions. The first method would be to contrast recommendations for probation made by probation officers with actual court dispositions resulting in probation. The second would be from an opposite direction, viewing recommendations against probation (or for imprisonment) with actual court dispositions for probation.
Data developed during the San Francisco Proj-ect contrast recommendations and dispositions for 500 consecutive cases processed through the United States District Court in the Northern District of California between September 1964 and August 1965." These data indicate that:
... there is a close relationship between the 8 The federal probation officer supervises persons
released on parole or mandatory release from federal correctional institutions or the United States Discipli-nary Barracks.
9The Presentence Investigation Report (Adm. Off.
U. S. Cts.) (1965).
"0Manual of Correctional Standards (Am. Corr. Assn.) 521 (2d ed. 1959).
11 Carter, It is Respectfully Reomtnded ..., 30 Fed.
Prob. 2 (1966).
SENTENCING POLICY TABLE I
PERCENTAGE OF PROBATION OFFICER RECOMMENDA-TIONS FOR PROBATION FOLLOWED BY
CALIFORNIA SUPERIOR COURTS
1959 95.6%
1960 96.4%
1961 96.0%
1962 96.5%
1963 97.2%
1964 97.3%
1965 96.7%
Source: State of California, Department of Justice. Delinquency and Probation in California, 1964, p. 168;
and Crine and Delinquency in California, 1965, pp.
98-99.
TABLE II
PERCENTAGE OF PROBATION OFFICER RECOMMxtENDA-TIONS FOR PROBATION FOLLowED BY TEN JUDICIAL
CIRCUITS, FISCAL YEAR 1964
First Circuit ... 99.4% Second Circuit ... 96.0% Third Circuit ... 93.2% Fourth Circuit ... 93.3%
Fifth Circuit ... 95.2% Sixth Circuit ... 93.9%
Seventh Circuit ... 89.9% Eighth Circuit ... 95.0% Ninth Circuit ... 93.5% Tenth Circuit ... 97.8%
Overall ... 94.1%
Source: Data furnished by the Administrative Office of the United States Courts.
recommendation of probation and the actual granting of probation. Probation was recom-mended in 227 cases and was granted in 212 of those cases. If the 7 cases of "observation and study" are not included, probation was granted, When recommended, in 212 of the 220 cases or in 96 percent of the cases. In only 2 of the 227 cases was there a substantial differ-ence between the probation officer's recom-mendation and the court's disposition of the cases. In these instances, prison sentences were ordered where probation had been
recom-mendedY.1
These data closely parallel the Californiia data. The percentages of probation officer
recommenda-32 Ibid. 41.
tions for probation followed by California Superior Courts, for the years cited, are shown in Table I. Data on the federal system, arranged by the ten judicial circuits, indicate the relationship, shown in Table II, between probation officer recommenda-tions for probation and such disposirecommenda-tions in court for Fiscal Year 1964.
The patterns in these first two tables exhibit almost total agreement between a probation officer's recommendation for probation and an actual disposition of probation. However, this trend appears less stable when viewed from the opposite perspective-the relationship between recommendations against probation (or for im-prisonment) and court dispositions of probation.
California data reveal, in Table III, the
per-TABLE I
PERCENTAGE OF PROBATION OFFICER
RECOM=NDA-TIONS AGAINST PROBATION NOT FOLLOWED BY
CALIFORNIA SUPERIOR COURTS
1959 13.5%
1960 12.8%
1961 14.8%
1962 17.4%
1963 21..0/
1964 21.1%
1965 19.9%
Source: State of California, Department of Justice.
Delinquency and Probation in California, 1964, p. 168;
and Crime and Delinquency in California, 1965, pp. 98-99.
TABLE IV
PERCENTAGE OF PROBATION OFFICER
RECOMENDA-TIONs AGAINST PROBATION NOT FOLLOWED BY
TEN JUDICIAL CIRCUITS, FISCAL YEAR 1964
First Circuit ... 7.3% Second Circuit ... 9.5% Third Circuit ... 27.4% Fourth Circuit ... 31.8% Fifth Circuit ... 11.5% Sixth Circuit ... 19.3% Seventh Circuit ... 15.9% Eighth Circuit ... 16.5% Ninth Circuit ... 23.3% Tenth Circuit ... 9.2%
Overall ... 19.7%
[image:4.431.16.211.236.407.2] [image:4.431.218.416.251.367.2] [image:4.431.223.413.426.604.2]ROBERT M. CARTER AND LESLIE T. WILKINS
TABLE V
PROBATION OFFICERS' RECOMMENDATIONS
AS TO SENTENCE Northern District of California September 1964 to February 1967
Recommendation Total Percent of
Total
All Cases ... 1,232 100.0
No recommendation ... 67 5.4
Mandatory sentence (Under certain
narcotic law violations) ... 45 3.6
Probation ... 601 48.9
Regular ... (284) (23.1)
With Fine and/or Restitution .... (197) (16.0)
Split Sentence (Imprisonment up
to Six Months Followed by
Probation) ... (49) (4.0)
Under Youth Corrections Act... (71) (5.8)
Fine only ... 38 3.1
Jail only ... 35 2.8
Imprisonment ... 334 27.1
Parole Eligibility After 1/3
Sen-tence ... (234) (19.0)
Parole Eligibility At Any Time... (64) (5.2)
Under Youth Corrections Act.... (36) (2.9)
Observation and study ... 51 4.2
Adult ... (39) (3.2)
Youth ... (12) (1.0)
Continuance for 90 days
observa-tion ... 16 1.3
Deferred prosecution ... 3 .2
Commitment under federal juvenile
delinquency act ... 2 .2
Other recommendations ... 40 3.3
Source: Unpublished San Francisco Project data.
centages of "against probation" recommendations and probation dispositions in court.
It is noteworthy that California authorities indicate the "superior court judges are more lenient than probation officers as to who should be granted
probation." 11 This pattern has already been
observed by one of the authors,14 and by others,'15
in respect to the federal probation officer. Further confirmation of this pattern is found throughout the federal system as indicated by a review, in Table IV, of "against probation" recommendations and probation dispositions according to the ten judicial circuits for Fiscal Year 1964.
1 Delinquency and Probation in California, 1964
(Calif. Dept. of Justice) 166 (1964).
t4 Carter, supra note 11.
itLohman, Wahl & Carter, San Francisco Project series (Report N2) 8 (Berkeley: June 1965).
As already indicated, the probation officer has a wide latitude in his choice of a recommendation. Table V presents data on the specific recommenda-tions of probation officers in the Northern District of California between September 1964 and Febru-ary 1967, and shows the wide variety of possible
recommendations.
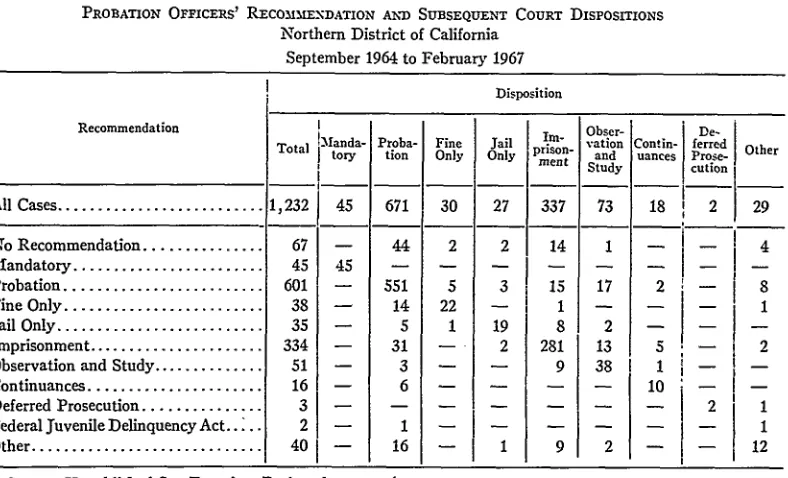
Table VI presents overall data on the relation-ship between recommendations and dispositions of 1,232 cases processed through the District Court in Northern California. The reader will note that of 601 cases recommended for probation, 15 were ordered imprisoned; of 334 cases recommended for imprisonment, 31 were placed on probation.
These data seem to support certain generaliza-tions about the nature of the relageneraliza-tionship between probation officer recommendations and court dispositions. We have seen that there is a very strong relationship between recommendations for
-probation and court dispositions of probation, an
average agreement of about ninety-five percent. It has also been observed that the strength of the relationship diminishes slightly when
recommenda-tions against probation (or for imprisonment) are contrasted with court dispositions of probation. Thus, it may be concluded that where disagree-ments exist between recommendations and dis-positions, they occur when the officer recommends imprisonment. In a sense, if this relationship measures "punitiveness" then it may be concluded that the probation officer is more punitive than the judge.
OUTCOME OF SUPERVISION ACCORDING
TO THE RECOM NDATION
Very limited data are available on the outcome
of supervision, i.e., the violation rate, according
to recommendations of probation officers. The
1964 cohort study of Davis6
examined the
viola-tion status of 11,638 adult defendants granted probation in California Superior Courts between 1956 and 1958. Davis showed that 27.1 percent of the defendants recommended for and placed on probation were "revoked," while 36.7 percent of the defendants, placed on probation against the recommendation of the probation officer were revoked. Davis concluded that the "difference in revocation rates was very significant and indicates that the two groups were not alike in their tend-ency to recidivism".
16 Davis, A Study of Adult Probation Violation Rates
by Means of the Cohort Approach, 55 J. CRph. L., C. & P. S. 70 (1964).
[image:5.431.25.220.50.420.2]SEXTENCING POLICY TABLE VI
PROBATION OFFICERS' RECOMMENDATION A ND SUBSEQUENT COURT DIsposITIONS
Northern District of California
September 1964 to February 1967
Disposition
Recommendation I[Obser-
De-Total IManda- Proba- Fine Jail - ration Contin- ferred
tory tion Only Only prison- and uances Prose- Other
men Study cution
All Cases ... 1,232 45 671 30 27 337 73 18 2 29
No Recommendation ... 67 - 44 2 2 14 1 - - 4
Mandatory ... 45 45 - -
-Probation ... 601 - 551 5 3 15 17 2 8 Fine Only ... 38 14 22
-
1 - 1Jail Only ... 35 5 1 19 8 2
--Imprisonment ... 334 31 2 281 13 5 2 Observation and Study ... 51 3 9 38 11
-Continuances ... 16 6 -
10--
Deferred Prosecution ... 3 - - - - -- -- - 2 1
Federal juvenile Delinquency Act... 2 1 - 1
Other ... 40 16 1 9 2 - - 12
Source: Unpublished San Francisco Project data. I
It is questionable that this single explanation for the ten percent differential in revocation rates occurs simply because of differences in the two groups. There are two other possible explanations for this. One explanation may be that subtle differences exist in the supervision provided by a probation officer who may feel "resentful" in having an individual placed on probation against his recommendation. The second possibility is that the defendant's attitude toward a probation officer who recommended that he be imprisoned instead of placed on probation may affect the outcome of supervision. While there are no meas-ures of these two negative factors, it is possible that they account for a large portion of the ob-served differential. There are other interesting studies which support the hypothesis of self-fulfilling prophecies.
Another way of viewing Davis' data is to em-phasize that 63.3 percent of those who received an unfavorable probation recommendation but were placed on probation completed their probation without revocation. Thus, to deny probation to all those with negative recommendations from proba-tion officers would suggest that approximately two out of every three defendants with such recom-mendations would be denied the opportunity to complete probation successfully. Davis inquired
as to the number of defendants who, denied proba-tion on unfavorable recommendaproba-tions, would have succeeded on probation if given the opportunity. There are, at this time, no data to answer this
question17
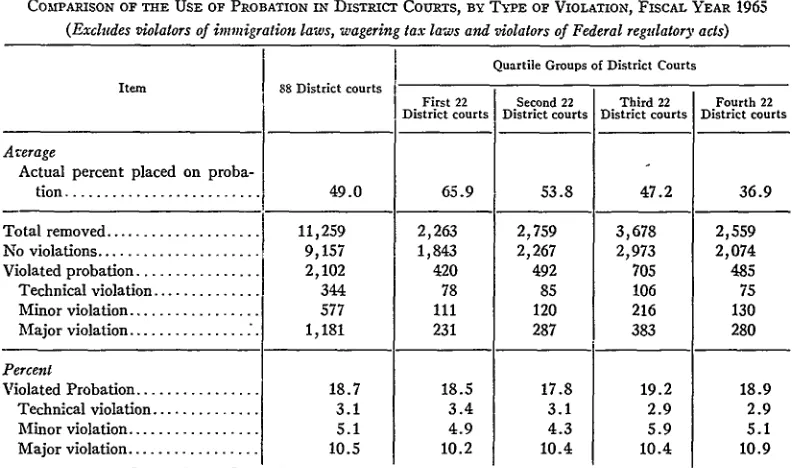
Other data are available from the Administrative Office of the United States Courts which indicate that despite considerable variation in the use of probation, the overall violation rates, or the rates broken down by "major," "minor," or "technical"
are almost identical. Table VII of the Administra-tive Office report is reproduced here to show proba-tion violaproba-tion rates for 1965, according to the actual percentage of persons placed on probation
by the 88 U.S. District Courts, arranged by quar-tiles.
The data in Table VII reveal that approximately 19 percent of those placed under probation super-vision violate the terms of this conditional liberty, regardless of the percentage of the offender popu-lation on probation.
FACTORS AFFECTING T=E AGREEMENT BETWEEN
R:ECOMME N DATIONS AND DISPOSIONS Reverting to the possible explanations for the high degree of agreement between probation
17 Wilkins, A Small Comparative Study of the Results of Probation, 8 British J. Crimino. 201 (1958).
[image:6.431.19.413.62.301.2]ROBERT M. CARTER AND LESLIE T. WILKINS
TABLE VII
(Table A 18 of the Administrative Office of the U. S. Courts covering 88 United States District Courts)
COMPARISON OF THE USE OF PROBATION I,, DISTRICT COURTs, BY Tv.PE OF VIOLATION, FISCAL YEAR 1965
(Excludes violators of immigration laws, wagering tax laws and violators of Federal regulatory acts)
I
Quartile Groups of District Courts Item 88 District courtsFirst 22 Second 22 Third 22 Fourth 22
District courts District courts District courts District courts
Average
Actual percent placed on
proba-tion ... ... 49.0 65.9 53.8 47.2 36.9
Total removed ... 11,259 2,263 2,759 3,678 2,559
No violations ... 9,157 1,843 2,267 2,973 2,074
Violated probation ... 2,102 420 492 705 485
Technical violation ... 344 78 85 106 75
Minor violation ... 577 111 120 216 130
Major violation ... 1,181 231 287 383 280
Percent
Violated Probation ... 18.7 18.5 17.8 19.2 18.9
Technical violation ... 3.1 3.4 3.1 2.9 2.9
Minor violation ... 5.1 4.9 4.3 5.9 5.1
Major violation ... 10.5 10.2 10.4 10.4 10.9
Source: Administrative Office of the United States Courts, Persons Under the Supervision of the Federal Probation
System. (Washington, D.C.: 1965), p. 33.
officer recommendations and court dispositions, it is possible that four factors, operating independ-ently, but more probably simultaneously, account for this relationship:
1) The court, having such high regard for the professional qualities and competence of its probation staff, "follows" the probation recommendation-a recommendation made by the person (probation officer) who best knows the defendant by reason of the pre-sentence investigation;
2) There are many offenders who are "ob-viously" probation or prison cases;
3) Probation officers write their reports and make recommendations anticipating the recommendation the court desires to receive. (In this situation, the probation officer is quite accurately "second-guessing" the court disposition);
4) Probation officers in making their recom-mendations place great emphasis on the same factors as does the court in selecting a sen-tencing alternative.
Data from the San Francisco Project confirm
the fact that probation officers and judges apply approximately equal significance to similar factors."8 Examination of 500 probation officer recommendations according to the major categories of recommendations for probation and recom-mendations for imprisonment (or against proba-tion), produced data on the legal and demographic characteristics of the offender population which had an important effect upon the recommendation selected. In general terms, the proportion of recommendations for probation increased with the number of years of education, average monthly income, higher occupational levels, residence, marital and employment stability, participation in church activities, and a good military record. Recommendations for imprisonment (or against probation) increased proportionately when offenders exhibited such characteristics as homo-sexuality, alcoholic involvement, the use of weapons or violence in the commission of the offense, the existence of family criminality, and drug usage. Age (in the range examined) did not
I See Lohman, Wahl & Carter, San Francisco Project
series (Reports 4 and 5) (Berkeley: December 1965, February 1966).
[image:7.431.24.421.80.314.2]SENTENCING POLICY significantly distinguish between the two
recom-mendations, and racial and religious affiliation differences were absent. The female, however, was more likely to be recommended for probation than the male offender.
Certain offense categories (e.g. embezzlement, theft from interstate shipments or theft of govern-ment property, and false stategovern-ment) usually produced recommendations for probation, while other offense categories (e.g. bank robbery, the interstate transportation of stolen motor vehicles [Dyer Act], and National Defense law violation) usually resulted in recommendations for imprison-ment. Offenders who entered a plea of guilty, retained their own attorneys, or who were released to the community on bail, bond, or personal recognizance while the presentence investigation was being conducted, had significantly greater chances of being recommended for probation. It is recognized, or course, that a recommendation for or against probation is generally based upon some combination of characteristics--some ob-vious, others subtle-rather than upon any single characteristic or piece of information.
It is apparent that not all factors are of equal significance in determining the probation officer's recommendation. Accordingly, statistical compu-tations produced a general ranking of the signifi-cance or importance of various factors.'9
A further examination of the 500 cases was made, reviewing the selection of the sentencing alterna-tive by the court. Again, statistical computations were completed and a second rank order of the significant or important factors was produced.
These two sets of data-one relating to the recommendation, the other to the disposition-are summarized in Table VIII. The rankings were based on probability and contingency coefficient values. A correlation was computed and a signifi-cant value of .90 was obtained. These data indicate that there is considerable agreement between probation officers and judges as to the significance of certain factors and characteristics for decisions relating to probation or imprisonment recom-mendations and dispositions.
Another possible explanation of the close agree-ment between recommendations and dispositions is certainly that some cases are dearly probation or imprisonment cases. However, there are no "hard" data to identify which cases are "clearly" probation or prison cases. An actual, but extreme
TABLE VIII
RANK OF DEMOGRAPHIC FACTORS UTILIZED BY
PROBA-TION OFFICERS FOR RECOMMENDAPROBA-TIONS AND DISTRICT COURT JUDGES FOR SENTENcING ALTERNATIVES, ACCORDING TO PROBABILITY AND CONTINGENCY
COEFFICIENT VALUES
500 Federal Offenders Northern District of California September 1964 to August 1965
Demographic Factors
Prior Record ... Confinement Status ... Number of Arrests ... Offense ...
Longest Employment ... Occupation ... Number of Months Employed .... Incom e ... Longest Residence ... Military History ...
Number of Residence Changes ....
Distance to Offense ... Number of Aliases ... M arital Status ... Legal Representation ... Weapons and Violence ... Family Criminality ... Plea ... Education ... Church Attendance ...
Narcotics Usage ...
Sex ...
Alcoholic Involvement ... Crime Partners ... Homosexuality ... R ace ... Age ... Religion ... Probation Officers' Ranking 1 2 3 4 5 6 7 8 9 10 11 12 13 14 15 16 17 18 19 20-21 22 23 24 25 26 27 28 District Court judge's Ranking 3 2 4 1 5 8 6 10 7 9 17 14 24 11 13 15 21 18 12 16 23 19 25 20 26 28 22 27
Source: Joseph D. Lohman, Albert Wahl and Robert M. Carter. San Francisco Project series, Report 5, (Berkeley: February 1966), p. 68.
Spearman's p = .90
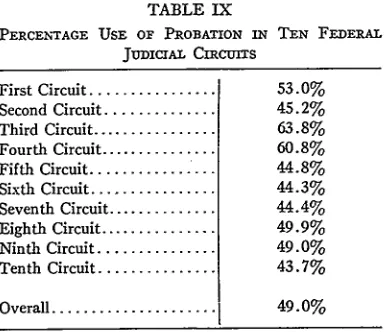
ROBERT M. CARTER AND LESLIE T. WILKINS TABLE IX
PERCENTAGE USE OF PROBATION IN JUDICIAL CIRcuITs
TEN FEDERAL
First Circuit ... 53.0% Second Circuit ... 45.2% Third Circuit ... 63.8% Fourth Circuit ... 60.8% Fifth Circuit ... 44.8% Sixth Circuit ... 44.3% Seventh Circuit ... 44.4% Eighth Circuit ... 49.9% Ninth Circuit ... 49.0% Tenth Circuit ... 43.7%
Overall ... 49.0%
Source: Administrative Office of the United States
Courts. Persons Under the Supervision of the Federal
Probation System, Fiscal Year 1965, pp. 103-105. example of the "probation case" is the young married offender, who, unemployed prior to the Christmas season, made a false statement to the Post Office for employment, concealing a prior misdemeanor arrest. In general terms, this type of offender would normally be seen as a suitable candidate for probation.
From observation and conversations with judges and probation officers during the past years, it appears that judges do indeed have a high regard for their probation staff and value their profes-sional judgment as to the disposition of a case. It is suspected that this is especially true in the federal system in which probation officers are appointed by the court and serve at its pleasure. This esteem for probation officers and their services by the court may also contribute to the high agree-ment between recommendations and dispositions, even though there are no statistical data to support this.
The fourth potential explanation for the close agreement between recommendations and disposi-tions-probation officers anticipating the recom-mendation the court desires-is now to be discussed.
VARIATION AMONG PROBATION OFFICERS
AND PROBATION OFFICES
Disparities in sentencing have been of considera-ble interest in recent years and attempts to reduce these frequently observed differentials have normally been focused on judges. For example, sentencing institutes for judges have been
developed at the federal and state level, as well as training programs for newly appointed or elected judges. That attention should be directed toward judges-for they impose the sentences-is cer-tainly normal and, on the surface, a logical approach to resolving disparities. However, this pattern ignores one of the facts of community life -in this case the judicial community and its social system-that many persons play a part in the functioning of the community. Included in the judicial community are probation officers, prosecu-tors, defense attorneys, perhaps to a lesser extent the law enforcement agencies, and other judges on the same bench.
It seems to have been generally assumed that the judges are solely responsible for the disparities and that the remainder of the judicial community plays only a minor role which remains constant, neither supporting or contributing to the dis-parities. Although we do not have complete data upon which a judicial "community-effect" can be shown to be a basis for disparities, there are data available which demonstrate the supporting role of at least one member, namely the probation officer.
If we assume that probation officers are "con-stant" and that judges are "variable", we would expect to find significant differences in the rela-tionship between officer recommendations and court dispositions as we move toward extremes in the use of probation or imprisonment. We would not, in the federal system for example, expect to find the more than 94 percent agreement between recommendations and dispositions spread uni-formly throughout the system, for some courts use probation frequently, others infrequently. In Fiscal Year 1965, individual federal courts had a range of probation usage in excess of fifty percent, with one court using probation for 23.8 percent of its cases, another for 75.7 percent of its cases. The percentage of defendants on probation in Fiscal Year 1965 by the ten judicial circuits is shown in Table IX.
Thus, on a circuit-wide basis, there is a high of 63.8 percent in the usage of probation ranging to a low of 43.7 percent, an overall spread of twenty percent, and as noted above, the variation is even more marked among individual courts. Six of the eighty-eight district courts used probation in excess of seventy percent for their defendants; twelve courts used probation for less than forty percent of their defendants.
[image:9.431.28.220.54.220.2]SENTENCING POLICY TABLE X
USE OF PROBATION AND RECOMMENDATIONS FOR AND AGAINST PROBATION BY SELECTED UNITED STATES DISTRICT
COURTS FISCAL YEAR 1964
Recommended for Probation Recommended Against Probation
Recommendations
Percentage Use Given by Probation
of Probation Number of Number Percentage Number of Number Percentage Officers: Percent of
Defend- Granted Granted Defend- Granted Granted Total Cases ants Probation Probation ants Probation Probation
A 78.3 147 143 97.3 55 20 36.4 73.2
B 71.4 144 137 95.1 90 31 34.4 88.0
C 70.7 27 26 96.3 7 0 - 82.9
D 70.4 20 19 95.0 11 2 18.2 43.7
E 70.2 125 125 100.0 28 1 3.6 77.3
F 50.8 106 100 94.3 112 17 15.2 89.3
G 50.0 16 16 100.0 17 1 5.9 82.5
H 50.0 152 145 95.4 149 19 12.8 80.9
I 50.0 14 13 92.9 9 0 - 60.5
J 49.7 12 12 100.0 36 6 16.7 15.4
K 49.6 29 28 96.6 36 0 - 47.4
L 36.8 28 28 100.0 19 0 - 13.6
M 36.5 61 61 100.0 117 14 12.0 73.0
N 35.6 158 148 ,93.7 310 21 6.8 87.8
0 28.5 92 82 89.1 74 25 33.8 35.1
P 26.3 44 38 86.4 174 24 13.8 90.8
Total for all District
courts 50.2 6868 6463 94.1 7691 1518 19.7 63.1
Source: Data furnished by the Administrative Office of the United States Courts.
Despite the variation among courts, individually or circuit wide, the relationship between probation officer recommendations and court dispositions is generally quite constant, whether there is high, moderate, or low usage of probation. This may be seen more precisely in Table X which provides data for Fiscal Year 1964 on sixteen selected federal courts: the five with the highest usage of probation, the five with the lowest use of probation, and the six courts which were within one percent of the national average for use of probation.
It will be seen, for example, that in District A, probation was recommended for approximately three of each four defendants (147-55); in District
H, the recommendations are about equal (152-149), while in District N, probation is recommended for about one defendant in three (148-310). However, the "agreement" rate be-tween probation recommendations and dispositions in District A is 97.3 percent, in District H, 95.4 percent, and in District N, 93.7 percent.
These data indicate clearly that the
recom-mendation-disposition relationship does not vary greatly from court to court, and that disparities in sentencing are supported, at least in terms of recommendations, by the probation officer member of the judicial "influence group". To be sure. there may be differences in the Districts which justify high or low use of probation, but thus far these have not been demonstrated. These data raise some interesting and important questions regarding the utility of sentencing institutes for judges, by themselves, as the solution to disparities, and suggest that probation officers, and perhaps prosecuting and defense attorneys, be included in such institutes.
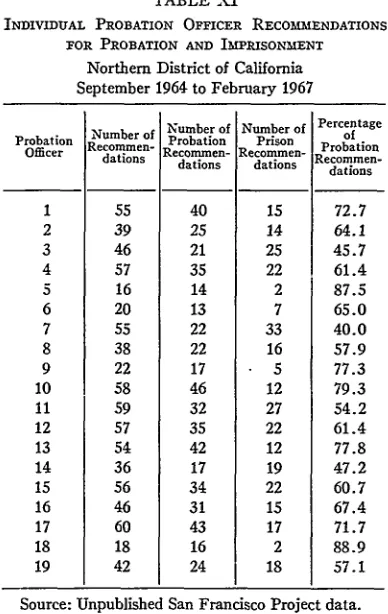
[image:10.431.15.409.74.361.2]ROBERT M. CARTER AND LESLIE T. WILKINS TABLE XI
INDIVIDUAL PROBATION OFFICER RECOMMENDATIONS FOR PROBATION AND IMPRISONMENT
Northern District of California
September 1964 to February 1967
Number of Number of Number of Recommen- Probation Prison
datons Recommen-dations dations
55 40 15
39 25 14
46 21 25
57 35 22
16 14 2
20 13 7
55 22 33
38 22 16
22 17 5
58 46 12
59 32 27
57 35 22
54 42 12
36 17 19
56 34 22
46 31 15
60 43 17
18 16 2
42 24 18
Percentage
of Probation Recommen-dations
72.7
64.1 45.7 61.4 87.5 65.0 40.0 57.9 77.3 79.3 54.2 61.4 77.8 47.2
60.7
67.4
71.7
88.9 57.1
Source: Unpublished San Francisco Project data.
which leads to the agreement in that District, regardless of the frequency of probation or im-prisonment dispositions. Thus, where probation is used frequently, we would expect the officers in that court to be sympathetic to such usage and we would anticipate that little variation would exist among officers. If this is the case, we would not expect to find much significant variation among probation officers in a single District. We would not expect to find large differences among col-leagues appointed by the same court, operating in a similar fashion as regards court and office policies and directives, appointed under uniform standards, paid identical salaries, and theoretically sharing similar views of the correctional process.
Let us return to our data on the 1,232 recom-mendations made by the probation officers in the Northern District of California as shown in Table V. By restricting ourselves to a probation-im-prisonment dichotomy, we observe that probation was recommended 64.3 percent of the time (601 of 935 cases) and that imprisonment was recom-mended 35.7 percent (334 of 935 cases). The
Probation Officer
recommendations of 19 probation officers in Northern California for probation or imprisonment are presented in Table XI. (Officers who made less
than 15 recommendations are excluded.)
The percentage of recommendations for proba-tion is almost 50 percent-from a low of 40.0 to a high of 88.9 percent. Three officers recommended probation for less than 50 percent of their cases; three officers between 50 and 60 percent, six between 60 and 70 percent, five between 70 and 80 percent, and two in excess of 80 percent.
While this individual variation may be attrib-uted, in part, to the geographic basis for assignment of cases or to other administrative reasons, it is statistically significant and suggests that proba-tion officers, even in the same District do not view the correctional process from identical perspectives.
What accounts for this variation among officers? In part, administrative and geographic considera-tions may be an explanation. There may be differ-ences in probation-suitability among persons from metropolitan areas, (e.g., San Francisco-Oakland) and less developed or rural areas such as the northern coast or central valleys of California. But it is equally possible that these variations are due to personal characteristics, including academic training, age, and vocational background. Some general, but not conclusive observations can be made based on the probation officers in Northern California. For example, probation officers with graduate training or graduate degrees in social work or social welfare recommended probation for 56.3 percent of their cases; officers with graduate work or graduate degrees in criminology in 69.6 percent of their cases, and officers with graduate work or graduate degrees in sociology in 67.7 percent of their cases. Officers with the longest service recommended probation for 54.0 percent of their cases, while the "newer" officers recom-mended probation for 68.4 percent. Three hypotheses are suggested by these and other data:
1) Some of the variation in probation officer recommendations is a product of the individ-ual background of the officer and includes vocational experience and academic training. 2) The differences or variations tend to diminish with the period of employment; that is, officers with different backgrounds are far more dissimilar upon entering the probation service than after exposure to the agency.
3) With an increase in the period of service
(i.e., more experience) there is a decrease in
[image:11.431.27.221.56.363.2]SENTENCING POLICY TABLE XII
RECOMMENDATIONS FOR AND AGAINST PROBATION ACCORDING TO UNITED STATES DISTRICT COURT JUDGES
Northern District of California September 1964 to February 1967
: [ [ Percentage
Number of Number of 'Number of Percentage of of of P rereenttUmber aNumber
Judge Cases Disposed Recommenda, Recommenda- Cases Recoin- Cn er oe atreen
o-of in Court Probation tions for losAant mended for Cae1rne ae btwen rom-PdProbation Probatio P Probation bmendations and
_
I
_ _ DispositionsTotal 831 527 304 63.4 512 278 97.2
1 64 40 24 62.5 38 23 95.0
2 58 30 i 28 51.7 29 23 96.7
3 160 103 57 64.4 99 53 96.1
4 156 114
I
42 73.1 11138 97.45 88 57 31 64.8 1 57 30 I 100.0
6 100 58 42 58.0 56 36 96.6
7 60 39 21 65.0 38 18 97.4
8 73 46 27 63.0 44 26 1 95.7
9 72 40 32 55.6 40 31 100.0
Source: Unpublished San Francisco Project data.
recommendations for probation. This ma,
represent a more "realistic" or less "opti-mistic" view of the benefits of probation
treatment for a greater number of offenders, than was the view held by the officer earlier in his professional career.
"SEcoND-GUESSING" OR "FOLLOWING"
There is, in our search for variation, the possi-bility that the probation officer attempts to second-guess the court by making recommendations which are anticipated to be those desired by the court.
If this were the case, one measure of this factor would be that different judges receive different rates or percentages of probation or imprisonment recommendations. Thus, properly "second-guess-ing" a punitive judge would require a larger proportion of imprisonment recommendations; second-guessing a "lenient" judge would require more probation recommendations. Returning to the data on the 1,232 cases in the Northern Dis-trict of California, and again resDis-tricting ourselves to a probation-imprisonment dichotomy, we find some, but not significant variation in the per-centage of probation recommendations to individual judges. These data are in Table XII. Since none of these judges has a reputation of being punitive or lenient, we can only surmise that in this District, there is little if any second-guessing.
A review of Table XII will also indicate that individual judges are equally receptive to recom-mendations for probation; the relationship between recommendations for probation and such disposi-tions being 97.2 percent over-all and constant
between judges.
It appears that judges "follow" probation officer recommendations; there is no other ready explanation of the individual officer variation in probation recommendations and the high overall relationship between recommendations and dis-positions. This also tends to confirm the observa-tion that probaobserva-tion officers contribute to the problems of disparities in sentencing. From these data, all four previously suggested explanations of the close agreement between recommendation and disposition (probation officers and judges giving approximately equal weight to similar factors, the "following" of recommendations by the court, the presence of "obvious" probation or imprisonment cases, and some "second-guessing") appear appropriate.
SUMMARY
[image:12.431.16.408.81.271.2]di-ROBERT M. CARTER AND LESLIE T. WILKINS minishes when viewed from the recommendations
against and the subsequent grant of probation perspective. Limited data on the outcome of supervision by recommendation and by percentage use of probation are provided. We have inquired into the reasons for the close agreement between recommendation and disposition and suggest that four factors, in varying degrees, account for it. We have observed that the overall relationship between recommendation and disposition does not vary from District Court to District Court, but rather remains relatively constant, regardless of the percentage use of probation. We suggest that disparities in sentencing are supported by the probation officer and it appears that these differ-ences, in part, are a reflection of the officer's individual academic training and experience. Length of service brings about a trend toward conformity with colleagues and the development of a more conservative perspective toward the use of probation.
There are other segments of the presentence report process to which questions should be ad-dressed. These include operational and admin-istrative considerations, the decision-making processes of probation officers, and an examination of the nature and impact of the social system of correctional agencies. Within the operational considerations would be inquiries as to the role of subprofessionals in presentence investigations, the rearrangement of the standard presentence
format to provide a developmental sketch instead of the current segmented report, a determination as to the appropriateness of "confidential" pre-sentence reports, the collection of prepre-sentence data in a fashion which allows computer analysis, and the separation of the investigation and supervision functions. Although some examination has been made of the decision-making process,20 we need additional information about the sequence of data collection, the relative importarnce of certain kinds of data, and the eventual use of the data for decision-making within the correctional system. We find almost a complete void in knowledge on the social systems of correctional agencies, al-though available data indicate that the system itself has a profound influence on job behavior, beliefs, values, and the definition and achievement of correctional goals. Indeed, we know more about the social systems of the offenders with whom we deal than about the systems of the agencies which provide correctional services.
There are vast gaps in our knowledge about the entire correctional process, but these gaps may be closed by imaginative, innovative, and creative research and operational designs and programs. This requires a willingness to subject our current traditional, correctional models to scrutiny and a willingness to set aside those features, cherished though they may be, which are inefficient and ineffective.
20 Id.