Munich Personal RePEc Archive
Natural Resource Endowments,
Subsistence Agriculture, and Poverty in
the Chhotanagpur Plateau
Banik, Pabitra and Edmonds, Christopher and Fuwa,
Nobuhiko and Kam, Suan Pheng and Villano, Lorena and
Bagchi, D.K.
International Rice Research Institute
2004
Online at
https://mpra.ub.uni-muenchen.de/23692/
D
P
2004 No. 47
D
IS
C
U
SS
IO
N
PA
PE
R
Natural Resource Endowments,
Subsistence Agriculture, and Poverty
in the Chhotanagpur Plateau
Suggested citation:
Banik P, Edmonds C, Fuwa N, Kam SP, Villano L, Bagchi DK. 2004. Natural resource endowments, subsistence agriculture, and poverty in the Chhotanagpur Plateau. IRRI Discussion Paper Series No. 47. Los Baños (Philippines): International Rice Research Institute. 32 p.
ISBN 971-22-0195-3
The International Rice Research Institute (IRRI) was established in 1960 by the Ford and Rockefeller Foundations with the help and approval of the Government of the Philippines. Today IRRI is one of 15 nonprofit international research centers supported by the Consultative Group on International Agricultural Research (CGIAR – www.cgiar.org).
IRRI receives support from several CGIAR members, including the World Bank, European Union, Asian Development Bank, Interna-tional Fund for Agricultural Development, InternaInterna-tional Development Research Centre, Rockefeller Foundation, and agencies of the following governments: Australia, Belgium, Canada, People’s Republic of China, Denmark, France, Germany, India, Islamic Republic of Iran, Japan, Republic of Korea, The Netherlands, Norway, Philippines, Spain, Sweden, Switzerland, Thailand, United Kingdom, United States, and Vietnam.
The responsibility for this publication rests with the International Rice Research Institute.
IRRI Discussion Paper Series
The Discussion Paper is a flexible means for IRRI scientists to share information with specialized institutions and individuals. It is intended to be a fast means of presenting plans for new research or preliminary results of research still in progress, but which could be of immediate use to others. The series also contains special project reports, consortia and network reports, reports of meetings or workshops (short of the actual proceedings), workshop recommendations, and similar materials.
Copyright International Rice Research Institute 2004
Mailing address: DAPO Box 7777, Metro Manila, Philippines Phone: +63 (2) 580-5600
Fax: +63 (2) 580-5699 Email: irri@cgiar.org
Home page: www.cgiar.org.irri Riceweb: www.riceweb.org
iii
Contents
Glossary of non-English terms iv
Introduction 1
Approach taken in this study 2
Report objectives 2
Description of the study area 4
Location and history 4
Natural resource degradation and unfavorable environmental 5 conditions
Agricultural production 11
Low productivity and limited use of modern technologies 11
Subsistence orientation 13
High incidence of poverty 14
Income and wealth 14
Other indicators of household welfare 17
Sources of household income 18
Social and institutional influences on household choices and 20
outcomes
Caste system 20
Size of landholdings and economic outcomes 24
The impact of land reform and of the panchayat system 25
Summary and policy implications 29
Glossary of non-English terms
Baad land Medium uplands with low soil fertility status. Medium-duration (120 ± 5 days) rice is grown.
Barhi land Homestead cultivable land with water resources. Mostly highly intensive cropping is done with high inputs.
Boro rice Winter-season rice transplanted in December-January and
harvested in April-May. Boro rice is photo-insensitive and grown under irrigated conditions.
Desi plow Plow made of wood. Bullock-drawn shallow chisel. It makes a V-shaped furrow and does not turn over the soil.
Garha land Lowland with high fertility status. The land is highly bunded with no drainage facilities. Long-duration traditional rice is grown with minimum inputs. Excess moisture is the main problem.
Gora rice Upland direct-seeded traditional rice with low yield (below 1 t ha–1) potential generally sown in June and harvested in
October.
Gundli A cultivated millet whose botanical name is Panicum
antidotale.
Hatia star Star that first appears in the sky over India from 27
September to 9 October that is traditionally used by farmers in the area to indicate likely postmonsoon rain and the availability of residual soil moisture enabling cultivation of winter crops.
Kharif season Main monsoon season (June to October); the major crops grown are rice, sorghum, maize, cotton, etc.
Kodo A minor millet (Paspalum scrobiculatum) generally grown in
degraded uplands (tanr land).
Panchayat The Indian codified system of local democracy and
governance based on elections of local leaders from competing political parties.
v
Ragi Also known as Marua. The English name is finger millet
(Eleusine coracana) and it is also grown in uplands. Rohan star Star that first appears in the sky over India from 25 May to
7 June that is traditionally used by farmers in the area to time their cultivation of rice in anticipation of premonsoon rains.
Tanr land Toposequentially, it is upland with light-textured, shallow sandy loam and noticeable amounts of gravel. It is highly permeable and has low water-retentive capacity.
Tolas Cluster of houses in the village (artificial man-made
boundaries). Each tola commonly represents a particular ethnic group.
Natural resource endowments,
subsistence agriculture, and poverty
in the Chhotanagpur Plateau
The Chhotanagpur Plateau in eastern India lies on the so-called “tribal belt” and is one of the poorest regions of India. In 1998, the Indian Statistical Institute in Kolkata and the International Rice Research Institute began research to examine the biophysical and socioeconomic factors constraining agricultural activity and household income in the region. This report provides an initial descriptive and quantitative analysis of the integrated biophysical and socioeconomic database constructed from this research. The report begins with a brief overview of the geography and history of the study area, followed by descriptions of the main biophysical characteristics of the area, such as climate, topography, soil, water availability, and the typology of land types in the area. The main cropping systems associated with each land type are identified. This research highlighted the importance of low-scale variations in topography in explaining cropping systems. The report then reviews the socioeconomic characteristics of the villages and the surveyed households. Key characteristics include the high incidence of poverty, the diversity of economic activities, and the small share of imputed household income derived from rice cultivation. The report concludes with a brief discussion of policy implications and avenues for future research.
P. Banik, C. Edmonds, N. Fuwa, S.P. Kam, L. Villano, and D.K. Bagchi
Introduction
2
Approach taken in this study
Beginning in 1998, this study has applied a
multidisciplinary approach in seeking to identify the key determinants of poverty and welfare among farming households in adjacent districts (Giridih and Purulia) of the states of Bihar (located in the newly formed Jharkhand State) and West Bengal.1 The
approach combined geographic modeling relying upon geographic information systems (GIS) tech-niques and household agricultural and socioeconomic survey data collection and analysis typical of an economics approach in an effort to understand the main biophysical and socioeconomic factors driving farmers’ livelihood strategies and use of the resources available to them in order to determine the key interventions—policy, technological, institutional, etc., aimed at improving livelihoods in a sustainable manner. Identification of the key constraints to improved agricultural productivity (particularly for rainfed rice, which represents the predominant crop and is the principal focus of agricultural activities of households in the study area) is a particular focus of this study. The research also seeks to determine what are the most promising exit paths from poverty and natural resource degradation in the eastern part of the Bihar plateau. Agronomic field work, including in-field experimentation carried out by the Indian Statistical Institute (ISI) in Kolkata, also provides useful insights regarding possible routes of crop diversification or other mechanisms for enhancing the value of the agricultural output of households in the study area.
The empirical data considered integrate biophysical and socioeconomic characteristics observed at various scales (household, village, and landscape). The biophysical environment is catego-rized according to hierarchical scales of what are identified to be important factors—climate, terrain, soils—that influence the hydrology and the suitability for different agricultural activities in the area. Interac-tions among these biophysical variables are consid-ered at length as well, as is the relationship between biophysical and socioeconomic characteristics. Our analysis begins by discussing characteristics at the district level and subsequently considers the determi-nants of poverty and agricultural productivity at progressively lower scales (e.g., district, block, village, and household).
Many of the socioeconomic analyses, on the other hand, are based on results from a detailed household survey. The survey was conducted with 541 households divided across 16 villages from two
districts in the adjacent states of Jharkhand (formerly part of Bihar) and West Bengal. Both districts are located in the Chhotanagpur Plateau and share similar biophysical characteristics, but the governing institu-tions across the two districts differ markedly. In Purulia District (West Bengal), the panchayat system is well developed and land reform has been actively implemented, whereas, in Giridih District
(Jharkhand), local democracy is largely absent and large landholders exercise considerable influence over local economic and political affairs. In each district, surveyed households were selected from two villages across four blocks (Fig. 1). Villages selected within each block were stratified according to the ease of access to the main transportation routes and markets. Within each village, household sample lists were drawn from census lists and approximately 34 households were selected for interviewing using stratified random sampling based on the size of the household landholding, with weights from each landholding category assigned in rough proportion to the class’s representation in the population according to the latest census.
In rural economies in developing countries, the level of household welfare tends to be closely related to the size of landholding controlled by the house-hold. Following the classification used by the Agricul-tural Census in India, we have thus classified our sample households into five categories according to the total size of land owned by the household: landless households (with landholding of less than 0.08 ha), marginal farm households (0.08–1 ha), small farm households (1–2 ha), medium farm households (2–4 ha), and large farm households (more than 4 ha). The data collected for each house-hold included demographic characteristics, occupa-tion and income of household members, plot-level information on agricultural inputs and outputs, crop disposal (e.g., how much of the produce is self-consumed and how much is sold), credit transactions, and capital and livestock holdings.
Report objectives
This report focuses on the descriptive and initial quantitative analysis of the integrated biophysical and socioeconomic database constructed for the project. It focuses on characterizing the study area and the farming households surveyed. The report starts with a brief introduction to the geography and history of the study area, followed by descriptions of the main biophysical characteristics of it, such as climate, topography, soil, and water availability. This section
4
also introduces the typology of land types in the area and identifies the main cropping systems associated with each land type. The next section considers the main characteristics of agricultural production as revealed by the survey of farmers in the study area. The productivity, technology applied in production, and subsistence orientation in production are dis-cussed. The next sections review the socioeconomic characteristics of villages and households in the study area. Key characteristics include the high incidence of poverty and the diversity of economic activities (both agricultural and nonagricultural) observed in the livelihood strategies of surveyed households. These sections also examine the relationship between important socio-cultural aspects found in the study area—caste, landholding size, and differences in systems of local governance—and observed eco-nomic outcomes. The report concludes by reviewing the findings that emerge from the review of descrip-tive data and discussing policy implications.
Description of the study area
Location and history
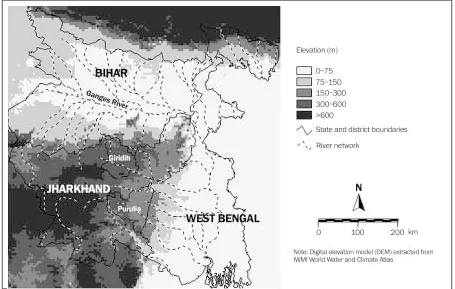
Physiographically, the study area is located at the eastern fringe of the Chhotanagpur Plateau, which
rises in elevation south and west of the eastern Gangetic plain and the Ganges delta (Fig. 2). Before the British colonial era, this area was largely unsettled and was mostly covered with dense forest. Available oral history and limited documentation suggest that the small local population subsisted from the extrac-tion of local forest products and carried out very little agricultural activity (Sen et al 1984), focusing on cultivating local rice, pulses, millets, and vegetables. Under British rule, the colonial administrators found the area to be an important source of timber for use in constructing national railways, leading to extensive deforestation. Settlers—particularly families from marginalized tribes—were permitted to move into the area to farm on the cleared lands. Although records are scarce, it seems that most immigrants into the area came from other parts of eastern India.
[image:10.612.70.525.416.705.2]With independence, state initiatives estab-lished a mining industry in Giridih District, which was rich in mineral resources (particularly mica and coal), as part of a broader development strategy highlighting industrial development. The mining industry flourished for about 30 years, attracting more immigrants, until the demand for mined mica declined because of the invention of a less costly artificial substitute, while other mineral resources became
depleted. With the decline of the mining industry, many of the immigrants turned to agriculture for their livelihoods.
On the other hand, Purulia District of West Bengal, serving as a buffer zone between the Damodar plains and Bihar plateau, came under British rule in the last decade of the19th century, with local zamindars governing natural resources, includ-ing forest, and peoples’ livelihood. Except for a few coal areas, no important industries flourished. The main crops were more or less the same as those of Giridih District and tribals formed a significant part of the population. Postindependent reforms, particu-larly panchayat activities and land reforms, with an increase in small landowners, had major impacts in Purulia in the 1990s. For example, high-yielding varieties (HYVs) along with inputs such as fertilizer and pesticides were distributed among farmers through the panchayat under the scheme called “Manikit,” which might explain the higher rate of HYV adoption in Purulia than in Giridih (as seen below). However, the topographical features and the predominance of rainfed cultivation are common between the two districts.
Natural resource degradation and unfavorable environmental conditions
Climate, rainfall, and the cropping calendar. Climati-cally, the study area is subtropical and subhumid, with hot wet summers and cool dry winters. During most of the year, temperatures in the study area do not constrain crop growth, although winter temperatures do fall below 10 oC in December and January. Low
temperatures can affect establishment of boro (winter season) rice, which is transplanted in December-January and harvested in April-May.
Rainfall and water availability are more serious climatic factors constraining agriculture in the study area. Figure 3 shows the spatial distribution of mean annual rainfall for Bihar and West Bengal (in this study, availability of weather data from govern-ment meteorological stations was taken into consid-eration in the selection of blocks from which villages were sampled for farm household surveys). Annual rainfall generally decreases from the northwest to the southeast of the plateau. The mean annual rainfall in Purulia District is 1,334 mm, decreasing to 1,225 mm in Giridih District. While these annual amounts would generally be considered adequate for agriculture, the high seasonality of rainfall confines the cropping period to only part of the year. This rainfall
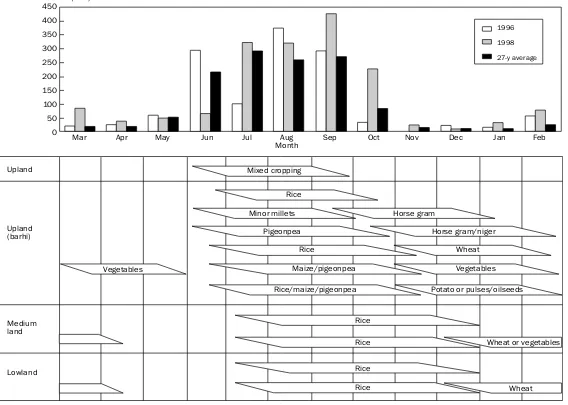
seasonality is influenced by the southwest monsoon. About 82% of the annual rainfall occurs within the monsoon period, which lasts roughly from June to
September (the black bars in Figure 4 show the 27-year average monthly rainfall in Giridih). There are, on average, about 80 rainy days (with daily rainfall exceeding 2.5 mm) in a year in Giridih and 83 in Purulia, but this can vary yearly, from 62 to 104 days. The monsoon rains can be very intensive and erosive, particularly in areas on higher ground bare of vegeta-tion cover. Available moisture over the entire monsoon period determines the time window of opportunity for the various cropping systems practiced by farmers in the study area.
Normally the southwest monsoon starts in mid-June, that is, the 24th Standard Meteorological Week (SMW), and ceases at the end of September— SMW39 (Fig. 3B). Traditionally, farmers in the study area use the appearance of the Rohan star (Narahari Rao et al 1999, Banik 1996) in SMW20-21(mid-May) as an expectation of premonsoon precipitation for carrying out nursery planting and land preparation for rice. The average premonsoon precipitation (or Rohan rain) is 35.2 mm in Purulia and 26.9 mm in Giridih.
Similarly, the availability of postmonsoon precipitation (Hatia rain) during the period of appear-ance of the Hatia star in the last week of September to the first two weeks of October (SMW40-41) indicates the possibility of sowing winter crops and also using residual moisture to cultivate winter crops on medium land (Banik 1996). Our field experiments indicate that second cropping is possible on medium land with soil residual moisture provided that there is Hatia rain to germinate and establish the crop (Banik et al 1993, 1997, 1999, Banik and Bagchi 1996).
6
Fig. 3. Rainfall and temperatures in the study area. (A) Annual mean rainfall in Bihar and West Bengal, (B) annual mean rainfall in Giridih and Purulia districts.
7
Month
Upland Mixed croppingUpland
Rice
Minor millets Horse gram
Pigeonpea Horse gram/niger
Rice Wheat
Maize/pigeonpea Vegetables
Rice/maize/pigeonpea Potato or pulses/oilseeds
Rice
Rice
Rice
Rice
Wheat or vegetables
Wheat Vegetables
Upland (barhi)
Medium land
Lowland 450 400 350 300 250 200 150 100 50 0 Rainfall (mm)
1996
1998
27-y average
[image:13.612.119.687.97.502.2]Mar Apr May Jun Jul Aug Sep Oct Nov Dec Jan Feb
8
early withdrawal of the monsoon; the October rainfall in 1996 was 60% below the 27-year average (83 mm) and no rainfall was recorded for November. In 1998, the off-monsoon months of January to April were distinctly wetter and the onset of the monsoon was delayed—the June rainfall was 70% below the 27-year average. However, the monsoon lasted longer and the September and October rainfalls were 56% and 174% higher than normal. A delay in the onset of the monsoon means that farmers who take advantage of the Rohan rain to start their crops would encounter early-season drought. An early withdrawal and/or lack of Hatia rain would affect the ability to grow winter crops in a multiple cropping system. Hatia rain (over a 2-week period in late September to early October) can vary from 0 to 334 mm, and may fail completely in one out of four years. On average, only about 10% of the total annual rainfall occurs outside the
monsoon (pre- and post-) period. Although this constitutes a small amount of rainfall, it is neverthe-less important in giving reasonable yields for winter crops such as barley and oilseeds.
On the whole, differences in rainfall character-istics between Purulia and Giridih are only slight, with Purulia experiencing marginally higher rainfall and more rainy days, and slightly higher frequency of early monsoon onset (5 out of 20 years compared with 2 out of 20 years for Giridih). These minor differences across space are overshadowed by the considerably greater interannual variations at any location in the plateau.
Surface water and groundwater resources. During the dry season, many of the smaller streams/ rivulets in the study area typically dry out; as a result, surface water is not readily available. The main sources of water for agricultural use are dug wells, supplemented with water stored in reservoirs and ponds. The study area is poorly endowed with underground water resources because of its crystalline (granitic) bedrock and insufficient recharge from rainfall during the monsoon season because of excessive surface runoff. The water-table depth varies from shallower than 3 m to more than 12 m during the summer months, and many of the shallow wells retain scanty water or dry up completely. Hence, irrigation potential during the dry season is relatively low (Bhattacharya et al 1985, Maiti and Bagchi 1993).
Influence of topography and soils on land use. Topographically, the study area is undulating, with elevation ranging from 250 to 500 m. The undulating topography and highly dissected landscape give rise to short-range variations in terrain and soil and water conditions, which influence the kinds of crops that can be grown, the time windows for cropping, and the
possible cropping systems in different parts of the toposequence. Topographically, three main landscape types are identified:
• The upper terraces, or uplands, are associated with light-textured soils.
• The middle terraces, or medium land, have slightly more heavily textured soils (e.g., loamy sands and sandy loams).
• The lower terraces, or lowlands, have even more heavily textured soils (e.g., sandy clay loam).
Soil texture influences soil moisture storage capacity, which, together with water-table depth, largely determines the period of moisture availability for cropping at these landscape positions. Water availability outside the monsoon season (including pre- and postmonsoon periods) is particularly crucial for cultivation in the upland and medium land, whereas, in the lowlands, the accumulation of exces-sive surface runoff coupled with a high water table causes flooding, which could keep the land sub-merged after the monsoon period until as late as February. Farmers further distinguish different levels among the upland, medium land, and lowland, planting different rice varieties according to their perception of soil moisture gradient across the toposequence (Fig. 5). (The percentage distribution of different land types among our sample households is shown in Table 1.)
The uplands, locally known as tanr, are subjected to various intensities of use.
1. The gravelly uplands are generally not suitable for cultivation because of the harsh soil and water conditions. Where the natural forests are degraded, these uncultivated areas undergo severe erosion, causing further land degradation and increasing the extent of uncultivable area. 2. In the cultivable uplands, cropping of gora rice
(short duration, 85–90 days, drought-tolerant, low-yielding upland rice) and traditional minor millets (finger millet, kodo, gundli) is done solely or in association with other crops as mixed crops during the monsoon season. Across all the sample villages, the most common crop-ping pattern for uplands was rice (kharif or monsoon-season)-fallow (rabi or winter-season), which was practiced on 41% of the total upland plots (in terms of the number of plots), as illus-trated in Table 2. Seventy-four percent of the upland plots are left fallow during the winter season (see Table 3).
System Soil texture Soil depth Available soil moisture Fertility status Cropping system Problems Degraded uplands
Rocky; loamy sand
Shallow 150175 mm Low Forest Degraded forest Not cultivated Drought Low fertility Shallow soil depth Erosion
Upland
(tanr)
Sandy loam with gravel
Shallow
200225 mm
Low
Fallow Gora paddy, minor
millets such as finger millet; kodo; gundli Mixed cropping
Water scarcity Low fertility Shallow soil depth Erosion
Upland (barhi)
Sandy loam; sandy clay loam
Shallow to moderate
200250 mm Medium Double-/triple-cropped cereal-based systems: rice/maize -wheat/pulse-potato/ vegetables (medium-duration traditional rice varieties) Small plots Unavailability of HYVs Unbalanced application of manure and fertilizer
Mid-upland (Baad) Sandy loam Moderate 225250 mm Low Monocrop rice (medium-duration traditional variety locally called Badhia dhan)
Lack of water Unavailablity of suitable high-yielding medium-duration variety Medium land (ajan/kanali)
Sandy clay loam
Moderate
250275 mm
Low to medium
Monocrop rice Rice-wheat
(long-duration traditional varieties such as Ajan dhan)
Lack of water Unavailablity of
inputs such as HYVs, etc. Unbalanced nutrient application Lowland (garha) Clay loam
Moderate to deep
300375 mm
Medium to high
Monocrop rice (long-duration traditional varieties) Excess water Poor drainage Lack of proper
[image:15.612.93.538.70.418.2]nutrient manage-ment
Fig. 5. Land types defined by low-scale differences in topography.
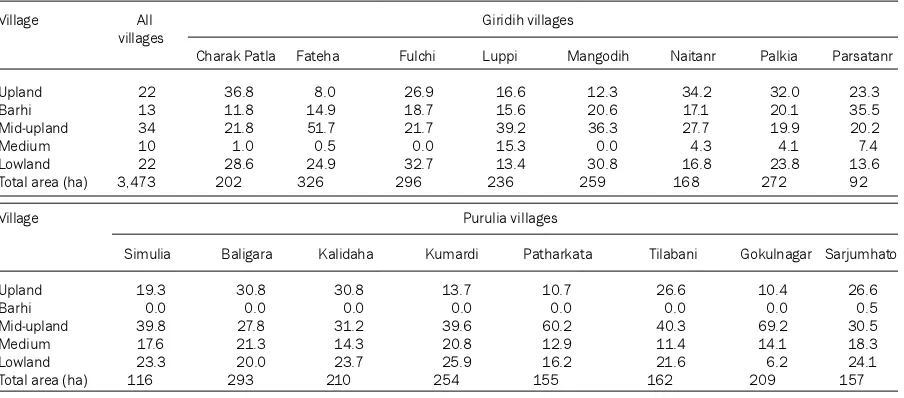
Table 1. Percentage share of different land types by village (sampled plots only).
Village All Giridih villages villages
Charak Patla Fateha Fulchi Luppi Mangodih Naitanr Palkia Parsatanr
Upland 22 36.8 8.0 26.9 16.6 12.3 34.2 32.0 23.3
Barhi 13 11.8 14.9 18.7 15.6 20.6 17.1 20.1 35.5
Mid-upland 34 21.8 51.7 21.7 39.2 36.3 27.7 19.9 20.2
Medium 10 1.0 0.5 0.0 15.3 0.0 4.3 4.1 7.4
Lowland 22 28.6 24.9 32.7 13.4 30.8 16.8 23.8 13.6
Total area (ha) 3,473 202 326 296 236 259 168 272 92
Village Purulia villages
Simulia Baligara Kalidaha Kumardi Patharkata Tilabani Gokulnagar Sarjumhato
Upland 19.3 30.8 30.8 13.7 10.7 26.6 10.4 26.6
Barhi 0.0 0.0 0.0 0.0 0.0 0.0 0.0 0.5
Mid-upland 39.8 27.8 31.2 39.6 60.2 40.3 69.2 30.5
Medium 17.6 21.3 14.3 20.8 12.9 11.4 14.1 18.3
Lowland 23.3 20.0 23.7 25.9 16.2 21.6 6.2 24.1
[image:15.612.91.543.493.692.2]10
and wheat and rice, and for rice seedbeds. The relatively higher level of inputs (including labor) in these barhi lands compensates for the low natural fertility of the soils and enables these areas to support crop diversification and intensi-fication. In contrast with other land types, the rice-fallow cropping pattern is found on only 4% of the barhi plots, and only 36% of the barhi plots are left fallow during winter (see Table 3). Cropping patterns practiced on barhi lands are quite diverse, but the more commonly observed ones during the kharif-rabi seasons on barhi plots were fallow-potato (16%), maize-fallow (15%), ragi (finger millet—Eleusine coracana)-fallow (7%), maize-potato (7%), rice-coracana)-fallow (4%), ragi-potato (4%), and fallow-wheat (4%). See Table 2 for complete details.
4. The lower portions of the uplands (mid-uplands) and the medium lands are distinguished by the rice varieties that are grown, as influenced by soil moisture availability. In the mid-uplands (or baad), medium-duration rice varieties are grown, whereas, lower down the toposequence in the medium land where soil moisture is available for a longer period, long-duration rice varieties are grown. These medium lands are known as ajan in Giridih and kanali in Purulia. Winter crops such as rapeseed, linseed, barley, lentil, and gram can be cultivated successfully following the monsoon-season rice crop, using residual soil moisture, particularly in the mid-uplands. In the medium lands, the most common
cropping pattern is still rice-fallow, which covers 87% of the total medium land plots (see
Table 2).
5. Although the lowlands are the most fertile, excessive moisture and poor drainage limit cropping to only rice, and constrain growing winter crops after the main rice season. Pres-ently, most farmers grow traditional long-duration rice varieties with low inputs of manure. The rice-fallow cropping pattern is practiced on as much as 91% of lowland plots (see Table 2).
In general, the plateau soils are low in organic matter as well as available phosphorus, and have medium levels of potassium (150 to 300 kg ha–1). The
soil is slightly acidic in some areas. The soil fertility characteristics also vary with landscape position and with intensity of cultivation. Table 4 summarizes the main soil chemical properties for samples taken from rice fields at different landscape positions in Luppi village in Giridih District. There is a marked differ-ence in the soil fertility level of the barhi and tanr in the uplands because of the higher inputs applied to the barhi lands, which are the most intensively cultivated. Apart from the barhi land, there is a systematic trend of increasing soil fertility from the uplands to the lowlands.
[image:16.612.72.523.479.616.2]Because of the risky environment and the relative difficulty in gaining access to markets, food security is a primary concern of households in the study area. As a result, large amounts of the resources of farm households (especially family labor) are
Table 3. Percentage share of plots left fallow by season and by land type.
Season Land type
Upper terrace Bari Mid-upland Medium land Lower terrace
Kharif 25 28 2 1 3
Rabi 74 36 79 88 92
Table 2. Crops planted in kharif (monsoon) and rabi (winter) seasons by land type.
Upper terrace Bari Mid-upland Medium land Lower terrace
Crops % of Crops % of Crops % of Crops % of Crops % of
(kharif-rabi) plots (kharif-rabi) plots (kharif-rabi) plots (kharif-rabi) plots (kharif-rabi) plots
Rice-fallow 41 Fallow-potato 16 Rice-fallow 78 Rice-fallow 87 Rice-fallow 91
Fallow-nonrice 18 Maize-fallow 15 Rice-wheat 10 Rice-wheat 6 Rice-rice 3
Pulses-fallow 10 Marua-fallow 7 Rice-potato 4 Other 7 Rice-potato 1
Fallow-fallow 7 Maize-potato 7 Other 8 Other 6
Other 24 Rice-fallow 4
Fallow-wheat 4
Other 46
[image:16.612.157.435.651.715.2]typically applied to rice production, particularly in the rainy season, for their own consumption. Various surveys show that, except for the case of barhi lands, most of the other plots are left fallow during the nonmonsoon season. However, this does not mean that the household labor force is left idle; many members are engaged in a wide variety of
nonagricultural income–earning activities during the agricultural off-season, as will be described in the section on “High incidence of poverty.”
Agricultural production
Low productivity and limited use of modern technologies
Agriculture in our sample villages is largely rice-based, with a very strong subsistence orientation. The average yield of paddy across all land types, seasons, and villages during the survey years was 2.8 t ha–1
(see Table 5). This yield level, however, appears to compare favorably with eastern Indian standards based on aggregate data. The average rice yield
during 1990-97 across seven eastern Indian states was 2.0 t ha–1 (Pandey et al 2003). The average paddy
yield within the eastern Indian plateau (covering the plateau area of Bihar, Orissa, West Bengal, and eastern Madhya Pradesh states) during 1995-97 was 1.6 t ha–-1.
The average rice yield also observed across surveyed villages ranged from 2.3 t ha–1 (Kumardi
village in Purulia District) to 3.2 t ha–1 (Fateha village
in Giridih District) (see Table 6). Because of the higher intensity of input use as well as differences in soil fertility and production systems in lowland plots and land on the higher levels of the toposequence, rice yields are highest in plots on the lower terraces or lowlands. Average rice yields in upland, barhi land, mid-upland, medium land, and lowland were 2.1, 2.5, 2.5, 3.0, and 3.3 t ha–1, respectively (see Table 7). The
[image:17.612.358.539.370.568.2]average yield of high-yielding rice varieties is higher than that of traditional varieties by 20% to 40% depending on land type and this yield differential tends to be larger on upper terraces than on lower terraces (see Table 7).
Table 5. Average paddy yield by season.
Season Number of plots Average yield (kg ha–1)
Kharif 1,161 2,743
Rabi 14 4,483
Summer 1 2,808
All-season average 1,176 2,764
Table 6. Average paddy yield by village (kharif season).
Village District Number of Average yield plots (kg ha–1)
Charak Patla Giridih 69 3,118
Fateha Giridih 63 3,218
Fulchi Giridih 66 3,013
Luppi Giridih 74 2,540
Mangodih Giridih 63 2,577
Naitanr Giridih 87 2,911
Palkia Giridih 94 2,375
Parsatanr Giridih 65 3,044
Simulia Purulia 72 2,747
Baligara Purulia 130 2,659
Kalidaha Purulia 68 2,655
Kumardi Purulia 64 2,344
Patharkata Purulia 70 2,705
Tilaboni Purulia 61 2,905
Gokulnagar Purulia 51 2,641
Sarjumhato Purulia 64 2,642
Giridih average 581 2,824
[image:17.612.90.341.375.456.2]Purulia average 580 2,663
Table 7. Average paddy yield by land type and by rice variety (kharif season).
Land type Aggregated yield (traditional and modern varieties) Yield differentiated by modern and traditional varieties
Number of plots Average yield Average yield: Share of area Average yield: Share of area (% share) (kg ha –1) modern planted with MVs traditional varieties planted with TVs
varieties (%) (kg ha–1) (%)
(kg ha–1)
Upland 109 (11) 2,115 2,915 6 2,075 94
Barhi 39 (4) 2,539 3,404 13 2,409 87
Mid-upland 462 (45) 2,459 3,210 9 2,372 91
Medium 148 (14) 3,028 3,631 24 2,796 76
[image:17.612.90.296.504.566.2]Lowland 268 (26) 3,282 3,764 21 3,132 79
Table 4. Chemical properties of soils across predominant land types.
Ecosystem No. of pH Org. C Av P Av K Total N C/N samples (%) (kg ha–1) (kg ha–1) (%) ratio
Upland (barhi) 6 6.6 0.75 23 249 0.07 10
Upland (tanr) 3 5.5 0.38 12 84 0.03 11
Mid-upland 6 5.5 0.53 18 82 0.05 12
Medium 6 6.3 0.56 21 267 0.05 12
Lowland 21 6.4 0.77 24 185 0.07 11
[image:17.612.91.539.603.720.2]12
[image:18.612.80.519.409.723.2]Pair-wise tests of the difference in means (t test) further reveal that per hectare cash expenses are significantly lower on upland than on medium land and lowland, and cash expenses on mid-upland are lower than those on lowland. The average per hectare value of rice produced is significantly lower on upland and mid-upland than on other land types. The net rice income (before subtracting the shadow value of the cost of family labor) is higher on lowland and medium land and lowest on upland. With family labor costs (valued at observed market wage rates) included, however, the average net income (after subtracting both cash and family labor) turns negative for the upland, barhi, and mid-upland, while remain-ing positive for medium land and lowland. This is a result of the high shadow value of the labor cost that, in turn, is due to the high labor intensity of the production system, especially on barhi plots (Table 8).
The use of modern technology in agricultural production was relatively limited among the sampled households. The rate of adoption of improved crop varieties (HYVs), measured by the share of the households adopting HYVs, ranged from 3% (among wheat-cultivating households) for wheat to 51% for
Table 8. Production costs and returns across land types.
Rice Total cash Total value Value of rice Net returns Net returns production expenses family labor produced (cash and family (only cashof
(kg ha–1) (Rs. ha–1) applied (Rs. ha–1) labor costs expenditures (Rs. ha–1) subtracted) subtracted)
(Rs. ha–1) (Rs. ha–1)
Averages (all)
All kharif rice 2,733 4,781 5,772 10,642 146 5,873
Land type = upland 2,160 3,645 5,770 8,248 –734 4,611
Land type = barhi 2,646 6,279 13,613 12,375 –7,517 6,096
Land type = mid-upland 2,392 4,480 5,550 9,229 –801 4,749
Land type = medium 3,202 5,360 4,776 12,167 2,031 6,808
Land type = lowland 3,262 5,201 5,673 12,802 1,997 7,648
Difference of means t-test results Upland vs barhi land
P-value: upland>barhi 0.08 0.01 0.05 0.00 0.11 0.28
Upland vs mid-upland
P-value: mid-upland>upland 0.04 0.16 0.02 0.02 0.07 0.15
Upland vs medium land
P-value: medium>upland 0.00 0.00 0.26 0.00 0.01 0.01
Upland vs lowland
P-value: lowland>upland 0.00 0.00 0.91 0.00 0.00 0.00
Barhi vs mid-upland
P-value: mid-upland>barhi 0.29 0.06 0.04 0.01 0.11 0.30
Barhi vs medium
P-value: medium>barhi 0.04 0.36 0.02 0.86 0.03 0.61
Barhi vs lowland
P-value: lowland>barhi 0.02 0.26 0.04 0.71 0.03 0.24
Mid-upland vs medium
P-value: mid-upland>medium 0.00 0.05 0.19 0.00 0.00 0.00
Mid-upland vs lowland
P-value: mid-upland>lowland 0.00 0.03 0.81 0.00 0.00 0.00
Medium vs lowland
P-value: lowland>medium 0.67 0.74 0.16 0.29 0.97 0.23
rice, on average, across all the sampled villages. This compared unfavorably to the estimated 70% HYV adoption rate for rice in eastern India as a whole (Pandey et al 2003). Furthermore, based on our plot-level data, only 21% of the rice planted area during the kharif season was planted with HYVs. The HYV adoption rate, however, differs somewhat across land types; the HYV adoption rate is roughly twice as high on medium land and lowland as on upper terraces.
nonuse (as provided by survey respondents) being lack of funds or lack of know-how.2 Less than
one-third (31%) of the surveyed farms reported applying urea. Less than a third (roughly 30%) of the house-holds reported using irrigation and the main reason
2 In addition, pest pressure and yield loss may be low because of the relatively low adoption rate of modern varieties.
Table 9. Agricultural practices of surveyed households.
Type of practice Share (%) of households adopting
Overall Giridih Purulia
Use of improved crop varieties
Paddy 51 38 66
Maize 5
Wheat 3
Potato 24 36 10
Reason for nonadoption of improved rice varieties
Seed too costly 24 100 13
Risky 23 0 23
Method used to sow rice and reason for adoption
Transplanting 89 81 76
Cost-effective 9 0 18
Proper management 16 3 31
Good yield 43 4 87
Behind plow 9 15 11
Proper management 17 32 0
Good yield 23 32 13
Broadcasting (direct seeding) 2 4 14
Lack of know-how 6 3 11
Traditional practices 28 47 5
Mixed cropping/intercropping
practices 24 42 7
Reason for adoption
More stability 17 29 2
Avoid risk 13 19 4
Increase total production 11 18 4 Reason for nonadoption
Sole crop has higher yield 10 – –
Lack of know-how 48 25 77
Seed proportion unknown 9 5 15 Farmyard manure/chemical fertilizer
application 86 – –
Adoption
FYM only 30 24 36
FYM + fertilizer 60 55 66
Reason for nonadoption
High price 1 1 2
Lack of funds 6 3 8
Fertilizer damages soil 1 – –
Use of inseticides/pesticides on rice 42 37 47 Reason for adoption
Higher yield 37 37 39
Reduce riskiness 12 0 27
Reason for nonadoption
Lack of funds 33 35 31
Lack of know-how 19 26 11
Irrigation on rice crop 29 29 30
Reason for adoption
Better-quality grain or straw 14 – –
Good yield 27 – –
Reason for nonadoption
Lack of sources 46 27 67
Lack of funds 8 13 2
for not using irrigation is reportedly “lack of re-sources” (i.e., money for pumping equipment, inaccessibility of water) (Table 9).
Subsistence orientation
Food security appears to be the prime objective of the surveyed farms, resulting in their strong orientation toward subsistence in production. Anecdotal evidence and oral histories suggest past vulnerability of the sampled households to years of hunger and starvation, which would explain the fixation on satisfying food security. While 90% of the households are reportedly engaged in rice production, for example, only 21% reported selling of rice during the year covered by the survey. Similarly, 22% of the households produce potato, but only 2% reported selling potato, and 21% produce but none reported selling maize (see Table 10).
The subsistence orientation of surveyed farm households is further demonstrated by the fact that, across all crops, only 23% of the surveyed households reported the sale of any farm output. The sale of farm outputs provided only 3% of the total household gross income, on average, whereas the imputed value of home-consumed farm outputs equaled 34% of the total household gross income (Table 11).
The surveyed farms’ activities in agricultural output markets predominantly involved transactions in the rice market. Among the total number of reported incidences of crop sales among surveyed farms, 49% involved rice, 12% potato, 11% maize, 9% millet, 7% horsegram, and 7% wheat (see Table 12). The concentration of product sales on
nonperishable grains indicates that transportation costs (i.e., poor transportation infrastructure makes it costly and time consuming to transport goods to market) may constrain commercial agricultural activities in the study area, and the focus on rice suggests that commercial markets for crops aside from rice are quite limited.
[image:19.612.98.477.171.708.2]Subsistence orientation also dominates the surveyed farms’ animal husbandry activities. The
Table 10. Production and sale of farm output.
Output % of households
Rice
Reported rice production 90
Reported sale of rice 21
Potato
Reported potato production 22
Reported sale of potato 2
Maize
Reported maize production 21
14
[image:20.612.70.531.436.719.2]imputed value of home consumption of livestock and poultry (including both “main products” such as milk and eggs and “by-products” such as animal dung) averaged Rs. 3,565 (about US$90 at the 40 Rs. = $1 exchange rate that prevailed in 1997), while the average income from livestock sales was only Rs. 570 (roughly US$14) across all households. The sale of livestock/poultry was reported by only 19% of the households and income from such sales made up only 2% of the total gross income on average. The total imputed value of home consumption of livestock and poultry equaled 13% of the total gross income (Table 11).
The participation of surveyed households in markets for agricultural inputs was also low. Farmers generally appear reluctant to use purchased inputs or to make investments because of the high risk of crop failure—which threatens loss of costs of purchased inputs and investments—, because of the high transactions costs (i.e., inaccessibility to markets makes it costly to purchase inputs in markets) and because of the low adoption of HYVs. The rates of application of purchased chemical inputs were reviewed above. The share of the households report-ing hirreport-ing of paid labor across the principal tasks required for rice cultivation was 14% (for weeding), 36% (for threshing), and 40% (for transplanting). The rental of capital equipment or draft animals among
surveyed farms was also infrequent; the shares of households reporting having rented or leased land, draft animals, or various machinery were 0%, 13%, and 6%, respectively (Table 13).
High incidence of poverty
Income and wealth
A defining characteristic of the households in our study area is their predominantly low standard of living and high incidence of poverty. According to official poverty estimates of the Indian government, the incidence of poverty in our study area was among the highest in the country. Statewide headcount poverty ratios in Bihar and West Bengal were the second and third highest in 1987-88, first and fifth highest in 1993-94, and second and fifth highest in 1999, respectively (Deaton 2001). The standard of living among our sampled households can be meas-ured using estimated household incomes (per capita), the value of assets/wealth held by surveyed house-holds, and the ease of access to public services providing basic needs such as education and potable water.
Among all 16 sampled villages, the estimated average annual household gross income was Rs. 27,269 (equivalent to about $680 at the exchange rate prevailing at the time of the survey), while the
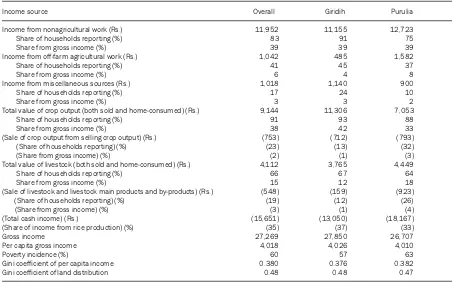
Table 11. Income composition, poverty, and inequality among surveyed households.
Income source Overall Giridih Purulia
Income from nonagricultural work (Rs.) 11,952 11,155 12,723
Share of households reporting (%) 83 91 75
Share from gross income (%) 39 39 39
Income from off-farm agricultural work (Rs.) 1,042 485 1,582
Share of households reporting (%) 41 45 37
Share from gross income (%) 6 4 8
Income from miscellaneous sources (Rs.) 1,018 1,140 900
Share of households reporting (%) 17 24 10
Share from gross income (%) 3 3 2
Total value of crop output (both sold and home-consumed) (Rs.) 9,144 11,306 7,053
Share of households reporting (%) 91 93 88
Share from gross income (%) 38 42 33
(Sale of crop output from selling crop output) (Rs.) (753) (712) (793)
(Share of households reporting) (%) (23) (13) (32)
(Share from gross income) (%) (2) (1) (3)
Total value of livestock (both sold and home-consumed) (Rs.) 4,112 3,765 4,449
Share of households reporting (%) 66 67 64
Share from gross income (%) 15 12 18
(Sale of livestock and livestock main products and by-products) (Rs.) (548) (159) (923)
(Share of households reporting) (%) (19) (12) (26)
(Share from gross income) (%) (3) (1) (4)
(Total cash income) (Rs.) (15,651) (13,050) (18,167)
(Share of income from rice production) (%) (35) (37) (33)
Gross income 27,269 27,850 26,707
Per capita gross income 4,018 4,026 4,010
Poverty incidence (%) 60 57 63
Gini coefficient of per capita income 0.380 0.376 0.382
average per capita annual gross income was only Rs. 4,018 (about $100) (Table 11). The village average per capita gross income among surveyed households ranged from a low of Rs. 3,003 (in Naitanr village in Giridih District) to a high of Rs. 6,474 (in Charak Patla village, also in Giridih District) (Table 14). The planning commission’s official poverty line for 1999 (Deaton 2001) and the estimated per capita gross income indicated that 60% of the sampled households were poor (Table 11). Across the surveyed villages, the estimated headcount poverty ratio ranged widely, but all had a substantial portion of their population considered poor. Poverty incidence was lowest in Charak Patla village (24%) and highest in Patharkata village (82%) (see Table 14). Average per capita gross income is the same for Giridih (Rs. 4,026) and Purulia (Rs. 4,010); however, because of the higher
cost of living—thus, higher local rural poverty line— in West Bengal, the estimated headcount poverty ratio is higher in Purulia (63%) than in Giridih (57%) (Table 11).
[image:21.612.324.539.177.459.2]Another basis upon which to draw conclusions about the standard of living enjoyed by surveyed
Table 12. Crop sales reported by surveyed households (no. and % share of instances crop sold across households).
Crop Number Percent
Rice 488 49
Potato 119 12
Maize 113 11
Millet 87 9
Horsegram 66 7
Wheat 64 7
Small millet 9 1
Sorghum 7 1
Sugarcane 4 0
Other cropsa 31 3
Totalb 988 1
aIncludes vegetable crops, lentils, oilseeds, and other crops sold very
infrequently.
bExcludes eight instances in which a farm reported selling a crop with an
[image:21.612.89.305.333.460.2]unidentified code.
Table 14. Average per capita income and poverty incidence by village.
Village District Average per capita Poverty Percentage of gross income (Rs.) incidence (%) nonagricultural income
Charak Patla Giridih 6,474 24 19
Fateha Giridih 4,203 49 43
Fulchi Giridih 4,240 65 35
Luppi Giridih 3,790 57 45
Mangodih Giridih 3,588 63 39
Naitanr Giridih 3,003 71 33
Palkia Giridih 3,556 62 36
Parsatanr Giridih 4,318 54 55
Simulia Purulia 4,376 59 47
Baligara Purulia 4,270 59 29
Kalidaha Purulia 3,902 62 36
Kumardi Purulia 4,218 56 37
Patharkata Purulia 3,127 82 49
Tilaboni Purulia 3,813 59 21
Gokulnagar Purulia 5,473 50 55
Sarjumhato Purulia 2,874 79 36
Table 13. Market participation by the sampled households.
Market % of households active in market
Labor
Land preparation
Male 33
Female 17
Transplanting
Male 25
Female 40
Weeding
Male 14
Female 28
Harvesting
Male 26
Female 37
Threshing
Male 36
Female 14
Capital equipment and draft animal rental
Land rental 0
Draft power 13
Machine 6
Irrigation 4
Fertilizer
FYM (for rice) 34
Urea (for rice) 31
DAP (for rice) 27
Plant protection
16
households is to consider their asset holdings. Survey results suggest that asset holdings among sampled households were quite limited. For example, about one quarter of our sampled households reported owning no household appliance. Among major household appliances, only 23% of the households reported owning a radio and only 5% reported owning a TV set. Just under a third (32%) of the sampled households reported owning animal-powered transportation, not a single household reported owning an automobile, and only 4% reported owning a motorcycle. Most households (78%), however, did report owning human-powered transportation (such as bicycles). For complete details on household owner-ship of appliances and equipment, see Table 15.
Ownership of agricultural implements and machinery was similarly limited, according to the survey results. The total average value of agricultural implements across all households surveyed was Rs. 3,035 (equivalent to about $76). Village-level means ranged from Rs. 566 to Rs. 18,528—mainly because of variations in the ownership of tractors, rice mills,
and water pumps, which are quite rare in any case. Ownership of mechanical threshers was reported in only five villages, and water pumps were found in only seven of the 16 villages. Tractor ownership was similarly rare, with tractors being reported in only three villages. Bullock carts (reportedly owned by about one-third of households) were found among surveyed households in all villages and rice mill ownership was reported in only one village. Owner-ship of smaller hand tools and other common agricul-tural implements was found in nearly all the house-holds surveyed. Ninety-six percent of our sample households reported owning either hand tools or animal-driven equipment (Table 15).
[image:22.612.124.459.374.707.2]Survey results suggest that livestock are held mainly for the draft power they can provide (i.e., for plowing or for pulling a cart) and as a form of savings, but they are rarely sold in the market. The mean value of total livestock holdings was Rs. 7,926 across all households surveyed. Nearly two-thirds (64%) of the sampled households reported bullock ownership, and on average they owned two bullocks
Table 15. Farm capital equipment holdings of surveyed households.
General indicators of capital and equipment holdings Value or %
Farm tools and equipment
Total value of all agricultural implements (Rs.) 3,025
Owned only basic hand tools (%) 91
Owned hand tools + animal-driven equipment 96
Owned some power-driven equipment 4
Household appliances and amenities (%)
Reported owning no appliances 25
Owned at least one minor appliance 53
Owned some cooking appliance(s) 17
Transportation (%)
Reported owning no private transportation 13
Owned only human-powered transportation 78
Owned animal-powered transportation 32
Ownership of particular items Farming tools and machinery
Share of households reporting ownership of a “desi” plow (%) 82
Value (Rs.) 187
Share of households reporting ownership of a mechanical thresher 2
Value (Rs.) 2,625
Share of households reporting ownership of a diesel water pump (%) 3
Value (Rs.) 13,750
Share of households reporting ownership of a tractor (%) 1
Value (Rs.) 203,557
Share of households reporting ownership of a rice mill (%) 0
Value (Rs.) 200,000
Household appliances and amenities (%)
Share of households reporting ownership of a radio 23 Share of households reporting ownership of a clock/watch 50 Share of households reporting ownership of a television 5 Share of households reporting ownership of an electric fan 4 Transportation equipment (%)
per household. The reported ownership rate of other smaller livestock or poultry was lower but still significant. Surveyed households reported owning goats, chickens, buffalos, cows, and calves at rates of 46%, 16%, 15%, 39%, and 11%, respectively (Table 16).
Other indicators of household welfare
Apart from the level of household income and asset holdings, the living standard can also be measured by household satisfaction of basic needs. In terms of access to education, results from the 1991 census show that the incidence of illiteracy in the area was high: 65% in Purulia and 80% in Giridih.3 The
average years of schooling among the household
heads was 3.6 years, with Purulia again displaying better levels of educational attainment than Giridih (3.9 years in Purulia versus 3.4 in Giridih).
Access to other basic public services also appears low, according to survey results (see Table 17). Less than 12% of the sampled households had access to electricity. In seven of the 16 surveyed villages, none of the sampled households had access to electricity. Among the nine other villages, the proportion of households with access to electricity ranged from 3% to 33%. The source of drinking water for the majority of households is dug wells (54%), but other sources include tube wells (20%), “tanks” (ponds) (9%), rivers (8%), temporary dug wells (5%), and the tap (piped-in water) (2%) (Table 18). On average, households reported that a walk of 11.4 minutes is required to reach their nearest source of water. This represents a significant labor burden on female members of the household, who are princi-pally responsible for fetching water for household needs. These travel times vary markedly across surveyed villages, with a low of 4.5 minutes in Parsatanr village, where most households have access to dug wells, and a high of 27 minutes in Palkia, where the only water source for most of the house-holds is a neighboring river (Table 17). The inaccessi-bility of most of the surveyed villages, as mentioned earlier, also suggests that access to other public services (e.g., health care, legal institutions, social welfare) is difficult and time-consuming.
3 Although India carried out a census in 2001, results at the state and district level for eastern states are not yet available.
Table 17. Access to electricity and water by village.
Village District Percentage of households Average travel time
with access to electricity to reach water source (min.)
Charak Patla Giridih 0 13.8
Fateha Giridih 0 9.3
Fulchi Giridih 0 9.9
Luppi Giridih 0 9.2
Mangodih Giridih 0 9.6
Naitanr Giridih 0 12.0
Palkia Giridih 3 26.6
Parsatanr Giridih 31 4.5
Simulia Purulia 3 13.7
Baligara Purulia 27 12.1
Kalidaha Purulia 18 6.5
Kumardi Purulia 24 15.6
Patharkata Purulia 12 14.1
Tilaboni Purulia 0 10.1
Gokulnagar Purulia 32 7.7
Sarjumhato Purulia 29 9.5
Giridih District average 5 11.7
Purulia District average 18 11.2
[image:23.612.121.503.486.699.2]All villages 12 11.4
Table 16. Average livestock holdings of surveyed farms. Total value of current livestock holdings is Rs. 7,926.
Type of livestock Number or %
Share of households reporting owning a bullock 64%
Number owned 2.1
Share of households reporting owning a chicken 16%
Number owned 3.8
Share of households reporting owning a pig 3%
Number owned 2.9
Share of households reporting owning a goat 46%
Number owned 2.8
Share of households reporting owning a cow 39%
Number owned 2.2
Share of households reporting owning a calf 11%
Number owned 2.0
Share of households reporting owning a buffalo 15%
18
Sources of household income
Role of nonagricultural income. Diversification of income sources is one of the most prevalent house-hold strategies for coping with risk and vulnerability in rural areas with less favorable economic and agro-climatic conditions. The adoption of income diversifi-cation strategies seems clearly apparent among the farm households surveyed for this study, and is displayed in the diversification of employment in which families apply their labor and in household agricultural activities.
Looking at the primary occupation of working-age household members reported in our Purulia survey (data on primary and secondary occupations of household members were not obtained in Giridih), the most commonly observed occupation is “unpaid family labor on family farm,” which was reported by 50% of the total individuals across the surveyed households that reported having a principal occupa-tion. The next most common principal occupation of surveyed individuals was miner (20%), followed by casual day laborer (10%) and paid full-time or
part-time agricultural laborer (4%). For secondary occupa-tions, the most frequently reported occupations were, again, unpaid family labor on family farm (45%), casual day laborer (19%), and paid full-time or part-time agricultural laborer (13%) (Table 19). These results suggest that the economic activities of our sampled households are largely dominated by unpaid family labor on family farms and in agriculturally related jobs, but also show that there is significant diversity in the occupational activities of surveyed households. This diversity is even clearer when we examine this issue from the perspective of the share of household income derived from different types of employment (see the discussion below). Results make clear that the share of the households engaged in formal labor markets is relatively low—a little more than third of the male workers (35%) and one-quarter of the female workers (28%) reported being employed in wage-paying jobs according to our survey. Table 19 summarizes the full survey results regarding the principal and secondary occupations of individuals surveyed.
Table 19. Primary and secondary occupations of workers from surveyed households.
Primary occupation category Total % Secondary occupation category Total %
frequency frequency
Family labor (unpaid) working on family’s farm 555 49.6 Family labor (unpaid) working on family’s farm 232 45.0 Family labor (paid) working on family’s farm 4 0.4 Permanent (year-round) full-time agricultural 2 0.4 Permanent (year-round) full-time agricultural 9 0.8 laborer
laborer Permanent (year-round) part-time agricultural 65 12.6
Permanent (year-round) part-time agricultural 42 3.8 laborer
laborer Part-time worker in industry/manufacturing 1 0.2
Full-time service worker in private sector 21 1.9 Full-time service worker in private sector 3 0.6 Part-time service worker in private sector 2 0.2 Part-time service worker in private sector 2 0.4 Full-time service worker in public sector 24 2.1 Self-employment in small-scale manufacturing 31 6.0
Part-time service worker in public sector 1 0.1 Merchant 24 4.7
Artisan/craftsperson 2 0.2 Grocery shop 2 0.4
Self-employment in small-scale manufacturing 20 1.8 Construction worker (houses, buildings, roads) 2 0.4
Grocery shop 9 0.8 Worker in mining 31 6.0
Merchant 32 2.9 Transportation worker 4 0.8
Worker in mining 225 20.1 Homemaker 3 0.6
Occasional nonagricultural job 2 0.2 Retired/receiving pension 5 1.0
Transportation worker 5 0.4 Other (private tutor) 7 1.4
Homemaker 9 0.8 Doctor 2 0.4
Handicapped or suffering illness 6 0.5 Daily laborer 100 19.4
Retired/receiving pension 24 2.1
Unemployed 4 0.4
Other (private tutor) 8 0.7
Doctor 6 0.5
Daily laborer 107 9.6
[image:24.612.79.521.449.721.2]Singer 2 0.2
Table 18. Sources of drinking water for surveyed households.
Source Dug well Tube well River Community Temporary Tap Own tank Other tank dug well
% share of
Despite the predominance of agricultural employment in terms of the reported frequencies of the primary and secondary occupations of surveyed household members, nonagricultural income plays an important role in its contribution to household income. As mentioned earlier, with the exception of the relatively small-scale barhi plots, most plots are left fallow after the monsoon season, which frees household labor for nonagricultural income–generat-ing activities outside the monsoon season, or to engage in part-time nonagricultural activities during the growing season. Households surveyed reported engaging in a wide variety of nonagricultural income– earning activities. Eighty-three percent of the sampled households are engaged in some kind of nonagricul-tural employment (Table 11). Considered alongside the high share of household workers mentioning work on the family farm as their primary (or secondary) occupation, this indicates that most households work their farms on a part-time or seasonal basis.
Nonagricultural income, although rarely the main employment of workers in surveyed house-holds,4 represented an important share of total
house-hold income. Averaged across all househouse-holds, non-agricultural income sources contribute 39% of the total (gross) household income. This share is roughly the same as the share of the income contribution by crop production (38%) when the value of agriculture is estimated considering the imputed market value of crops produced and consumed on the family farm (36%) as well as income from sales of farm output (only 2%). The imputed value of household income from livestock and animal/poultry raising provided less than one-fifth of family income, averaging a 15% share (including both the imputed value of home consumption and market sales) across all surveyed households. The remaining income reportedly came from a variety of miscellaneous sources, and ac-counted for only 3% of total gross income when averaged across all households surveyed (Table 11).
The figures cited in the previous paragraph refer to broad averages across all households in the two districts and 16 villages where the survey was conducted. However, both the average share of nonagricultural income and the types of nonagricul-tural economic activities households engaged in varied widely across villages. The village-level average share of nonagricultural income ranges widely between a low of 19% in Charak Patla village in Giridih and a high of 55% in Parsatanr village in Giridih and Gokulnagar village in Purulia (Table 14). In some villages, household self-employment (or small household enterprises) such as rope making,
construction, masonry, coal mining, brick making, making tobacco products (such as bidi), and the production of bamboo crafts (e.g., baskets) represents an important source of income. Income from off-farm employment is a more important source of nonagri-cultural income in other villages. The most typical type of off-farm nonagricultural employment reported among workers from surveyed households involved work as casual day laborers in the service sector (e.g., rickshaw puller, construction laborer, soil cutting, tea stall, and other types of shop employee). A common feature of both the on- and off-farm nonagricultural activities that surveyed households engaged in was the high labor intensity and relatively low labor productivity of these jobs, which were associated with low levels of earnings from these jobs. However, a relatively small number of workers were employed full-time in stable nonagricultural jobs such as agricultural extension, railway workers, schoolteach-ers, and employees at mining companies (in Giridih), and employment in these jobs was associated with higher levels of remuneration. In some surveyed villages, seasonal migration of workers to other rural areas under irrigation or that enjoy a longer rainfed growing season provided an important source of seasonal employment and household income (see Table 11 for details). Instances of families sending seasonal migrants to major cities such as Delhi, Bombay, and Kolkata were also observed in the survey results.
The importance of nonagricultural income for many households in the area suggests that any technological intervention in agriculture (especially innovations involving cultivation during the winter season) needs to take into account the opportunity costs of labor in nonagricultural activities. The existing patterns of nonmonsoon season employment or migration suggest that the introduction of agricul-tural activities in fallowed fields is unlikely to be adopted unless the returns to labor are at least as high and as secure as those currently available through nonagricultural employment or migration to agricul-tural jobs elsewhere. At the same time, the low productivity (thus low return) of most nonagricultural economic activities observed in the area suggests that farm households perceive the potential returns from agricultural production—once subsistence needs have been satisfied—to be very low given present bio-physical and socioeconomic conditions in the area.
20
Table 11). The importance of rice income to the household’s overall income was positively correlated with the size of landholdings. The share of gross rice income in the total household gross income among the landless, marginal, small, medium, and large farmers was 6%, 31%, 46%, 51%, and 60%, respec-tively (see Table 20).
However, the relatively small average share of total gross income derived from rice (especially among the smaller landholders) carries important policy implications vis-à-vis efforts to improve the standard of living among poor households in the study area. It suggests that efforts to increase rice productivity alone are unlikely to contribute greatly to poverty reduction. Given the relatively high share of nonagricultural income in total household income among surveyed farms, a broader approach giving attention to ways of improving labor productivity in nonagricultural work, as well as improving rice cultivation and converting farming activities to the cultivation of higher-value crops, is needed to substantially improve household income. This point can be made clear by engaging in a small thought experiment. Let us assume that the average yield of rice could be doubled without increasing the level of any input (including labor)—a pure 100% rise in technical efficiency, and keeping nonrice income at current levels. Under this unrealistic scenario, the average per capita income of individuals in surveyed households would increase by only about 30% (from Rs. 4,018 to Rs. 5,273). The estimated poverty incidence (based on per capita gross income) would fall from 60% to 53%—a modest 12% reduction. In reality, dramatic increases in rice yields of this magnitude are largely unknown and the yield in-creases that have been achieved have been induced by technological innovations accompanied by increased input use (e.g., fertilizer, labor), or by moving from monocropping to double cropping. Even if new rice
technologies (both new varieties and cropping practices) enabled double cropping in the study area, adoption would be contingent upon households being able to secure needed inputs and profitably market the surplus rice, and returns would need to be higher than those from the low-productivity nonagricultural activities in which many are now engaged.
An alternative route for improving the welfare of poor households in the study area would be to focus on technological innovations that increase rice productivity in ways that release household labor and land resources for nonrice agricultural production and/or for nonagricultural activities but that enable households to more easily fulfill their subsistence demand for rice. Assessing the potential of such alternatives, however, demands a much more in-depth analysis than what is used in this introductory report. Nonetheless, the preliminary conclusion that even a dramatic yield increase in rice production alone would be unlikely to reduce rural poverty in eastern India, given the relatively small share of rice income among the poor in the area, provides a strong working hypothesis that could be explored in subsequent analysis.
Social and institutional influences on
household choices and outcomes
Caste system
Ethnically, the Chhotanagpur Plateau lies in what is commonly referred to as the tribal belt of eastern India because of the high proportion of individuals from scheduled tribes (ST) and scheduled castes (SC) in the population. Under Indian law, citizens from ST or SC are eligible for targeted public assistance and political representation in state and federal legisla-tures of ST and SC is guaranteed. These measures are intended to remedy past discrimination against ST and SC and to facilitate full participation of ST/SC members in the economy and polity.
Across the sampled villages, households of ST or SC background constitute an average of one-third of all households surveyed. The share of ST families was higher in Purulia than in Giridih, whereas the share of SC families was higher in Giridih than in Purulia (see Table 21). In general, survey results suggest that villages in Giridih tend to be more segregated (or to have more homogeneous populations defined in terms of their caste back-ground), whereas villages in Purulia had more heterogeneous populations in terms of caste composi-tion.
[image:26.612.72.287.594.722.2]There was wide variation in the share of ST/ SC families across the sampled villages. Categorizing
Table 20. Income sources and poverty of surveyed households by size of farm.
Landholding class Per capita Poverty Share of Share of gross income incidence nonagri- rice
(Rs.) (%) cultural income income (%)
(%)
Landless 3,092 69 64 6
Marginal farmers 3,340 69 42 31
Small farmers 4,441 52 30 46
Medium farmers 5,629 41 22 51
Large farmers 11,536 15 23 60
Average across