http://dx.doi.org/10.4236/jamp.2015.36076
How to cite this paper: Dagadu, C.P.K., Stegowski, Z., Sogbey, B.J.A.Y. and Adzaklo, S.Y. (2015) Mixing Analysis in a Stirred Tank Using Computational Fluid Dynamics. Journal of Applied Mathematics and Physics, 3, 637-642.
http://dx.doi.org/10.4236/jamp.2015.36076
Mixing Analysis in a Stirred Tank Using
Computational Fluid Dynamics
C. P. K. Dagadu
1*, Z. Stegowski
2, B. J. A. Y. Sogbey
1, S. Y. Adzaklo
1 1Ghana Atomic Energy Commission, Legon, Accra, Ghana2Faculty of Physics and Applied Computer Science, AGH-UST, Krakow, Poland
Email: *[email protected]
Received 21 March 2015; accepted 14 June 2015; published 17 June 2015
Copyright © 2015 by authors and Scientific Research Publishing Inc.
This work is licensed under the Creative Commons Attribution International License (CC BY).
http://creativecommons.org/licenses/by/4.0/
Abstract
In this study computational fluid dynamics (CFD) approach was used to study mixing in an Indus- trial gold leaching tank. The objective was to analyze the extent of mixing in the tank by producing visual images of the various mixing zones in the tank domain. Eddy viscosity plots that charac- terise the extent of mixing in the tank were generated in the flow field obtained by an Eulerian- Eulerian approach. The extent of mixing was found to be greatest in the circulation loops of the impeller discharge region and least at the top and bottom portions of the tank. Trailing vortices that contribute to some level of mixing were identified in between the impeller blades. This ap-proach could be used to enhance optimum design of mixing vessels and to eliminate the need for pilot plants.
Keywords
Computational Fluid Dynamics, Residence Time Distribution, Eulerian-Eulerian Approach, Multiple Reference Frame, Eddy Viscosity Plot, Turbulent Schmidt Number
1. Introduction
Mixing by turbulent agitation plays a very important role in most industrial reactors including metallurgical reactors that are used during mineral processing. The main aim of mixing is to provide mass transfer of material to promote better contact between reactor contents in order to obtain the required product quality in the shortest possible time [1] [2]. However, due to improper reactor design, mixing operations in many industrial systems are either inefficient or more than enough. This leads to poor product quality and overconsumption of energy that eventually results in high production costs [3] [4]. The primary cause is the lack of understanding of the
*
mixing process which could be attributed to the complex nature of impeller-induced flows in stirred vessels equipped with baffles [5] [6]. Therefore, there is the need for in-depth studies of mixing operations to determine mixing efficiency and overall performance of mixing vessels. A good understanding of mixing operations in stirred vessels will enhance optimal design and help modify existing processes which could lead to minimum capital and running costs.
Residence time distribution (RTD) analysis has been established as the best experimental method to study the flow and mixing properties of any stirred vessel [7] [8]. Although the RTD method has been employed by most researchers including [9]-[13] to study the hydrodynamics of flow systems, the approach is not capable of pro-viding explicit and detailed picture of the flowfield and thus the locations of the various mixing zones in stirred tanks. Therefore information from the RTD approach is not sufficient to completely understand the mixing process.
As a contribution to the understanding of mixing operations, the current study presents a comprehensive pic-ture of the mixing process in stirred tanks. It provides visual images and data that are needed to address the problems associated with design and process scale-up of mixing systems. This was achieved by resorting to CFD which involves solving the macroscopic balance equations that describe fluid flow in a system [also known as the Navier Stokes (N-S) equations]. In stirred tanks, the N-S equations are limited to the mass and momentum equations. These equations were used in an earlier study conducted by [14] where appropriate CFD Models were employed to generate the flowfield in an industrial gold leaching tank. As a continuation, the current study was carried out with the objective to simulate the mixing zones in the flowfield generated in the previous investiga-tion. Specifically, visual images of the various mixing zones were produced in order to analyze the extent of mixing in the tank.
2. Methodology
2.1. Computational Domain
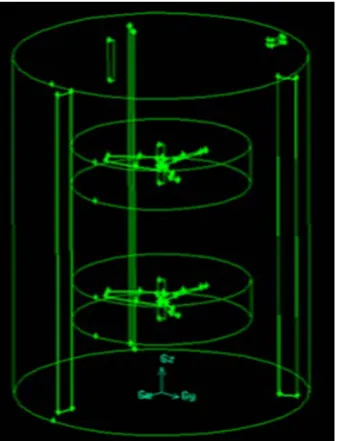
[image:2.595.215.384.481.702.2]The computational domain used for the simulation is an industrial gold leaching tank of 3000 m3 volume. It is equipped with three baffles spaced uniformly around the vessel periphery as shown in Figure 1. Mixing is by mechanical agitation of two hydrofoil impellers, type A310 mounted on a shaft concentric with the axis of the vessel. Detail description of the domain and all the relevant dimensions, such as tank height and diameter, im-peller diameter and clearance, are given in [14]. The MRF approach divides the computational domain into an inner region, in which the governing flow equations (continuity and momentum) are solved in a rotating frame-work and an outer region, in which the equations are solved in a stationary frame frame-work [15].
2.2. Computational Models
The computational models and their mathematical expressions used in this study are well explained in [14]. An Eulerian-Eulerian multi-fluid model was used to simulate multiphase flow where the liquid and solid phases are all treated as different continua, interpenetrating and interacting with each other everywhere in the computation-al domain. The turbulent kinetic energy and turbulent energy dissipation rate were simulated using the most es-tablished standard k−
model because of its simplicity, low computational requirement and good conver-gence for complex turbulent flows [16] [17]. The movement of the impeller in the tank region was simulated using a multiple reference frame (MRF) approach. The simulation was performed using Fluent 6.3 solver where a control-volume-based technique was used to convert the general scalar transport equations to algebraic equa-tions and then solved numerically using the pressure-based solver with segregated algorithm.3. Results and Discussions
A mixing process requires sufficient input of energy which is readily available in a turbulent flow. In stirred tanks, turbulent diffusivity is the simplest approach for quantitative analysis of turbulent flows and mixing in general. Turbulent diffusion is usually described by a turbulent mass diffusion coefficient (Dt), determined by
the turbulent Schmidt number (Sct) as given in Equation (1).
t ct
t
µ S
D
ρ
= (1)
where µt is the turbulent (eddy) viscosity. Sct measures the relative diffusion of momentum and mass due to
turbulence and is of the order of unity in all turbulent flows. According to [18] Sct is an empirical constant that is
relatively insensitive to the molecular fluid properties, hence little reason to alter the default value of 0.7. It fol-lows from Equation (1) that for a constant density
( )
ρ fluid, Dt is directly proportional to µt. Therefore in thepresent study, eddy viscosity plots have been used to analyse the extent of mixing in the tank.
Representative contour plots of turbulent eddy viscosityrepresenting the extent of diffusion (mixing) in the tank are displayed in vertical and horizontal planes as shown in Figure 2 and Figure 3 respectively. The plots show varying magnitudes of eddy viscosity throughout the solution domain where the diffusiveeffect isgreatest in the circulation regions and least at the top and bottom portions of the tank. Most of the mass and momentum transfer occur within the vortex core due to high levels of turbulence within the circulation regions resulting in high degree of mixing especially in the primary circulation loop as shown in Figure 2(a). However, in the strong impeller discharge [14] (the region between the two impellers) the extent of mixing is relatively low. Even though the flow velocity is greatest in the impeller discharge, the flow in this region is similar to plug flow hence low level of mixing.
[image:3.595.95.505.504.703.2]
(a) (b)
Figure 3. Contours of turbulent viscosity [kg/ms] in horizontal plane: (a) between top and upper impeller; (b) upper impeller position; (c) midway between two impellers; (d) lower impeller position; (e) 0.5 M from bottom of tank.
Figure 2(b) shows a vertical plane through the vortex region between the impeller tips and baffles where the extent of mixing is more highlighted. The high level of mixing in this region is attributed to baffle-vortex inte-raction resulting in intense flow dispersion.
Eddy viscosityplots in horizontal planes represent the mixing levels at various depths in the tank. Figure 3(c) highlights the region of highest extent of mixing occurring in the primary circulation loop of the strong impeller discharge. A significant degree of mixing is observed in between the impeller blades as shown in Figure 3(b). This brings into mind the effect of small vortices that trail each impeller blade. Trailing vortices [19] are attri-buted to the high turbulent kinetic energy produce by the blades. The trailing vortices contribute to some level of mixing in the high velocity region of the impeller discharge and at the top section of the tank away from the im-peller shaft. Mixing at the bottom of the tank is mainly due to the dispersive effect of the secondary circulation loop located near the wall and baffles as shown in Figure 3(e).
It is also observed that at the boundaries of the circulation loops the eddy viscosityvalues decrease gradually into the surrounding fluid zones especially in the axial direction. This clearly indicates some amount of flow exchange between different mixing compartments and confirms results obtained by [13] and [20] using an RTD Approach and a Compartment Model Approach (CMA) respectively.
The approach used in this study could therefore serve as a tool to validate hydrodynamic investigations con-ducted by tracer experimentation and other methods such as the CMA. More importantly, it eliminates the need for pilot plants to predict the mixing performance of stirred vessels as the choice of design features such as im-peller type, number of imim-pellers and imim-peller clearances that are necessary to achieve optimum mixing can eas-ily be made by CFD simulation.
4. Conclusions
Contours of turbulent eddy viscosity,representing the extent of mixing in stirred tanks, were plotted in the flow fields of a gold leaching tank that was generated by an Eulerian-Eulerian approach. The following conclusions were made on the extent of mixing in the tank.
Mixing was not uniform throughout the tank as indicated by varying magnitudes of eddy viscosity in the tank domain.
Small vortices were observed trailing each impeller blade. They were responsible for some level of mixing in the high velocity region of the impeller discharge and at the top section of the tank.
The approach used in this study gives a comprehensive picture of the mixing process in stirred tanks that will enhance optimum design of mixing vessels.
Acknowledgements
The authors are grateful to the International Atomic Energy Agency, Abosso Goldfields Ghana Limited, Da-mang Gold Processing Plant and the Polish Committee for Scientific Research for the various forms of support given.
References
[1] Rihani, R., Legrand, J. and Bensmaili, A. (2009) Mixing in Milli Torus Reactor under Aerated Conditions. Chemical Engineering and Processing, 48, 1012-1019. http://dx.doi.org/10.1016/j.cep.2009.01.009
[2] Kuncewicz, C., Szulc, K. and Kurasinski, T. (2005) Hydrodynamics of the Tank with a Screw Impeller. Chemical En-gineering and Processing, 44, 766-774. http://dx.doi.org/10.1016/j.cep.2004.08.006
[3] Distelho, M.F.W. and Marquis, A.J. (2000) Scalar Mixing in the Vicinity of Two Disk Turbines and Two Pitched Blade Impellers. Chemical Engineering Science, 55, 1905-1920. http://dx.doi.org/10.1016/S0009-2509(99)00464-9
[4] Jayanti, S. (2001) Hydrodynamics of Jet Mixing in Vessels. Chemical Engineering Science, 56, 193-210. http://dx.doi.org/10.1016/S0009-2509(99)00588-6
[5] Delvigne, F., Destain, J. and Thonart, P. (2005) Structured Mixing Model for Stirred Bioreactors: An Extension to the Stochastic Approach. Chemical Engineering Journal, 113, 1-12. http://dx.doi.org/10.1016/j.cej.2005.06.007
[6] Raju, R., Balachandar, S., Hill, D.F. and Adriana, R.J. (2005) Reynolds Number Scaling of Flow in a Stirred Tank with Rushton Turbine. Part II—Eigen Decomposition of Fluctuation. Chemical Engineering Science, 60, 3185-3198. http://dx.doi.org/10.1016/j.ces.2004.12.040
[7] Gavrilescu, M., Radu, Z. and Tudose, R.Z. (1999) Residence Time Distribution of the Liquid Phase in a Concentric- Tube Airlift Reactor. Chemical Engineering and Processing, 38, 225-238.
http://dx.doi.org/10.1016/S0255-2701(99)00005-7
[8] Stegowski, Z. and Furman L. (2004) Radioisotope Tracer Investigation and Modelling of Copper Concentrate Dewa-tering Process. International Journal of Mineral Processing, 73, 37-43. http://dx.doi.org/10.1016/j.minpro.2003.08.003
[9] Pant, H.J., Sharma, V.K., Vidya Kamudu, M., Prakash, S.G., Krishanamoorthy, S., Anandam, G., Seshubabu Rao, P., Ramani, N.V.S., Singh, G. and Sonde, R.R. (2009) Investigation of Flow Behavior of Coal Particles in a Pilot-Scale Fluidized Bed Gasifier (FBG) Using Radiotracer Technique. Applied Radiation and Isotopes, 67, 1609-1615. http://dx.doi.org/10.1016/j.apradiso.2009.04.003
[10] Sugiharto, S., Suud, Z., Kurniadi, R., Wibisono, W. and Abidin, Z. (2009) Radiotracer Method for Residence Time Distribution Study in Multiphase Flow System. Applied Radiation and Isotopes, 67, 1445-1448.
http://dx.doi.org/10.1016/j.apradiso.2009.02.073
[11] Ghiyas, U.D., Imran, R.C., Mansoor, H.I. and Iqbal, H.K. (2009) Study of Axial Mixing, Holdup and Slip Velocity of Dispersed Phase in a Pulsed Sieve Plate Extraction Column Using Radiotracer Technique. Applied Radiation and Iso-topes, 67, 1248-1253. http://dx.doi.org/10.1016/j.apradiso.2009.02.024
[12] de Andrade Lima, L.R.P. and Hodouin, D. (2005) Residence Time Distribution of a Mechanically Agitated Cyanida-tion Tank. Minerals Engineering, 18, 613-621. http://dx.doi.org/10.1016/j.mineng.2004.10.006
[13] Dagadu, C.P.K., Akaho, E.H.K., Danso, K.A., Stegowsk, Z. and Furman, L. (2012) Radiotracer Investigation in Gold Leaching Tanks. Applied Radiation and Isotopes, 70, 156-161. http://dx.doi.org/10.1016/j.apradiso.2011.09.003
[14] Dagadu, C.P.K., Stegowsk, Z., Furman, L., Akaho, E.H.K. and Danso, K.A. (2014) Determination of Flow Structure in a Gold Leaching Tank by CFD Simulation. Journal of Applied Mathematics and Physics, 2, 510-519.
http://dx.doi.org/10.4236/jamp.2014.27059
[15] Khopkar, A.R., Mavros, P., Ranade, V.V. and Bertrand, J. (2004) Simulation of Flow Generated by an Axial Flow Im-peller: Batch and Continuous Operation. Chemical Engineering Research and Design, 82, 737-751.
http://dx.doi.org/10.1205/026387604774196028
[16] Meroney, R.N. and Colorado, P.E. (2009) CFD Simulation of Mechanical Draft Tube Mixing in Anaerobic Digester Tanks. Water Research, 43, 1040-1050. http://dx.doi.org/10.1016/j.watres.2008.11.035
[18] ANSYS Fluent Inc. (2006) Fluent 6.3 User’s Manual. Fluent Inc. Centrera Resource Park, 10 Cavendish Court, Leba-non, USA.
[19] Yeoh, S.L., Papadakis, G. and Yianneskis, M. (2004) Numerical Simulation of Turbulent Flow Characteristics in a Stirred Vessel Using the LES and RANS Approaches with the Sliding/Deforming Mesh Methodology. Chemical Engi -neering Research and Design, 82, 834-848. http://dx.doi.org/10.1205/0263876041596751
![Figure 2. Contours of turbulent viscosity [kg/ms] in vertical plane (a) at 0˚; (b) between impeller tips and baffles](https://thumb-us.123doks.com/thumbv2/123dok_us/8113092.791655/3.595.95.505.504.703/figure-contours-turbulent-viscosity-vertical-plane-impeller-baffles.webp)
![Figure 3. Contours of turbulent viscosity [kg/ms] in horizontal plane: (a) between top and upper impeller; (b) upper impeller position; (c) midway between two impellers; (d) lower impeller position; (e) 0.5 M from bottom of tank](https://thumb-us.123doks.com/thumbv2/123dok_us/8113092.791655/4.595.86.521.80.317/contours-turbulent-viscosity-horizontal-impeller-impellers-impeller-position.webp)
