Munich Personal RePEc Archive
Measuring Governance Using
Cross-Country Perceptions Data
Kaufmann, Daniel and Kraay, Aart and Mastruzzi, Massimo
2005
Online at
https://mpra.ub.uni-muenchen.de/8219/
Measuring Governance Using
Cross-Country Perceptions Data
Daniel Kaufmann, Aart Kraay, and Massimo Mastruzzi The World Bank
August 2005
Abstract: This paper describes an ongoing project to measure governance using
cross-country perceptions data. The governance indicators measure six dimensions of governance and cover 209 countries and territories for 1996-2004. They are based on several hundred individual variables measuring perceptions of governance, drawn from 37 separate data sources constructed by 31 different organizations. We present the estimates of governance, and the margins of error capturing the range of likely values for each country. We show how these margins of error should be taken into account when considering cross-country differences and changes over time in governance. We find that in a number of countries the quality of governance improved significantly in the short term. Yet deteriorations also took place in some other countries, while in many there was little change. There has been no worldwide improvement in governance on average. We argue that perceptions-based data provide valuable insights relative to objective data on governance, and that individual objective measures of governance provide an incomplete picture of even the quite particular dimensions of governance that they are intended to measure. We also show that margins of error are not unique to perceptions-based measures of governance, but are an important feature of all efforts to measure governance, including objective indicators. We also empirically investigate the importance of ideological biases in expert assessments of corruption and find little evidence that they are present.
Governance indicators and per capita incomes are highly correlated across countries. Recent research shows that this correlation captures an important causal effect running from measures of governance such as these to per capita incomes. Critics of this view argue that the correlation captures substantial reverse causation from incomes to governance, and is tainted by "halo effects" where rich countries receive good ratings simply because they are rich. We review available evidence on these two critiques and find it to be lacking.
The data, as well as a web-based graphical interface, are available at www.worldbank.org/wbi/governance/govdata/.
____________________________________
1818 H Street NW, Washington, D.C. 20433. [email protected], [email protected],
[email protected]. This paper is was prepared as a chapter for Handbook of Economic Corruption edited by Susan Rose-Ackerman. This chapter is substantially based on our earlier paper "Governance Matters IV: Governance Indicators 1996-2004" available at
http://www.worldbank.org/wbi/governance/pubs/govmatters4.html. We refer the interested reader to this paper for more details on our governance indicators and the underlying data. We would like to thank S. Radelet for excellent feedback, and M. Levy, G. Dunn, A. Karatnycky, R. Fullenbaum, A. Williamson, A. Bellver, S. Weber, D. Cingranelli, D. Richards, R. Writer, M. Wolkers, C. McLiesh, M. Gibney, C.
1. Introduction
"I often say that when you can measure what you are speaking about, and express it in numbers, you know something about it; but when you cannot measure it, when you cannot express it in numbers, your knowledge is of a meagre and unsatisfactory kind."
"If you cannot measure it, you cannot improve it."
-- Sir William Thomas Kelvin
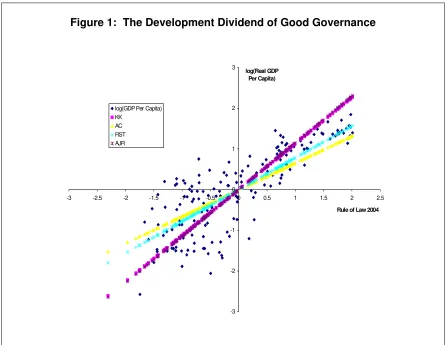
Today there is widespread consensus among policymakers and academics that good governance and strong institutions lie at the core of economic development. The intellectual foundations for this view are not new, and go back at least to the seminal work of Douglass North and earlier. What is new is that over the past 10 years there has been an explosion of careful empirical work that has documented a strong causal link running from better institutions to better development outcomes. Figure 1 summarizes the main results from several recent cross-country empirical studies. On the horizontal axis we graph a measure of institutional quality capturing the protection of property rights (the Rule of Law indicator described in more detail below). On the vertical axis we plot real GDP per capita, and we have normalized both variables to have a mean of zero and a standard deviation of one. The country-level data in the graph illustrates the strong correlation between governance and per capita incomes. This recent research has gone beyond the simple correlation shown in the graph to identifying a strong causal impact of governance on development. The upward-sloping lines capture several estimates of the causal impact of governance on per capita incomes that have been isolated using various techniques in recent studies.1 The striking observation that emerges from this graph is that the estimated causal impact of institutions on economic development is large: a realistic one-standard deviation improvement in governance would raise per capita incomes in the long run by a factor of two to three. Such improvement in
governance corresponds, for instance, to the improvement from the levels of Somalia to those of Laos, or from Laos to Lebanon, or from that of Lebanon to Italy, or from Italy to Canada.
1
A key factor enabling this line of recent research and informing policy discussions related to governance has been the availability of more and better cross-country and within-country data on governance and institutional quality. The above quotations by the 19th-century British physicist Lord Kelvin remind us of the importance of measurement and quantification, both for research on the causes and consequences of governance, as well as for policy advice to improve governance.2 One such measurement effort has been our work since the late 1990s to construct a dataset of aggregate cross-country governance indicators using subjective data on perceptions of governance from a large number of data sources. In Section 2 of this paper we report on the latest update of our governance indicators, which measure six dimensions of governance over the period 1996-2004 and spanning 209 countries and territories. The indicators are based on several hundred individual variables measuring perceptions of governance, drawn from 37 separate data sources constructed by 31 different organizations.
Reformers in many governments, aid donors, members of civil society, and investors increasingly recognize governance as key for development. This in turn has increased the demand for monitoring the quality of governance both across countries and within countries over time. For example, one of the eligibility criteria for the United States governments new aid program, the Millennium Challenge Account (MCA), is that a country must score above the median of all potentially-eligible countries on the Control of Corruption indicator described in this paper.3 One of the messages from our work is that it is important to take into account the inevitable uncertainty associated with estimates of governance. An attractive feature of our approach to measuring
governance is that it allows us to quantify the precision or reliability of our estimates of governance. Over time the addition of data has improved the precision of our
governance indicators relative to previous years. However, the margins of error associated with estimates of governance are not trivial, and need to be taken into account when comparing governance across countries.
2
One should be careful though of quoting Kelvin, he also famously noted that "X-rays will prove to be a hoax..." and "Radio has no future"!
3
The same margins of error also complicate the measurement of changes over time in governance, an issue of obvious concern to many policymakers. In this chapter we present new results on how to assess the statistical significance of changes over time in our measures of governance. We discuss these issues regarding the
interpretation of comparisons of governance across countries and over time in Section 3 of this chapter. We find that although many of the observed changes over time in our governance indicators are too small to signal statistically or economically meaningful changes in governance, there are countries where there have been substantial changes in governance, both improvements and declines. We also find that the likelihood of observing significant changes increases substantially with the length of the time period under consideration. Importantly, in examining some of our underlying data sources we also find that there is no evidence of changes in global averages of governance
worldwide. Although our aggregate indicators are scaled to have the same mean and standard deviation in each period and thus only track relative changes in governance over time, the absence of trends in global averages suggests that there is little difference between these relative and absolute changes in governance.
ideological biases in subjective governance assessments are relatively unimportant. These findings emphasize the importance of relying on a full range of measures of governance, and not exclusively subjective or objective measures, when assessing the quality of governance across countries.
We began by noting that there is widespread consensus among academics and policymakers that governance is important for economic development. But this view is not without its critics. One line of criticism argues that the strong positive correlation observed between subjective measures of governance and per capita incomes does not reflect a causal impact of governance on development, but rather is mostly due to “halo effects” – respondents rating countries might provide good governance scores to richer countries simply because they are richer. While this is certainly a possible source of bias, in Section 5 of this chapter we show that it is unlikely to lead to a significant upward bias in the correlation between income and governance. Another line of criticism is implicitly based on the view that the observed correlation between governance and per capita income largely reflects and important causal effect running from incomes to governance: as countries get richer institutional quality will improve. This view has lead some observers of the poor development performance of countries in sub-Saharan Africa to argue that the on average poor governance of countries in the region should be "discounted" because per capita incomes in the region are also low. However, we argue that existing evidence does not support a strong causal channel operating in this
direction – most of the correlation between governance and per capita incomes reflects causation from governance to per capita incomes. In light of this we suggest that it would be inappropriate to divert attention from the weak average governance
performance of the region simply because the region is poor. While we focus on Africa because of the recent emphasis in the aid community on the region, the fallacy of discounting the extent of misgovernance in a country or region due to low incomes applies more generally to any setting with poor governance and low incomes.
2. Updated Governance Indicators for 1996-2004
found in Kaufmann, Kraay, and Mastruzzi (2004), and in the working paper version of this chapter (Kaufmann, Kraay, and Mastruzzi (2005)). We construct measures of six dimensions governance:
1. Voice and Accountability – measuring political, civil and human rights
2. Political Instability and Violence – measuring the likelihood of violent threats to, or changes in, government, including terrorism
3. Government Effectiveness – measuring the competence of the bureaucracy and the quality of public service delivery
4. Regulatory Burden – measuring the incidence of market-unfriendly policies 5. Rule of Law – measuring the quality of contract enforcement, the police, and the
courts, as well as the likelihood of crime and violence
6. Control of Corruption – measuring the exercise of public power for private gain, including both petty and grand corruption and state capture
Our estimates of governance are based on a large number of individual data sources which provide us with information on perceptions of governance. These data sources consist of surveys of firms and individuals, as well as the assessments of commercial risk rating agencies, non-governmental organizations, and a number of multilateral aid agencies. For this round of the governance indicators, we rely on a total of 352 individual variables measuring different dimensions of governance. These are taken from 37 different sources, produced by 31 different organizations. A full list of the data sources, as well as a detailed description of how individual perceptions measures are assigned to our six dimensions of governance, can be found in Kaufmann, Kraay, and Mastruzzi (2005).
Our data sources reflect the views of a very diverse group of respondents. Several of our data sources are surveys of individuals or domestic firms with first-hand knowledge of the governance situation in the country. These include the World
Economic Forum’s Global Competitiveness Report, the Institute for Management Development’s World Competitiveness Yearbook, the World Bank’s business
Reconstruction and Development, the African Development Bank, the Asian
Development Bank, the UN Economic Commission for Africa, and the World Bank), reflecting these individuals’ in-depth experience working on the countries they assess. Other data sources from NGOs (such as Amnesty International, Reporters Without Borders, and Freedom House), as well as commercial risk rating agencies (such as EIU and DRI) base their assessments on a global network of correspondents typically living in the country they are rating.
We combine the many individual data sources into six aggregate governance indicators. The premise underlying this statistical approach should not be too
controversial – each of the individual data sources we have provides an imperfect signal of some deep underlying notion of governance that is difficult to observe directly. This means that as users of the individual sources, we face a signal-extraction problem – how do we isolate the informative signal about governance from each individual data source, and how do we optimally combine the many data sources to get the best possible signal of governance in a country based on all the available data? We approach this question using a statistical method known as an unobserved components model, which allows us to extract the common dimension of unobserved governance from the many individual data sources at our disposal. Details on this statistical approach can be found in Kaufmann, Kraay, and Mastruzzi (2005). The main advantage of this approach is that the aggregate indicators are more informative about unobserved governance than any individual data source. Moreover, the methodology allows us to be explicit about the precision – or imprecision – of our estimates of governance in each country. As we discuss in more detail throughout this chapter, this imprecision is not a consequence of our reliance on subjective or perceptions data on governance – rather imprecision is an issue that should be squarely addressed in all efforts to measure the quality of
governance.
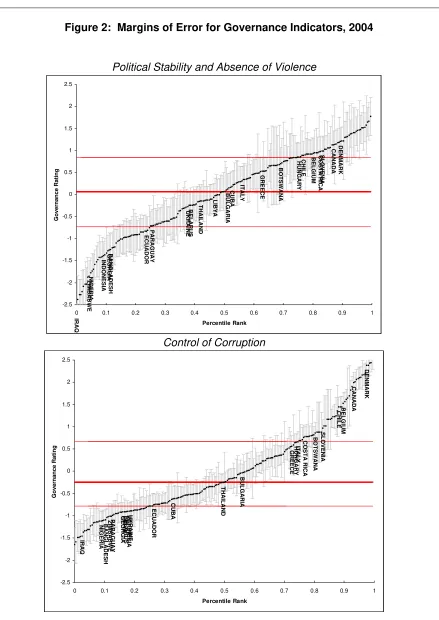
the estimate of governance. The vertical line for each country shows the statistically likely range for the value of governance for each country, as captured by a 90% confidence interval. The size of these confidence intervals varies across countries, as different countries appear in different numbers of sources with different levels of precision. An important feature of this graph is that the confidence intervals are
substantial relative to the units in which governance is measured. As a result, many of the small differences in estimates of governance across countries are not likely to be statistically significant at reasonable confidence levels. For many applications, instead of merely observing the point estimates, it is more useful to focus on the range of possible governance values for each country.
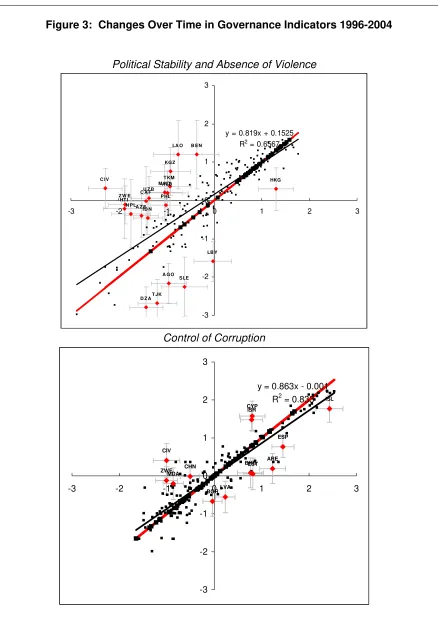
In Figure 3 we illustrate the changes over time in our estimates of governance in individual countries, for two selected governance indicators over the period 1996-2004. In both panels, we plot the 2004 score on the horizontal axis, and the 1996 score on the vertical axis. We also plot the 45-degree line, so that countries above this line
correspond to declines in the quality of governance, while countries below the line correspond to improvements in governance. The first feature of this graph is that most countries are clustered quite close to the 45-degree line, indicating that changes in our estimates of governance in these countries are relatively small over the eight-year period covered by the graph. A similar pattern emerges for the other four dimensions of
governance (not shown in Figure 3), and, not surprisingly the correlation between current and lagged estimates of governance is even higher when we consider shorter time periods.
Corruption measures, contrasting countries like Latvia and Bahrain which show substantial improvements in Control of Corruption, while Croatia, Nigeria, and Bosnia and Herzegovina improve in Voice and Accountability, for instance. 4
In the working paper version of this chapter (Kaufmann, Kraay, and Mastruzzi (2005) we have investigated in more detail the factors underlying the changes in our estimates of governance. We find that for large changes in governance in either direction, there is a reassuringly high degree of consensus among our underlying data sources for each country as to the direction of the change. For a typical large change in governance, over 80 percent of the data sources available for that country move in the same direction as the aggregate indicator. Moreover, although the number of sources on which we draw for our governance indicators has increased sharply over time, we show that this addition of new sources does not appear to have very substantial effects on the changes over time in the governance estimates. Taken together, this evidence suggests that for the large changes in governance shown in this table, we can have a good deal of confidence that it is mostly driven by changes in the underlying sources on which the aggregate indicators are based. In contrast, we should be much more
cautious in our interpretation of many of the smaller changes in our aggregate governance indicators.
It is important to note that our aggregate indicators are measured in relative units, since we have scaled them to have a mean of zero in each period. This opens the possibility that although many countries do not display large changes over time in their relative positions, it may be the case that there are broad-based improvements in global averages of governance that are not being picked up by our indicators. In order to determine how important this concern is, we have gone back to our underlying data sources and selected a subset of them for which we can track over time a similar specific concept of governance for a common set of countries.
4
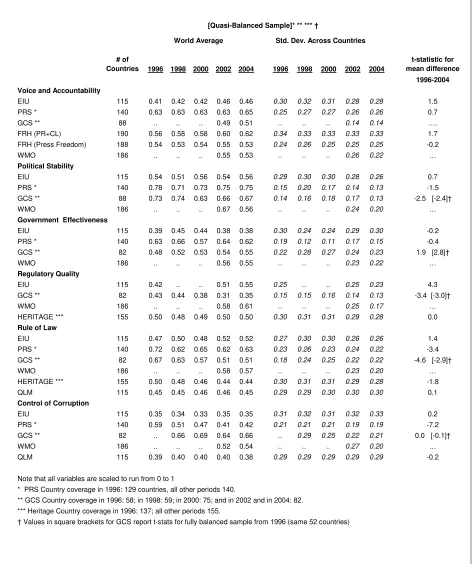
In Table 1 we summarize trends in world averages in a number of our individual data sources. Most of the sources in this table are polls of experts, with data extending over the whole period 1996-2004. Only one of them, GCS, is a survey with sufficiently standard format to enable comparisons over this period of time. The first five columns present the average across all countries of each of the sources in each of the years. The underlying data have been rescaled to run from zero to one, and for each source and governance component, we report the score on the same question or average of questions that we use in the aggregate indicator. The next five columns report the standard deviation across countries for each source. The final column reports the t-statistic associated with a test of the null hypothesis that the world average score is the same in 1996 as in 2004.
The picture that emerges from Table 1 is sobering. There is very little evidence of statistically significant improvements in governance worldwide. The 22 eight-year changes reported here are divided exactly in half into 11 improvements and 11 declines in global averages. Interesting there are nine cases of statistically significant changes at the 10 percent level or better (t-statistics greater than 1.64 in absolute value), and these are split between three improvements and six declines. It is not clear how much
importance ought to be ascribed to these trends in world averages. On the one hand, these statistics represent the only information we have on trends over time, and so they should be taken seriously. On the other hand, it is also clear that there is substantial disagreement among sources about even the direction of changes in global averages of governance. For now we cautiously conclude that we certainly do not have any
evidence of any significant improvement in governance worldwide and, if anything, the evidence is suggestive of a deterioration at the very least in key dimensions such as regulatory quality, rule of law, and control of corruption.
3. Interpreting Differences in Governance Across Countries and Over Time
one dimension of governance: corruption. We also show how the presence of margins of error affects the conclusions we can draw about the statistical, and practical,
importance of observed changes over time in governance.
3.1 Cross-Country Governance Comparisons and the MCA
As an illustration of the importance of margins of error in governance
comparisons, consider the eligibility criteria for the U.S. Millennium Challenge Account (MCA). Countries’ eligibility for grants from the MCA is determined by their relative positions on 16 different measures of country performance. One of these is our Control of Corruption indicator, where countries are required to score above the median among all potentially eligible countries in order to qualify for MCA funding. As we have noted elsewhere, this procedure risks misclassifying countries around the median because the margins of error for such countries often includes the median score. In contrast, for countries near the top and the bottom of potential MCA beneficiaries, we can be quite confident that they do in fact fall above and below the median, respectively.
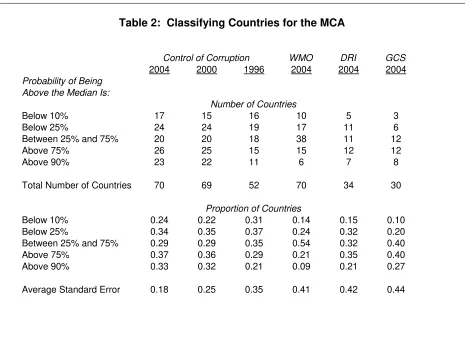
Table 2 illustrates the role of margins of error in this calculation. We focus attention on the set of 70 countries identified as potential MCA beneficiaries for the 2005 fiscal year.5 For these countries, we calculate the median score on our Control of Corruption indicator for 2004. Next, using our governance estimates and their accompanying standard errors, for each country we calculate the probability that the country’s level of corruption falls above the median for this group. The results of this calculation are summarized in the first column of Table 2. For 17 poorly-performing countries, or about one-quarter of the sample, there is less than a 10 percent chance that corruption in these countries actually falls above the median. For another 23 countries, or about a third of the sample, we are quite confident that corruption in these countries falls above the median, with a probability of at least 90 percent. In contrast, for the remaining 30 countries, the probability that they fall above the median is somewhere between 10 percent and 90 percent, and so we have less confidence that these
countries are correctly classified. If we relax our standards of significance to 25 percent
5
and 75 percent, we find that only about 20 countries out of 70, or 29 percent of countries fall in this zone of uncertainty.6
This example illustrates the importance of taking margins of error into account when making governance comparisons across countries. Our aggregate governance indicator is able to identify with a fairly substantial degree of confidence groups of countries where the probability that corruption is above or below the median is large. But at the same time there remains an intermediate group of countries where we can be less confident that they are correctly classified as being “good” or “bad” performers based on their point estimates of governance alone.
It is also important to note how this example illustrates the benefit of aggregating many sources of data on corruption, as we do. The remaining columns of Table 2 perform the same calculations, but relying on successively less precise measures of governance. The second and third columns use our own Control of Corruption
indicators for 2000 and 1996. These indicators cover fewer countries, and because they rely on a smaller set of sources available at the time, the margins of error for individual countries are higher than in 2004 (see the standard errors reported in the last row). In 1996, for example, 35 percent of the countries for which data is available fall in the intermediate category where the probability that they fall in the top half of the sample is between 25 percent and 75 percent – as opposed to only 29 percent of countries falling in this grey area with the 2004 indicator. The last three columns of the table show the same information for three of our individual sources, WMO, DRI, and GCS. These individual sources have substantially higher margins of error than our aggregate
indicators, and in the case of DRI and GCS also cover substantially fewer countries. In addition, we see that there is greater uncertainty about country rankings when relying on just a single indicator: for GCS, for example, the fraction of countries falling in the intermediate category rises to 40 percent. This illustrates the benefit of relying on aggregate indicators which are more informative than individual indicators when trying to classify countries according to their levels of governance.
6
3.2 Margins of Error and Changes over Time in Governance
It is useful to begin our discussion with the simplest possible example of how measurement error impacts our interpretation of changes over time in observed
governance indicators, both subjective and objective. Suppose that we have only one source of governance data observed at two points in time, and we want to make
inferences about how governance has changed in a country. To keep notation as simple as possible, we suppress country subscripts and write the observed data at time t, y(t), as the sum of true unobserved governance in that period, g(t), and an error term capturing measurement error:
(1) y(t) =g(t) + ε(t) , t=1,2
As a choice of units, we assume that true governance has mean zero and standard deviation one, and that the error term has zero mean. For simplicity we assume that the variance of the error term is the same in both periods and is equal to σ2. Note that σ2 is the noise-to-signal ratio in the observed governance data (the ratio of the variance of the error to the variance of unobserved governance). We also allow for the possibility that both governance and the error term are correlated over time, with correlations ρ and r, respectively. Finally we assume that both governance and the error term are normally distributed. With these simplifying assumptions, consider the problem of making inferences about the change in unobserved governance, g(t)-g(t-1), conditional on observing data y(t) and y(t-1) in the two periods. Using the fact that unobserved governance and the data are jointly normally distributed, we can use the properties of the multivariate normal distribution to arrive at the following expressions for the mean and variance of the change in governance, conditional on the observed data:7
(2)
[
]
(
) (
)
ρ − − ⋅ σ + − − ⋅ ρ − = − − − ) r 1 ( 1 ) 1 t ( y ) t ( y 1 ) 1 t ( y ), t ( y | ) 1 t ( g ) t ( g E 2[
]
(
) ( )
ρ − − ⋅ σ + σ ⋅ − ⋅ ρ − ⋅ = − − − ) r 1 ( 1 r 1 1 2 ) 1 t ( y ), t ( y | ) 1 t ( g ) t ( g V 2 2 7It is natural to use this conditional mean as our best estimate of the change in
governance, and the conditional variance as an indicator of the confidence we have in the estimate. This is in fact exactly analogous to how we obtain estimates of levels of governance and associated standard errors using the unobserved components model.
To interpret these expressions, consider first the case where there is no
persistence in governance or in the error terms, i.e. ρ=r=0. In this case, our estimate of
the change in governance is simply
2 1
) 1 t ( y ) t ( y
σ +
− −
. In particular, we should take the
observed change in the single source and scale it down by a factor of 2 1
1 σ
+ to reflect the fact that the data measures governance with error. It is also clear from Equation (2) that the higher is ρ, the more we should discount observed changes in governance. Intuitively, if we knew that governance changes very slowly over time, then any observed change in the data is more likely to reflect changes in the error term, and so we should discount this observed change more heavily. In the limit where governance is perfectly correlated in the two periods, we would know for sure that any change observed in the data must reflect only fluctuations in the error term, and so we would completely discount the observed change in the data. That is, our estimate of the change in governance would be zero regardless of the observed change in the data.
The effect of persistence in the error terms works in the opposite direction: we should scale down the observed change in the data by less the larger is the correlation over time in the error terms. Again the intuition for this is simple – if we know that the error with which a given source measures governance is persistent over time, then any observed change in the source is likely to understate the true change in unobserved governance. As a result our best estimate of the change in governance will be larger than the observed change in the data. Interestingly, if the correlation in unobserved governance and the error term are equal to each other, i.e. ρ=r, then these two effects
offset exactly and the discount applied to the observed change in governance is 2 1
How much confidence should we have in the statistical significance of the change in unobserved governance based on the observed data? Suppose that we observe a change in the indicator equal to k standard deviations of the changes in this variable, i.e. y(t)−y(t−1)=k⋅ 2⋅
(
1+σ2⋅(1−r)−ρ)
. Does this signal a significant change in governance? In order to test the null hypothesis that the change in governance is zero, we can construct the usual z-statistic associated with this hypothesis, i.e. the ratio of the mean of the change in governance conditional on the data to the square root of the conditional variance, which simplifies to:(3)
[
[
]
]
r 1 1 k ) 1 t ( y ), t ( y | ) 1 t ( g ) t ( g V ) 1 t ( y ), t ( y | ) 1 t ( g ) t ( g E z − ρ − ⋅ σ = − − − − − − =
Not surprisingly, the observed change in the data is more likely to signal a significant change in unobserved governance the larger is the observed change in the data (i.e. the larger is k), and the lower is the signal-to-noise ratio in the data (i.e. the smaller is σ). And building on the intuitions above, the observed change in the data is also more likely to signal a significant change in unobserved governance the lower is the persistence in unobserved governance, ρ, and the higher is the persistence in the error term, r.
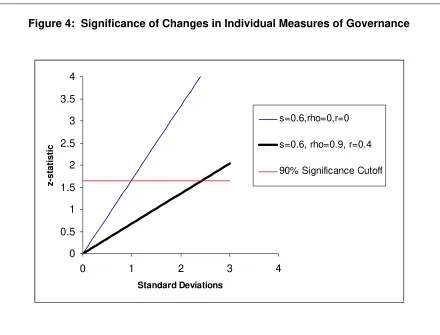
Figure 4 puts some numbers to this simple calculation. We graph the number of standard deviations of the observed change in the data, k, on the horizontal axis, and we plot the z-statistic in Equation (3) on the vertical axis for different values of the key parameters. We set σ2=0.36, as this is the median value for the noise-to-signal ratio across all of the individual data sources we use to construct our six governance
indicators in each of the five periods. In an earlier paper we have argued that the noise-to-signal ratio in objective measures of governance is likely to be at least as large as this.8 The thin upward-sloping line traces out the z-statistic as a function of k for this value of the noise-to-signal ratio, but assuming that the correlation in governance and the error term are zero, i.e. ρ=r=0. The z-statistic is greater than the 90-percent critical value for changes in the observed data that are more than one standard deviation away from the mean change. This suggests that if there is no persistence in governance or in the error terms, quite a large proportion of observed changes in individual governance
8
indicators would in fact signal a significant change in unobserved governance. In fact, if changes in the observed governance indicator are approximately normally distributed, the largest one-third of all absolute changes would signal changes in governance that are significant at the 90% level.
The bold upward-sloping line corresponds to the more empirically relevant case where there is persistence in both governance and the error terms. The line is drawn for the same noise-to-signal ratio as before, and in addition we assume that the correlation of unobserved governance over time is ρ=0.9 and the correlation in the error term is r=0.4. In the next subsection we show how these parameters can be estimated using our governance data, and find that these values are typical ones. In particular, we shall see shortly that unobserved governance tends to be highly persistent over the eight-year period spanned by our dataset, and although the error terms are also typically positively correlated over time they are much less so than governance. Based on the intuitions developed above, this suggests that much larger observed changes in governance indicators would be required to signal statistically significant changes in unobserved governance. This is exactly what we find. The bold line crosses the 90% critical value at k=2.5, indicating that only those observed changes in the data more than 2.5 standard deviations away from the mean would signal a statistically significant change in
governance. Again, if changes in the observed governance indicators are normally distributed, this would imply that only the top one percent of all absolute changes would correspond to significant changes in governance. This in turn suggests that drawing conclusions about changes in governance based on changes in individual governance indicators should be done with an abundance of caution.
In the appendix to this chapter we extend the discussion above to the case of aggregate governance indicators. The basic insights from this discussion of changes in individual indicators also carry over to changes in aggregate governance indicators. Just as we found that aggregate indicators are more informative about levels of
governance. And the greater is the latter, the more likely it is that observed changes in indicators of governance signal significant changes in true governance. As shown in the appendix, we find that that the simple rule of thumb we proposed in Section 2 of the paper -- that changes in governance are significant if the 90 percent (or 75 percent) confidence intervals in the two periods do not overlap -- does a fairly good job of identifying changes that are statistically significant using more formal criteria.
4. Subjective and Objective Measures of Governance
In this section of the paper we address a number of issues that arise in using subjective or perceptions-based data to measure governance across countries. We begin by discussing why subjective data is often either the only type of data available to measure governance, or else adds valuable insights over available objective measures. We next emphasize that margins of error are not unique to the subjective measures of governance that we construct, but are pervasive in all efforts to measure governance. We present some simple calculations which show that margins of error in objective measures of governance are comparable to those we present for our subjective
measures. We then turn to a deeper investigation of one source of discrepancy between subjective and objective indicators, which is that the latter tend to emphasize de jure rules on the books while the former tend to pick up the de facto reality on the ground. We finally briefly describe an earlier effort of ours to quantify the importance of
ideological biases in subjective measures of governance and found that they were small.
4.1 Perceptions Matter
In this subsection we discuss some of the advantages of the subjective or perceptions-based measures of governance we use to construct our aggregate governance indicators. The primary reason for this choice is that for many of the key dimensions of governance, such as corruption or the confidence that property rights are protected, relevant objective data are almost by definition impossible to obtain, and so there are few alternatives to the subjective data on which we rely.
possible, but none are without difficulty. For example, relying on the frequency of references to corruption in the media will reflect not only the prevalence of corruption, but also the extent to which the press are free and objective in their coverage of events. Similarly, relying on prosecutions or conviction rates in corruption trials will to no small extent reflect the competence and independence of the police and judicial system, and thus will not exclusively reflect the prevalence of corruption itself. Finally, in recent years a handful of papers have attempted to measure corruption by looking for patterns in objective data that can only be consistent with corruption. For example, DiTella and Shargrodsky (2003) document variation in the procurement prices paid for very homogenous medical inputs such as syringes across hospitals in Buenos Aires as an indicator of corruption in procurement. Along similar lines, Golden and Picci (2003) carefully document variation in the differences between existing stocks of public infrastructure and past flows of infrastructure spending across Italian regions, interpreting this gap as a measure of procurement corruption. While these last two papers represent important and interesting developments in measurement, cross-country measures of corruption based on this idea are not available – nor are they likely to be, given the major data requirements for this kind of exercise.
For some other dimensions of governance, objective measures may be available, but nevertheless suffer from two related weaknesses. For Voice and Accountability, for example, it is possible to use objective data on the presence of elections to measure democratic participation. However, as is well known there is a great deal of variation across countries in the extent to which the outcome of elections actually reflect the will of the voters. Measuring the extent to which elections are subverted, either through
intimidation, manipulation, or sheer fabrication of results, brings us quickly back to the realm of more subjective or perceptions-based data. This is just one example of the important distinction between de jure and de facto situations regarding governance across countries. Countries may have extensive formal protections of property rights codified in their legal system that are honored only in the breach. For example, most countries in the world now have formal independent anti-corruption commissions, but their effectiveness varies greatly.
on the political decision-making process exerted by powerful firms, influencing laws, policies and regulations, Hellman and Kaufmann (2003) develop a measure for 'crony bias' or unequal influence across firms. The authors find a consistent pattern in which perceived unequal influence has strongly negative impact on the firm's assessment of public institutions, which in turn affects the behavior of the firm towards those
institutions. Crony bias at both the firm and the country level is associated with lesser use of the courts by the firms to resolve business disputes, with lower enforceability of court decisions, lower levels of tax compliance, and higher levels of bribery. Thus, the evidence suggests that the inequality of influence not only damages the credibility of institutions among less (politically) powerful firms, but affects the likelihood that they will use and provide tax resources to support such institutions, thereby perpetuating the weakness of such institutions and likelihood of capture by the influential.
Finally, in recent years the economics and comparative political economy literature has generated a profusion of results linking a variety of objective measures of the structure of institutions to a range of governance outcomes. A non-exhaustive list of examples includes the links between decentralization and corruption; the effects of the structure of the legal system on financial market development; the effect of checks and balances in the political system on regulatory and fiscal performance; the effects of democratic institutions on a wide range of socioeconomic outcomes; and many others. While this literature has served to greatly expand our understanding of the deep
institutional determinants of development, the objective measures of institutional quality and/or their historical determinants on which they rely do not lend themselves well to the construction of aggregate governance indicators like ours. The basic reason is that these indicators typically do not have normative content on their own, but only do so in the context of a particular empirical analysis linking these variables with a particular outcome. For example, while measures of decentralization may be correlated with the incidence of corruption across countries, generally the explanatory power of this variable is not sufficiently strong that decentralization could be considered to be a reasonable proxy for corruption.
problem with many perceptions-based questions about governance is that they can be vague and open to interpretation. For example, a well crafted question to enterprises on corruption asks them for the estimated share of bribes in revenues expended annually by firms like theirs, and similarly another focused ‘experiential’ question probes into the percentage of the firm’s management time spent dealing with government officials on red tape. By contrast, generalized opinion questions such as a citizen’s perception of the overall tolerance of the population to corruption are less informative for our
purposes. Nowadays we can increasingly rely on more specific, better crafted, and to an extent experiential questions, thanks to improvements that have taken place over time. For instance, in contrast with the mid-nineties, the GCS survey of firms contains much more specific questions to the firm about corruption and governance, and some are of a quantitative and experiential nature (such as percentage of senior management time spent with public officials); similarly BPS includes many detailed questions unbundling governance to very specific components, and quantifying phenomena such as the percentage of bribes paid yearly as a share of revenues.
4.2 Margins of Error Are Not Unique to Subjective Data
We have argued that one of the strengths of the governance indicators reported in this paper is that we are able to construct explicit margins of error associated with our estimates of governance for each country. However it is worth emphasizing that these margins of error are not unique to subjective or perceptions-based measures of
governance, but are also present -- if not explicitly noted -- in most other measures of institutional quality, or any other socioeconomic indicator for that matter. One need only consider the range of “preliminary” estimates of basic objective variables such as real GDP growth produced in industrial countries with high-quality statistical systems to realize that measurement error in objective data is in fact pervasive and should be taken seriously.9
Consider for example the recent interest in constructing objective measures of governance that do not exclusively rely on perceptions-based data sources as we do, but rather on objective and quantifiable data. Several of these are described in Knack
9
and Kugler (2002). They argue that variables such as the waiting time required to obtain a telephone line, and the number of telephone faults can serve as proxies for public administrative capacity. The reliance of the government on trade taxes can serve as a proxy for the (in)ability of the government to broaden its tax base. The volatility in
budgetary expenditure shares, and similarly, the volatility of revenue shares, is indicative of a volatile and unpredictable policy environment. They also draw on a number of other measures of institutional quality pre-existing in the literature. Clague, Keefer, Knack and Olson (1996) argue that the fraction of currency in circulation that is held in the banking system is a good proxy of the extent to which individuals in a country can be confident that their property rights are protected. Finally, in a series of papers, Djankov et al (2002, 2003) compile cross-country data on the number of administrative procedures required to start a business, and the number of legal procedures required to collect an unpaid debt. These measures capture the complexity of the regulatory and legal environment.
While most of these measures can in principle provide an accurate measure of the specific underlying concept to which they refer, their usefulness as a measure of broader notions of governance depends on the extent to which the specific concept they are measuring corresponds to these broader ideas of governance. For example, the number of procedures required to start a business may not be a good indicator of the complexity or burden of regulation in other areas. Similarly, the willingness of individuals to hold currency in banks reflect their confidence in a very particular set of property rights (vis-à-vis banks, and banks vis-à-vis the government), but may not necessarily capture other dimensions of property rights protection, such as confidence in the police and judicial system to uphold private property rights.
This is of course not surprising, nor should it be considered a drawback of such measures -- all of which necessarily are imperfect proxies for broader notions of
this paper.10 While these margins of error are generally not made explicit for objective indicators, a simple calculation can give a sense of their order of magnitude. Suppose that we have two noisy indicators y on a common unobserved concept of governance, g, i.e.: yi =g+εi, i=1,2. Then if we normalize the variance of the unobserved measure of governance to be one, the correlation between the two observed indicators will be
(
) (
)
(
2)
1/22 2
1 1 1+σ ⋅ +σ − =
ρ . Suppose that indicator 1 is one of our subjective governance
indicators, for which the variance of the measurement error, σ12, is known, and that indicator 2 is one of the objective indicators described above. Then from the observed correlation between the two indicators, we can infer the variance of measurement error in the objective indicator, σ22.
The results of this calculation can be found in Table 3. The rows of Table 3 correspond to the various objective governance indicators discussed above. In the first two columns, we identify the objective indicator, and the subjective aggregate
governance indicator which best corresponds to it. In the third column we report the correlation between the subjective and the objective indicator, using our 2002
governance indicators. The next three columns report the implied standard deviation of measurement error in the objective indicator, under three assumptions: (A) that our estimate of the standard deviation of measurement error in the subjective indicator is correct, (B) that the subjective and objective indicators have the same standard deviation of measurement error, and (C) that the standard deviation of measurement error in the subjective indicator is twice as large as that in the objective indicator. Finally in the last column we report the actual standard deviation of measurement error,
computed as the average across all countries of the country-specific standard errors in our governance indicators.
The results in Table 3 are quite striking. For all indicators, and for all three sets of assumptions, the implied standard deviation of measurement error in the objective indicators is very high relative to the corresponding standard deviation of the subjective governance indicators. Under the benchmark assumption (A) which takes seriously the
10
margins of error we have computed for our governance indicators, we find that the implied margin of error for the objective indicators is between seven and 15 times larger than that of the subjective indicators. This clearly exaggerates the difference in the precision of subjective and objective indicators because we are comparing a single objective indicator with an aggregate of several subjective measures, and as discussed we should expect aggregation to improve precision. But this is only part of the story. For the GE and RQ indicators, we have a median of six sources per country, while for RL we have a median of eight sources. This can explain why the standard deviation of measurement error of the objective sources might be 6 =2.4 to 8 =2.8 times higher than that of the corresponding subjective indicators, but still cannot explain all of the difference in the precision of the indicators that we see. Similarly, the last row in Table 3 reports the correlation of GE with an aggregate of all the objective indicators. In this case, the benefits of aggregation would be roughly comparable for the two indicators, with a median of 5 sources per country for the objective indicator and a median of 6 sources per country for GE. Nevertheless, we find that the implied standard deviation of measurement error is still four times as large for the objective indicator as it is for the subjective one.
Assumptions (B) and (C) are designed to be more favorable to the precision of the objective indicators. Assumption (B) discards the information in the margins of error that we have constructed for the subjective indicator, and simply makes the neutral assumption that the subjective and the objective indicators have the same standard deviation of measurement error. This reduces the implied standard deviation of
measurement error for the objective indicator relative to the benchmark assumption (A), but it remains large at 0.6 for the composite objective indicator, and higher for the
individual indicators. Assumption (C) weights things even further in favor of the objective indicators, assuming that the objective indicator is twice as precise as the subjective indicator. In this case, we continue to find very substantial estimates of the standard deviation of measurement error, on the order of 0.4 and higher for individual objective indicators.
comparisons based on any such measures. In addition, wherever possible, it is desirable to construct explicit margins of error to aid in these comparisons.
4.3 De Jure and De Facto Governance Indicators
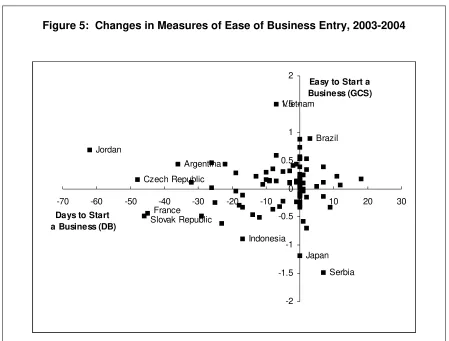
A recurrent theme in this paper is that individual sources of governance data are imperfect and provide only noisy signals of unobserved governance. In the previous subsection we have seen that part of this measurement error is due to the fact that all specific subjective and objective measures of governance are imperfect proxies for the broader concepts of governance that they are used to measure. In this section we turn to a different source of measurement error, arising from the distinction between de jure and de facto measures of governance. Consider for example the very useful “Doing Business” project of the World Bank, which has compiled objective measures of various dimensions of the regulatory environment across countries, by interviewing law firms around the world about formal rules and regulations in their countries. As with the subjective measures of ease of business entry, there are gaps between this specific dimension of regulation and the overall quality of the regulatory environment. Interestingly, we show next that there are systematic differences between even very specific subjective and objective measures, which reflect the sometimes-wide gap between the de jure rules on the books, and their de facto application.
We consider two measures of the de facto environment facing firms, taken from the survey of over 8000 firms in 104 countries carried out by the World Economic Forum in 2004 as an input to their Global Competitive Report. These two variables capture firms’ assessment of the ease of starting a business, as well as their reported tax burden. 11 We match these with two closely-related de jure measures from other
sources. For ease of starting a business, we draw on the Doing Business project at the World Bank discussed above. From this dataset we take the number of days required to start a business. For perceptions of the tax burden, we have independently collected statutory tax rates for the sampled countries, and within it, for the types of firms by
11
For the past number of years, collaboration between WBI and the WEF has resulted in an in-depth coverage of governance in the survey, and in the WBI contribution of a governance chapter for each GCR. For details on the data we use for the text described above, and the related coverage of these governance issues at the micro-level, see the Governance chapter in the GCR
sector, and mapped these rates into the firm level data. We then aggregate these up to the country level to obtain average measures of the statutory tax burden.12
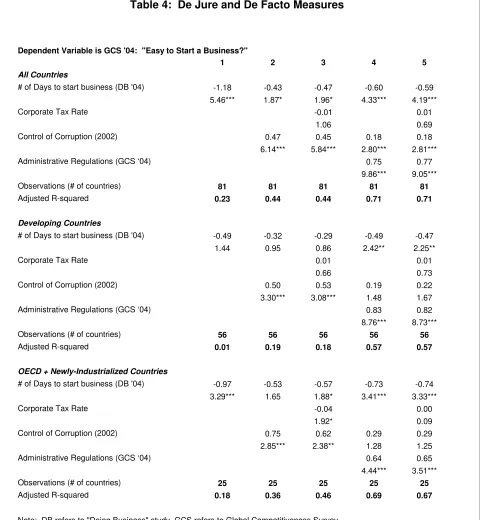
We begin with simple ordinary least squares regressions of perceptions of ease of starting a business on the corresponding objective measure (first column of Table 4). Not surprisingly, the objective measure enters negatively and is highly statistically
significant with a t-statistic of more than five, indicating that firms perceive it more difficult to start a business in countries where the number of days required to do so is large. More interesting for our purposes is the observation that the R-squared of the regression is very modest, at only 0.23.
We cannot say at this point whether this reflects measurement error in the subjective or the objective measure, as either one would contribute to a low R-squared. One hypothesis however is that the objective measure fails to capture the extent to which the formal requirements to start a business are altered by the presence of
corruption or other forms of informality in their application. To investigate this possibility we add our aggregate measure of Control of Corruption to the regression.13 We find that this variable enters positively and highly significantly, indicating that perceptions of the ease of starting a business are significantly better in countries with less corruption, even after controlling for the de jure rules governing business entry. Once we add corruption, the coefficient on the de jure rules falls by half, and its significance also drops to the 10 percent level. Moreover the adjusted R-squared of the regression doubles to 0.44, indicating substantial explanatory power for this additional variable.
There is however an obvious difficulty with this result. It could well be the case that firms’ responses to the question regarding business entry are non-specific, in the sense that they will provide low responses if their assessment of the overall business environment is negative. This generalized dissatisfaction could account for the significance of the corruption variable, rather than the extent to which business entry
12
The main source for the effective tax rates was the PricewaterhouseCoopers report “Corporate taxes: worldwide summaries (2003-2004)”, covering 85 of our sample of 104 countries. As some countries have differential tax rates, to map the country-level data from the report to the individual firm-level data from the GCS we used, in addition to country criterion, individual characteristics
such as size, sector, and whether the firm exports or not.For those countries for which the report
has no information we used the country average calculated by KPMG in their “Corporate tax rate survey”.
13
procedures are tainted by corruption. We address this possibility in the next three columns. One test for this problem of non-specificity is to ask whether unrelated
objective measures of the business environment also predict perceptions about ease of entry. We do this in the third column by adding the objective tax burden question to the regression. If firm responses reflect generalized dissatisfaction, we might expect this variable also to enter significantly, yet it does not. In the fourth column we instead add firms’ responses to a question about the overall regulatory environment that they face. Again we find that corruption remains highly significant, and in this case the general question about regulation is also highly significant. This suggests that while non-specificity of responses may be a concern, it does not fully account for the significance of the corruption measure in the previous specifications. Interestingly, in both
specifications, we find that the coefficient on the objective entry measure becomes larger and more significant as we add these control variables. Finally we note that all these results go through when we put all four variables in the regression.
The second and third panels of Table 4 reveal interesting differences between developing countries on the one hand, and OECD and newly-industrialized countries, on the other. In the developing country sample, the results described above go through for the most part. However, it is interesting to note that the magnitude and significance of the objective measure is in general smaller in the developing country sample, and larger in the industrial country sample, while the converse is true for the corruption variable. Taken together these results suggest that firm perceptions of the ease of starting a business depend on both de jure rules, as well as the institutional environment in which those rules are applied. Moreover, the relative importance of de jure rules seems to be higher in industrial than in developing countries. More broadly, the lesson from this simple exercise is that it can be misleading to rely exclusively on either perceptions of de facto governance or objective measures of the de jure rules.
country sample where we might expect corruption to matter more for perceptions of the tax burden. As before, we address the possibility that the tax burden question captures generalized dissatisfaction rather than a specific concern with taxation by including the objective measure of days to start a business, and we find that the corruption variable remains significant. Also consistent with our priors, we find that differences in statutory tax rates have much stronger explanatory power for perceptions of tax burden in the industrial country sample. While the overall results are not quite as strong as for the business entry example discussed above, qualitatively the picture that emerges is quite similar.
In sum, the results suggest that assessments of governance should not be based solely on objective measures of the de jure situation. We have seen that firms’
perceptions of the ease of starting a business, and the weight of their tax burden,
depend not only on the de jure regulations that they face, but also on the environment in which these regulations are applied. Many laws and regulations are often adopted, yet implementation is subverted due to the many informal mechanisms that often prevail. In these settings frequently the essence of how policies and regulations are actually
implemented may be missed by objective indicators. This is not to say, of course, that firm-based surveys of perceptions are devoid of margins of error and related challenges. Rather, the results we have shown emphasize the importance of relying on a range of measures to assess governance, and on recognizing that no single measure is a perfect proxy for governance.
4.4 Potential Ideological Biases
We did this as follows. Our identifying assumption was that surveys of firms or individuals are not tainted by ideology, since they reflect the views of a large number of respondents in each country. In contrast, it is possible that the views of a smaller number of raters affiliated with a particular institution may reflect the ideology of that group. We can therefore identify the effects of ideology by looking at the correlation across countries between the ideology of the government in power, and the difference in the percentile ranks assigned to countries by a poll of experts and a survey of individuals and firms. We implemented this idea using the World Bank’s Business Environment Survey (WBS) for 2000, and an independently available indicator variable that takes on the value 1 if the government in power is left-of-center, 2 if it is center, and 3 if it is right-of-center, taken from the database of political institutions constructed by Beck et. al. (2001). The coefficient on the ideology variable was intended to capture the extent to which a given poll of experts rates countries with left- or right-wing governments systematically differently from a survey.
The results of the regressions confirm that most sources are not affected by ideological bias. Only one source, Heritage Foundation, was found to assign relatively higher scores to countries with right-of-center governments than the corresponding surveys. However, it is worth emphasizing that this “ideology bias” is fairly modest in magnitude. The coefficient estimates indeed indicate that a country with a right-of-center government would get between 7 and 10 percentile points higher than a right-of-center government. Moreover, in all cases, the ideology variable in a statistical sense explains only a trivial fraction of the difference in assessments between polls and surveys, suggesting that the importance of ideological biases in polls is quite small overall14.
5. Interpreting Governance-Income Correlations
We began this chapter by noting the strong consensus that governance matters for economic development. In important part of the evidence in support of this view comes from providing a causal interpretation of the strong observed positive correlation
14
between governance and per capita incomes across countries. But there are alternative interpretations of this correlation. We first consider – and discount – the interpretation that these strong correlations are a consequence of “halo effects”, i.e. an upward bias in perceptions of governance in rich countries simply because they are rich. We also discuss – and refute – the argument that the weak governance performance of countries in Africa should be discounted in some sense because these countries are poor.
5.1 Halo Effects
Perceptions-based measures of governance such as the ones we develop here are potentially subject to a number of biases. One common critique is that perceptions of governance are biased upwards in rich countries because respondents view the development success of the country in question as evidence that institutional quality is good. This type of bias is sometimes referred to as a “halo effect”.15 This in turn implies that part of the observed high correlation between per capita incomes and governance spuriously reflects this bias.
To formalize the idea of halo effects, suppose that we can write our observed estimates of governance, g*, as the sum of true governance, g, and an error term, u:
(4)
g
*
=
g
+
u
The essence of the halo effect argument is that this error term u is correlated with per capita incomes, y. The relevant question then is the extent to which this spurious
correlation can account for the high observed correlation between measured governance and per capita incomes. Intuitively, it should be clear that in order for halo effects to substantially account for the correlation between incomes and measured governance, it must be the case that the correlation between the error and income is large. Perhaps less obviously, it must also be the case that the variance of the error term is large relative to the variation in governance. Otherwise, even if the error term is strongly
15
correlated with income, the fact that it accounts for little of the variance in measured governance means that it will have little impact on the correlation between measured governance and per capita income. Our argument in a nutshell is that for reasonable assumptions on the importance of measurement error, this measurement error would have to be implausibly highly correlated with per capita incomes in order to constitute a significant source of bias.
To formalize this intuition, we decompose the observed correlation between measured governance and per capita income into a term reflecting the true correlation between governance and income, and a term attributable to the halo effect:
(5)
CORR
(
g
*,
y
)
=
1
−
s
⋅
CORR
(
g
,
y
)
+
s
⋅
CORR
(
u
,
y
)
where
s
=
V
[
u
]
/
V
[
g
*]
is a measure of how noisy the governance indicator is. Note also that the correlation between measured governance and per capita income that we see in the data is around 0.8.To understand this expression, suppose that the true correlation between governance and income were zero, so that all of the observed correlation between income and governance is due to the second term capturing halo effects. This consists of two ingredients: the actual correlation of the error term with per capita income, which is multiplied by the square root of the share of the variance in governance due to the error term. Suppose that the governance indicator is very noisy so that the share of the variance approaches one. Then the correlation of the error term with per capita income must be equal to the observed correlation in the data. Suppose however that the governance indicator is at least somewhat informative, so that s is less than one. Then in order to match the observed correlation in the data, the halo effect correlation in the error term must be even larger than the 0.8 observed in the data. This example
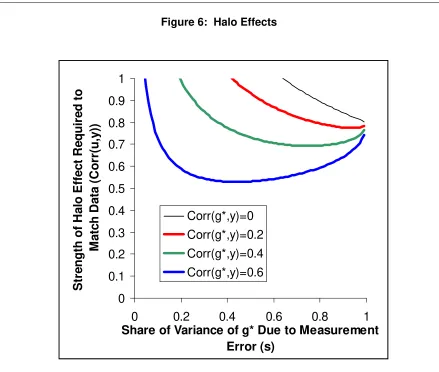
This example is extreme because we have assumed that the true correlation between governance and income is zero. We now relax this assumption and revisit the question of how strong halo effects need to be to account for the observed correlation between measured governance and per capita income of 0.8. We do this with the help of Figure 6, which graphs the strength of the halo effect, i.e. CORR[u,y], on the vertical axis, against the share of the variance in governance due to the residual, i.e. s, on the horizontal axis. The different lines on the graph correspond to different assumptions for the true correlation between governance and income. We have already discussed the intuition for the case where this correlation is zero, shown as the highest line in the graph. When the share of the variance in governance due to measurement error is one, the halo effect correlation must be equal to 0.8. As we move to the left and the
governance indicator becomes more informative, the required correlation increases.
The lines corresponding to successively higher true correlations between
governance and income fall everywhere below the first series. This is because once we allow for some correlation between true governance and income, the halo effect needed to account for the correlation between observed governance and income is weaker. Interestingly, however, even if the true correlation is quite substantial at 0.6, the lowest line in Figure 6 tells us that halo effects must still be quite considerable, with a
correlation of at least 0.5, to match the observed data.16 This lower bound occurs for intermediate values of the share of the variance of governance due to measurement error. It is also interesting to ask what a reasonable value for this share might be, in order to pin down more precisely how strong halo effects must be. One way to do so is to consider the standard errors of the governance estimates, which average around 0.25 as compared with the standard deviation of measured governance of 1. This suggests that the share of the variance of governance due to the error term is in fact quite small at s=0.252=0.06. For this low variance share, the halo effect correlation would need to be 0.9 in order to match the observed data. If the true correlation between governance and income were much lower, for example at 0.4, then even if measurement error in
16
We do not consider higher values for the true correlation than 0.6. This is because we are trying to see the extent to which halo effects might result in an observed correlation of 0.8 which is substantially higher than the true correlation. If the observed correlation and the true
governance were perfectly correlated with per capita income it would not be possible to generate the observed correlation between governance and per capita incomes.
This strong conclusion is driven by the assumption that that measurement error accounts for a relatively small portion of the variation in observed governance. As a result this measurement error needs to be very highly correlated with incomes in order to match the data. One could argue that we are understating the importance of
measurement error by relying on the estimated standard errors from our governance indicators. After all, these are based on the assumption that measurement error is uncorrelated across different sources of governance data. However, if halo effects are important, the measurement error in individual sources will be correlated not only with per capita income, but also with each other. This in turn would imply a greater
imprecision of the governance estimates. To capture this possibility, suppose that the standard error of the governance estimates were twice as large as what we actually have, at 0.5.17 This implies s=0.25, and for this value of s we can see from Figure 6 that the halo effect correlation would still need to be very high at almost 0.6 in order to match the data.
In summary, these results suggest to us that although halo effects may well be present in perceptions-based measures of governance, these halo effects need to be implausibly strong in order to impart a substantial upward bias in the correlation between measured governance and per capita incomes. Moreover, it is worth noting that there may well be other factors offsetting such halo effects. One is the tendency of survey respondents in developed countries to be particularly critical of their own institutions.18 It is also worth noting that some cross-country polls of experts deliberately apply higher standards to rich countries when assessing their governance.19 Overall, then, we do not
17
In Kaufmann, Kraay and Zoido-Lobaton (1999), Table 5, we show that the estimated margins of error would be roughly twice as large if we assume that the correlation of error terms across sources is 0.5 instead of 0.
18
For treatments of these effects in survey data, see Kaufmann and Wei (1999) and Hellman, Kaufmann and Schankerman (2000)
19