Fuzzy Logic over Ontological Annotation and
Classification for Spatial Feature Extraction
Sarwar kamal
Sonia Farhana Nimmy
Linkon Chowdhury
Lecturer, Dept. of CSE Lecturer, Dept. of CSE Lecturer, Dept. of CSE BGC Trust University BGC Trust University BGC Trust University Chittagong, Bangladesh Chittagong, Bangladesh Chittagong, Bangladesh.
ABSTRACT
With the advent of new web technology, Image Annotation and Classification has paved the way for invoking an efficient and effective research area as it is of immense importance in searching images from different categories of relevant images using keywords. This may be an impressive tool in describing image content as object or textual information to classify images. To serve this purpose, many techniques have been lunched for automatic image annotation and classification based on content and exit metadata. Automatic image annotation however, is highly difficult and challengeable. So users have to follow the annotation manually. In this paper, we applied fuzzy logic implication and fuzzy set operation for Historical image classification. We have compared the outcome of how fuzzy classification is better ontological image classification. Fuzzy logic plays an important rule so that the margin of the classification becomes more accurate. Here we imposed fuzzy matrix optimization for Spatial Image classification of Historical image data. Fuzzy matrix determines the optimal values of spatial data which are near about correct with less uncertainty. Fuzzy membership function also works to estimate the values before using in fuzzy matrix. We also pro- posed a manual method for image annotation based on IPTC metadata with a view to retrieving images with its corresponding information for automatic semantic ontological and fuzzy classification using linked data. We strived to experiment on about 400 images of different historical heritages.
Keywords
:
Annotation, Metadata, Fuzzy logic, Fuzzy Matrix, Historical Heritage, Uncertainty, Linked data, Ontological Fuzzy membership function..
1. INTRODUCTION
Annotation means a comment or description attached to a particular section of a document. Many computer applications enable us to enter annotations on text documents, spreadsheets, presentations, and other objects. Image annotation (also known as image tagging) is the process by which a computer system automatically assigns metadata in the form of captioning or keywords to a digital image. This application of computer vision techniques is used in image retrieval systems for semantic annotation and fuzzy classification. With the rapid development of digital photograph the use of digital images of various formats is tremendously increasing day by day‟s it is urgently needed for efficient storage and retrieval of these images. Now days, keeping the digital images of historical heritage have become an important and enjoyable task.
Because historical heritage forms the local and national identity of a country such as historical monuments, moments, places, museum, culture, nature and so on. India an exotic destination which offers archaeological remains including historical moments, folk- lore, and religious and cultural heritage. It is a country considerably rich in archaeological wealth, especially of the medieval period both during the Muslim and pre- Muslim rules. During its more than two thousand years of eventful history, many illustrious Kings and Sultans have ruled and disappeared and have left their marks in the shape of magnificent cities as well as monuments throughout the country [1]. These historical places, archaeological sites, monuments, and similar other objects are available throughout the country to symbol and present out tradition and civilization To know and high light the history and other information about these images of historical heritage to the whole world, we need to annotate these images. Classification is the act of distributing things into classes or categories of the same type. In certain terminology, particularly that of machine learning, the classification problem is known as supervised learning [2], while clustering is known as unsupervised learning.
1.1 Ontology and Knowledge base
According to Ehrig (2007), ontology contains core ontology, logical mappings, a knowledge base, and a lexicon [3]. Core ontology, S, is defined as a tuple of five sets: concepts, concept hierarchy or taxonomy, properties, property hierarchy, and concept to property function.
S = (C, ≤c R, σ ,≤ R)
where C and R are two disjoint sets called concepts" and relations" respectively. A relation is also known as a property of a concept. A function represented by σ(r) =< dom(r); ran(r) > where r € R, domain is dom(r) and range is ran(r). A partial order ≤R represents on R, called relation hierarchy, where r1 ≤R r2 iff dom (r1) ≤C dom (r2) and ran (r1) ≤C ran (r2). The notation ≤C represents a partial order on C, called concept hierarchy or taxonomy". In a taxonomy, if c1 <C c2 for c1; c2€C, then c1 is a sub concept of c2, and c2 is a super concept of c1. If c1 <C c2 and there is no c3€C with c1 <C c3 <C c2, then c1 is a direct sub concept of c2, and c2 is a direct super concept of c1 denoted by c1
c2. The core ontology formalizes the intentional aspects of a domain. The extensional aspects are provided by knowledge bases, which contain asserts about instances of the concepts and relations. A knowledge base is a structure_ a set I whose elements are called instance identifiers (or instance for short),
_ a function C : C→ Ә(I) called concept instantiation, _ A function {R: R → Ә(I2
) with (r)
C (dom(r))
C (ran(r)), for all r
R. The function R is called relation instantiation.2. FUZZY ALGORITHOM
In this paper, a priori knowledge about information for certain feature classes is used in order to classify image in fuzzy logic manner. More specifically,
a) input (image channels) and output variables (feature classes) are introduced in the working environment. b) Membership functions determine the accurate values for fuzzy matrix.
c) Fuzzy matrix optimization is used.
d) Fuzzy rules are applied by fuzzy simulations. e) Images are classified.
Fig 1: Fuzzy Algorithm
3. ONTOLOGICAL INSTANCE
MATCHING ALGORITHOM
The operational block of the instance matching integrates ontology alignment, retrieves semantic link clouds of an instance in ontology and measures the terminological and structural similarities to produce matched instance pairs. Pseudo code of the Instance Matching algorithm
Algo. InstanceMatch (ABox ab1, ABox ab2, Alignment A) for each insi element of ab1
cloudi=makeCloud(insi,ab1) for each insj element of ab2 cloudj=makeCloud(insj,ab2)
if
a(c1; c2) elements of A|c1 elements of Block(ins1:type) ^c2 elements of Block(ins2:type) if Simstruct(cloudi; cloudj) ≥
imatch=imatch
makeAlign(insi; insj)4. FUZZY MATCHING
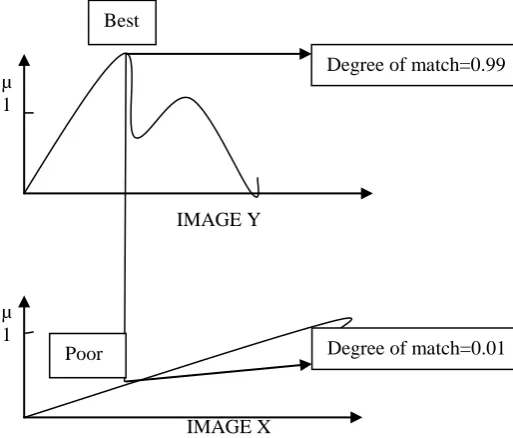
Let us consider the fuzzy matching for the mixing images on the input images [10]. .The degree to which the input target images satisfy the conditions of fuzzy rules and conditions .Suppose IMAGE X is defined by rules R1 and IMAGES Y is defined by rules R2.In this case the matching degree will be
Matching Degree (IMAGE X,R1)=µ(IMAGE X) Matching Degree (IMAGE Y,R2) =µ (IMAGE Y) Where µ is the fuzzy membership function.
The fuzzy matching determines the actual outcome for fuzzy optimization which is accomplished here by fuzzy matrix. Here is a graphical view of fuzzy matching degree for IMAGE Y as follows:
µ 1
IMAGE Y
µ 1
[image:2.595.313.570.167.386.2]
IMAGE X
Fig 2: The matching degree of fuzzy images
5. CLASSIFICATION PROCEDURE
In the classification mechanism, the maximum similar classifier [4] without NULL class was used. We implied a normal distribution and evaluate the variance and correlation of spectral response during the classification of the unknown pixel.
P(x)=probability density function of normal distribution. Where =Mean
=Variance.
The results of the image classification contains: number of classified pixels, average and complete correctness, and statistics for the each of the classes. If many of training areas pixels were classified into different classes, the training areas were not so well determined.
6. EXPERIMENTS WITH REAL-WORLD
DATA
For the procedures of image classification was used to gather images from “Google Earth” on the Bangladesh region (Chittagong zone). It uses this as a case study for implementing feature extraction. The collected images contain some common features such as roads, water, field, agriculture, buildings. The features will be separated based on the pixel intensity value selected for the individual features. It has been Result
Image Fuzzification
Membership modification
Fuzzy logic
Fuzzy set theory
Image defuzzificatio n
Image Filtering Expert Knowledge
Original image
Best
Degree of match=0.99
features can be extracted from the map images of Forestry complex.
[image:3.595.96.555.96.713.2]This image contains three channels recorded in three bands: the first band for green, the second for red and the third for blue. In the figure below, we present a fragment of this image and some statistics for the whole image.
Figure 3: Forestry Complex Area
After performing thresholding [5] based on color intensities defined for each and every feature, the features are higlighted with individual colors. Therefore, the highlighted feature area is clearly distinguished from the background. The thresholding process finally extract number of spatial features from the particular region such as road, water, field, building and forest.
(a)Water
(b)Field
Road (c)
Forest (d)
[image:3.595.55.281.154.295.2]Building (e)
Figure 4: Extracted Features from Forestry Area Image
The extracted features are further threshold for separating them from the background. This has been done by setting the background to all white form, thus displaying the particular feature is.
(a)Water
Field (b)
Road (c
Forest (d)
Building (e)
Figure 5: Separated Features from Forestry Area Image
7. FUZZY MATRIX OPTIMIZATION
Comparing between two given matrix and finding out the optimum values between them.
Steps To Solve the Problem:
1. Taking values of first matrix as input into the first array from a file for iterative comparisons.
2. Taking values of second matrix as input into the second Array from a file for iterative comparisons. 3. The values of both arrays will be compared than.
8. PSEUDO CODE FOR OPTIMIZATION
PROCESS
Fuzzy optimization (x.finput1 [], y.finput2 []) for the value i,j where i ≠ j
[image:3.595.51.298.378.682.2]9. RESULT EVALUATIONS FOR FUZZY
CLASSIFICATION
One way of the result evaluation was through the accuracy assessment. The classification results are compared to the raw image data and the report is created. This process is done during the random sample selection. The idea of the accuracy assessment is: point is highlighted in the sample list and observation [9] was done where it is located on the image.
The following table shows the mean and standard deviation for the classified classes:
Channel Mean Standard
Deviation
water (from 50 samples)
Green 73.53 12.32
Red 52.47 9.53
Blue 67.64 14.71
Forest (from 75 samples)
Green 143.12 22.12
Red 58.77 18.12
Blue 44.12 17.11
Agriculture (from 50 samples)
Green 122.77 15.50
Red 62.47 13.53
Blue 65.45 17.31
Buildings (from 50 samples)
Green 52.23 13.21
Red 39.12 8.56
Blue 44.12 10.11
Road (from 75 samples)
Green 83.35 16.00
Red 29.37 9.12
Blue 41.12 12.19
Creation of the membership functions for the output variables is done in the similar manner. Since this is Sugeno-type inference, constant type of output variable fits the best to the given set of outputs (land classes). When the variables have been named and the membership functions have appropriate shapes and names, everything is ready for writing down the rules.
Class Output variable
water 1
Forest 2
Agriculture 3
Buildings 4
Roads 5
Based on the descriptions of the input (green, red and blue channels) and output variables (water, agriculture, forest, buildings, and roads), the rule statements can be constructed:
Rules for image classification procedure in verbose format are
as follows:
IF (GREEN is a1) AND (RED is a1) AND (NIR is a1)
THEN (class is water)
IF (GREEN is a2) AND (RED is a2) AND (NIR is a2)
THEN (class is agriculture)
IF (GREEN is a3) AND (RED is a3) AND (NIR is a3)
THEN (class is forest)
IF (GREEN is a4) AND (RED is a4) AND (NIR is a4)
THEN (class is buildings)
IF (GREEN is a5) AND (RED is a5) AND (NIR is a5)
THEN (class is roads)
10. RESULT EVALUATIONS FOR
ONTOLOGICAL CLASSIFICATION
Ontological classification is different that fuzzy classification. The idea of the accuracy assessment is: point is highlighted in the sample list and observationwas done where it is located on the image.
The following table shows the mean and standard deviation for the classified classes:
Channel Mean Standard
Deviation
water (from 50 samples)
Green 63.11 22.12
Red 32.01 18.31
Blue 47.58 24.14
Forest (from 75 samples)
Green 120.54 32.31
Red 43.35 27.02
Blue 33.19 25.33
Agriculture (from 50 samples)
Green 92.12 19.31
Red 98.58 35.64
Blue 69.11 21.65
Buildings (from 50 samples)
Green 71.55 25.35
Red 96.25 21.98
Blue 48.56 20.28
Road (from 75 samples)
Green 89.32 19.22
Red 64.10 5.63
11. ACCURACY ASSESSMENTS BY
FUZZY LOGIC CLASSIFICATION
Idea for accuracy assessment of fuzzy logic classification results comes from the manner the maximum likelihood accuracy assessment was performed: select random sample areas with known classes and then let fuzzy logic „say‟ what these samples are. With 100 random selected samples, results were as following:
Correctly classified samples: 92 Misclassified: 08
Accuracy: 92%
12. ACCURACY ASSESSMENTS BY
ONTOLOGICAL CLASSIFICATION
Idea for accuracy assessment of ontological classification results comes from the manner the maximum likelihood accuracy assessment was performed: select random sample areas with known classes and then let fuzzy logic „say‟ what these samples are. With 100 random selected samples, results were as following:
Correctly classified samples: 74 Misclassified: 26
Accuracy: 76%
The both experiments and observations clearly showed that Fuzzy Logic classification is better than ontological knowledge base classification for Historical Heritages of India.
13. DISCUSSION AND CONCLUSION
This paper aimed for extracting the spatial features for providing a fundamental abstraction for modeling the structure of maps representing various raster images. The central part of this paper is an established procedure that is carried out for spatial Historical Heritages classification. As the work continues, it tries to implement every part of the procedure so as to establish its effectiveness and efficiency. It involved the use of supervised learning, assigning membership functions and discovery of pattern feature phases for successfully classifying an image. In the knowledge base, it must be well known whether selected sample forest area or water area.
14. REFERENCES
[1].Benjamins, V., Contreras, J., Corcho, O. & G_omez-P_erez, A. (2004).Six Challenges for the Semantic Web. AIS SIGSEMIS Bulletin, 1, 24-25.
[2]. Berners-Lee, T., Fischetti, M. & Dertouzos, M. (1999). Weaving the Web: The Original Design and Ultimate Destiny of the World Wide Web.Harper San Francisco.
[3]. Caracciolo, C., Euzenat, J., Hollink, L., Ichise, R., Isaac, A., Malais_e, V., Meilicke, C., Pane, J., Shvaiko, P., Stuckenschmidt. _Sv_ab-Zamazal, O. & Sv_atek, V. (2008). Results of the Ontology Alignment Evaluation Initiative 2008. Proceedings of Ontology Matching Work-shop of the 7th International Semantic Web Conference, Karlsruhe, Germany, 73{119.
[4].A.K Shackelford, and C.H. Davis. A hierarchical fuzzy classification approach for high-resolution multispectral data Over urban areas. IEEE Trans. Geo. Rem. Sen. 41(9): 1920-1932. 2003.
[5] Rob J. Decker. Texture analysis and classification of ERS SAR images for map updating of urban areas in the Netherlands. IEEE. Trans. Geo. Rem. Sen., 41(9):1950-1958, 2003.
[6] B. Solaiman, R. Fiset and F. Cavayas.Automatic road extraction using fuzzy concepts. IGARSS‟98, Seattle, USA. 1998.Sunnyvale, CA, 2004.
[7] Stefanakis, E.; Sellis, T.- Enhancing a Database Management System for GIS with Fuzzy Set Methodologies, Proceedings of the 19th International Cartographic Conference, Ottawa, Canada, August 1999.
[8] M. Törmä. Introduction to neural networks and their use in remote sensing. Photogrammetric Journal of Finland. 13(1): 87-102. 1992.
[9] Liu, H., Li. J., Chapman, M. A.;- Automated Road Extraction from Satellite Imagery Using Hybrid Genetic Algorithms and Cluster Analysis, Journal of Environmental Informatics 1 (2) 40-47 (2003)
[10] Guesgen, H.;Hertzberg, J.; Lobb, R.;Mantler, A. { Bu_ering Fuzzy Maps in GIS, Spatial Cognition and Computation, 2003
[11] W.K. Pratt. Digital Image Processing. John Wiley & Sons. NY. 1991
[12] Eastman, R { Idrisi 32 Release 2, Guide to GIS and Image Processing, Volume I- II, Clark University, May 2001
[13] Benz, U.; Hofmann, P.; Willhauck, G.; Lingenfelder, I.; Heynen, M. - Multi-resolution, object-oriented fuzzy analysis of remote sensing data for GIS-ready information, Journal of Photogrammetry & Remote Sensing, 2004