Munich Personal RePEc Archive
Assessment of School Effectiveness in
Greece using Multilevel Models
Kosmopoulou, Anna and Panaretos, John
1998
ASSESSMENT OF SCHOOL EFFECTIVENESS IN
GREECE USING MULTILEVEL MODELS
Anna Kosmopoulou and John Panaretos Department of Statistics
Athens University of Economics and Business 76, Patision St., 104 34 Athens, Greece E-mail for correspondence: [email protected]
Abstract
In recent years, a lot of attention has been given to the so-called ‘performance indicators’, which are primarily used for institutional comparisons. Education and health are the areas in which these indicators are widely applied, serving the needs of modern societies for highly qualified rendering of services.
In the present paper we focus attention in the area of education. Our main target is to assess the effectiveness of Greek schools and explore those factors that affect students’ performance in the Greek National Entrance Exams for Universities. Multilevel models are employed for this kind of analysis and more specifically, a three level model assigning students at level-1, schools at level-2 and prefectures at level-3.
Keywords and phrases: MULTILEVEL MODELING; HIERARCHICAL DATA; PERFORMANCE INDICATORS; SCHOOL EFFECTIVENESS;
1. INTRODUCTION
The need of quantitative comparisons between institutions gave rise to
the development of performance indicators. As Goldstein and Spiegelhalter
(1996) argued, ‘... a performance indicator is a summary statistical
measurement on an institution, or system, which is intended to be related to the
where these indicators are widely used in the last decade. We are primarily
interested in the performance indicators in the area of education.
In this paper we concentrate on outcome indicators in the area of
education. More specifically, the aim is to assess the effectiveness of Greek
Lyceums, to detect potential differences in the performance of Lyceums
according to the type of Lyceums (public, private), the gender of the students
and the scientific orientation that students have chosen. The data examined
refer to examination results for two adjacent years, 1990 and 1991. Thus, we
want to explore those factors that affect students’ achievement in the National
Entrance Exams for the Greek Universities and the Technical Institutions.
A basic characteristic of the data, that will be analyzed, is their
hierarchical structure. A hierarchy consists of units grouped at different levels
(Goldstein, (1995)). In the area of education the most trivial example of
hierarchical data consist of the grouping of students in classrooms and of
classrooms in schools. In the data we analyze in this paper the following
structure holds: there are prefectures, schools nested in prefectures and students
nested in schools. Consequently, there is the need for taking into account the
fact that the units of one level are subject to the influences of their grouping in
the units of higher levels. For this reason, when one wants to analyze a set of
data with hierarchical structure one cannot just ignore this hierarchy and use
traditional statistical analysis techniques. The analysis that is required, in such
cases, is the multilevel modeling. Furthermore, another subject that needs to be
treated cautiously is the need of making adjustments for the existing
achievements of the students. In the opposite case, the results produced by an
unadjusted analysis would be insufficient and misleading for the inferences
about school differences.
The data consist of prefectures, schools nested in prefectures and
students nested in schools. The hierarchical structure of the data is apparent as
well as the necessity for taking into account the fact that the students are
subject to the influences of their grouping in schools. This is the reason why
multilevel modeling is required for the analysis of this kind of data. On the
other hand, there is the need of making adjustments for the existing
achievements of the students. Otherwise, the results produced by an unadjusted
analysis would be insufficient and misleading as for the inferences about
school differences (Goldstein and Thomas (1996)).
We are going to use the results of the examinations taken for the
entrance exams as response variable. Also, the results of the examinations
taken at the end of the 3rd grade (last year) of Lyceum are going to be used as
indicators of the existing achievements of the students. Except from this
explanatory variable it is also possible to examine differences between boys
and girls, between public and private schools and differences in the
performance of students belonging to different scientific orientations. It would
also be interesting to include the socioeconomic status of the students as
explanatory variable and furthermore to observe the progress of the students in
Universities and Technological Educational Institutions according to their
achievements in the Lyceum.
The variables that are going to be used in the analysis concisely are the
following: the mean score of students in the National Entrance Exams, the 3rd
-Lyceum grade score, the type of school (public or private), the gender of
students, the scientific orientation (desmi) they have chosen and the year in
which the students took the National Entrance Exam. Let us now give a
Response Variable
The response variable is the mean score of students in the National
Entrance Exams. Students take four subjects in these Exams and these subjects
are different in each scientific orientation. More specifically, the subjects in
each scientific orientation are the following:
1st orientation 2nd orientation 3rd orientation 4th orientation
Mathematics Biology Ancient Greek Mathematics
Physics Physics Latin Sociology
Chemistry Chemistry History History
Composition Composition Composition Composition
Thus, for each student the mean score of the subjects has been calculated and
used as the response variable. Also, these scores have been transformed to
normality using normal scores, where this is a method of rescoring by
assigning expected values from the standard Normal distribution according to
the ranks of the original scores.
Explanatory variables
1. The only continuous explanatory variable that is going to be used in
the analysis is the 3rd-grade Lyceum score. This is the mean score of students in
the 3rd grade (last year) of Lyceum. The scores have been standardized in order
to follow the standard Normal distribution.
2. The type of school is going to be used also as explanatory variable.
There are two kinds of schools that are to be compared in the analysis. The
public Lyceums and the private ones. The variable indicating the kind of
school is a dummy variable coded 1 for public Lyceums and 0 for private
Lyceums.
3. It is also interesting to compare the performance of students according
to their gender. Thus, a dummy variable has been included in the analysis,
4. Furthermore, three dummy variables indicating the scientific
orientation that students have chosen have been included. The first one is coded
1 for the 1st orientation and 0 for the others. The second, is coded 1 for the 2nd
orientation and 0 for the others. The third, is coded 1 for the 3rd orientation and
0 for the others, while the 4th orientation is the base category. Thus, a
comparison between the four orientations can be made.
5. Finally, a dummy variable indicating the year in which students took
the Exams is included. This variable is coded 1 for those who took the Exams
in 1990 and 0 for those who took the Exams in 1991. It is important to mention
at this point that in the analysis only students who took for the first time the
National Entrance Exams are included.
4. DESCRIPTIVE STATISTICS
Let us now give some descriptive statistics for our data, separately for
each year of Exams. First, the data of the National Entrance Exam taken in
1990 will be analyzed. The number of the level-3 units, that is the prefectures,
is 51, the number of level-2 units, that is the schools, is 961 and the number of
the level-1 units, that is the students participated in the exam, is 52,041. The
total mean score of the students in National Entrance Exams is given in table
4.3.1. The grading Scale in the Greek Educational system is from 0 to 20.
(18.1-20 excellent, 16.1-18 very good, 13.1-16 good, 10-13 almost good,
5.1-9.9 insufficient, 0-5 bad).
Table 4.3.1 Descriptive statistics for the 1990 Greek National Entrance Exams score
Variable Mean Std Dev Minimum Maximum N of cases
National Entrance Exams Score
Among the prefectures, the one with the highest mean score is Chios
(prefecture 4) with mean National Entrance Exams score 11.58 and with 247
participating students. The prefecture with the second highest mean score is
Corinthia (prefecture 7) with mean score 11.33 and 732 students. The
prefecture with the lowest mean score is Evros (prefecture 47) with mean score
8.62 and 451 students. However, it is also interesting to set out the performance
of students in these Exams according to: (a) the type of school, (b) the
scientific orientation and (c) the gender of students. These data are reported in
tables 4.3.2, 4.3.3 and 4.3.4 respectively.
Table 4.3.2 Descriptive statistics for the 1990 Greek National Entrance Exams score according to the type of school
Variable Type Mean Std Dev Minimum Maximum N of cases
National Entrance Exams Score Public Private 10.16 11.07 4.80 5.00 0 0.13 19.72 19.47 51,358 683
As we can observe from the above table, private schools have a higher mean
score than the public ones, but the highest mean score for that year was attained
by a student in a public school. Besides, we have to take into consideration the
small number of students attending private schools.
Table 4.3.3 Descriptive statistics for the 1990 Greek National Entrance Exams score according to the scientific orientation
Variable Orientation Mean Std Dev Minimum Maximum No of cases
National Entrance Exams
Score
1st orient. 2nd orient. 3rd orient. 4th orient.
9.81 12.05 12.65 8.63 4.62 4.74 4.46 4.40 0.06 0.03 0 0.03 19.63 19.66 19.72 19.66 11,561 4,552 12,640 23,288
[image:7.595.85.514.335.435.2]Variable Orientation Mean Std Dev Minimum Maximum No of cases
National Entrance Exams
Score
Boys
Girls
9.66
10.54
4.87
4.73
0
0
19.63
19.72
21,887
30,154
The data of the Exams taken in 1991 are also analyzed. The number of
the level-3 units, that is the prefectures, is 51, the number of level-2 units, that
is the schools, is 978 and the number of the level-1 units, that is the students, is
54,200. The total mean score of the students in the 1991 National Entrance
Exams is given in the table 4.3.5.
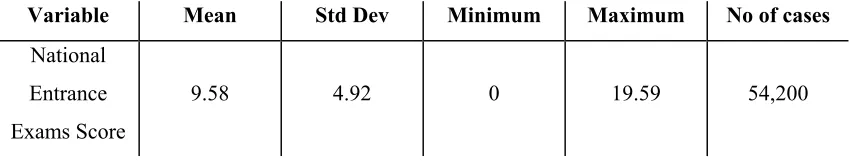
Table 4.3.5 Descriptive statistics for the 1991 Greek National Entrance Exams score
Variable Mean Std Dev Minimum Maximum No of cases
National Entrance Exams Score
9.58 4.92 0 19.59 54,200
It is important to point out the lowering of the mean score for the Exams taken
in 1991 as compared to that of 1990. Among the prefectures, the one with the
highest mean score is again Chios (prefecture 4) with mean National Entrance
Exams score 11.01 and with 289 students. The prefecture with the second
highest mean score is Trikala (prefecture 31) with mean score 10.39 and 814
students. The prefecture with the lowest mean score is Evritania (prefecture 27)
with mean score 7.44 and 77 students. Besides, the performance of students in
these Exams according to: (a) the type of school, (b) the scientific orientation
and (c) the gender of students is set out, too. These data are reported in tables
4.3.6, 4.3.7 and 4.3.8 respectively.
Table 4.3.6 Descriptive statistics for the 1991 Greek National Entrance Exams score according to the type of school
[image:8.595.90.513.71.174.2] [image:8.595.86.511.347.430.2]National Entrance Exams Score Public Private 9.58 9.87 4.92 5.35 0 0.06 19.59 19.44 53,386 814
As in the previous year, the private schools do better than the public ones, but
now the difference is much smaller.
Table 4.3.7 Descriptive statistics for the 1991 Greek National Entrance Exams score according to the scientific orientation
Variable Orientation Mean Std Dev Minimum Maximum No of cases
National Entrance Exams
Score
1st orient. 2nd orient. 3rd orient. 4th orient.
8.95 11.60 13.39 7.52 3.89 4.40 4.32 4.45 0.06 0 0.06 0 19.03 19.41 19.59 19.53 12,292 4,551 12,874 24,483
The students of the 3rd scientific orientation do better than the students of the
other orientations, while the differences in mean scores between the four
orientations are large.
Table 4.3.8 Descriptive statistics for the 1991 Greek National Entrance Exams score according to the gender of the students
Variable Orientation Mean Std Dev Minimum Maximum No of cases
National Entrance Exams Score Boys Girls 8.84 10.12 4.74 4.99 0 0 19.56 19.59 22,700 31,500
In the Exams taken in 1991 girls do better than boys, just as in the previous
year, but this time with larger difference.
[image:9.595.81.511.72.155.2] [image:9.595.83.515.525.627.2]A simple model that is used for the assessment of school effectiveness is
the following one:
Yij =β0 +β1Xij+u0j+e0ij
The above model is called variance components model and the only random
parameters are the intercept variances at each level. In these models, the
variance of the response about the fixed component is
var(Yij|β β0, 1,Xij) var(= u0 +e0ij)=σ2u0 +σ2e0
where σu0 2
and σe0 2
are the level-2 and the level-1 variance respectively. Thus,
in the variance components models, the variance of the response about the
fixed component is the sum of level-1 and level-2 variance. A measure of the
extend of clustering of students within schools is the intra-school correlation
and is defined as
ρ σ
σ σ
= +u
u e 0 2
0 2
0 2 .
In other words, this correlation measures the proportion of variance that is
between schools (Goldstein, 1995). A variance component model is a 1-level
model in its simpler form. In order to include further fixed explanatory
variables in the previous model we extend it and we have
yij Xij u zhj hij e z
h
ij ij
= + +
=
∑
β
0 1
0 0
where X is the design matrix for the fixed explanatory variables, Xij is the ijth
row of X and zhij are the explanatory variables for the random part of the
Z1={x1ij}. Any of the explanatory variables can be measured at any of the
levels.
A preliminary series of analyses has been carried out, using the
statistical package MLwiN (Goldstein et al (1998)), in order to determine a
parsimonious relationship between the mean score of students in the National
Entrance Exams and the mean score of students in the 3rd grade of Lyceum.
The model to which we have ended up is the following one:
where yijk is the mean score of students in the National Entrance Exams, x0 is
the constant term, x1ijk is the 3rd-grade score, x2jk is the type of school, x3ijkis
the gender of the students, x4ijk, x5ijk and x6ijk are the dummy variables
Finally, x7k is the year in which the students took the Exam. The parameter
estimates for the model is given by the table below:
Parameter Estimate (s.e.)
Fixed: Constant -0.768 3rd-grade score 0.784 (0.005)
Type of school 0.543 (0.053) Gender of student -0.214 (0.004) Scientific Orientation 1 -0.036 (0.005) Scientific Orientation 2 0.057 (0.006) Scientific Orientation 3 0.446 (0.004) Year of the Exams 0.124 (0.031)
Random: σv 02
(between prefectures) 0.017 (0.004) σv10 -0.002 (0.001) σv12 0.001 (0.000)
σu 02
(between schools) 0.123 (0.006) σu10 -0.008 (0.001) σu12 0.006 (0.000)
σu 70 -0.012 (0.004) σu 71 0.003 (0.002)
σu 72 0
σe02
(between students) 0.321 (0.002) σe30 -0.031 (0.001)
-2*log(likelihood) 174379.100
The total level-3 variance is a quadratic function of the 3rd-grade score and
level-2 variance is a function of two explanatory variables; the 3rd-grade score
and the year in which the students took the Exam:
Total level-3 variance
var(v x0k 0 +v x1k 1ijk)=σv20x02 +2σv01x x0 1ijk +σ2v1x12ijk
Total level-2 variance
var(u x u x u x ) x x x x
x x x x
jk jk ijk jk k u u ijk u ijk u k u ijk k
0 0 1 1 7 7 0 2
0 2
01 0 1 1 2
1 2
07 0 7 17 1 7
2
2 2
+ + = + +
+ +
σ σ σ
σ σ
Moreover, in this model the level-1 variance is also a quadratic function of an
explanatory variable; the gender of the student. Thus, the level-1 variance is
given by
Total level-1 variance
var(e0ijkx0 +e3ijkx3ijk)=σ2e0x02 +2σe03x x0 3ijk
because we have constrained the variance of the gender coefficient to be zero.
Consequently, for girls (x3ijk=1) the level-1 variance is σe20 σe 03
2
+ and for boys
(x3ijk=0) the level-1 variance is σe02
.
5. RESULTS
The level-2 and level-3 residuals have been estimated for each school
effectiveness is to try to identify schools, or prefectures, with residuals which
are substantially different. In order to do so, first, we order the residuals from
smallest to largest and then we construct an interval about each residual so that
the criterion for judging statistical significance at the (1-α)% level for any pair
of residuals is whether their confidence intervals overlap. In the two figures
presented below the confidence intervals for the level-2 residuals and for the
level-3 residuals are presented. Two schools or two prefectures, respectively,
are judged to have significantly different residuals, at the 5% level, if and only
if their error bars do not overlap.
Level-2 Residuals Level-3 Residuals
As we observe from the figures above there is substantial difference
between some schools and between some prefectures also. As far as the
prefectures are concerned, the one with the highest mean score, for both years,
is the prefecture of Corinthia of the 1990 Greek National Entrance Exam. The
second best prefecture is Attica again of the 1990 Exam. On the other hand,
prefecture 47 of the 1991 Exam has the lowest mean score for both years. We
stress again that: (a) two prefectures are judged to have significantly different
residuals, at the 5% level, if and only if their error bars do not overlap and (b)
6. DISCUSSION
The purpose of this paper has been to assess school effectiveness in
Greece using multilevel models and to make adjustments for the previous
achievements of the students. Some interesting differences, with respect to
gender, to the type of institution and to the scientific orientation that students
have chosen, have been observed.
To be more precise, first of all, if we do not make adjustment for the 3rd
-grade Lyceum score we conclude that girls do much better than boys in the
National Entrance Exam in Greece and that the students of the 1st, 2nd and 3rd
scientific orientation do better than those in the 4th one. The difference between
the 2nd and, especially, the 3rd scientific orientation with the 4th orientation is
very large. On the other hand, if we make adjustment for the background of the
students, that is the 3rd-grade score, then the results would be very different. It
has been observed that the 3rd grade Lyceum score is a very significant
explanatory variable, since the estimate of the standard error of the parameter is
less than a third of the parameter estimate (0.784(0.005)). In this case, we
concluded that boys do better than girls. This means that boys make more
progress than girls in the National Entrance Exam with respect to their 3rd
-grade Lyceum score. It was also concluded that public schools do much better
than private ones, while the scientific orientation differences are not so
pronounced and that students who choose the 4th scientific orientation do better
than ones who choose the first one. Finally, it was found that the students who
took the Exam in 1990 did better than those who took the Exam in 1991.
In order to identify schools or prefectures with residuals which are
substantially different we ordered the residuals from smallest to largest and
confidence intervals about each residual were constructed. Through this
procedure we concluded that the prefecture with the highest mean score, for
prefecture was Attica for the year 1990 while the prefecture of Evros for the
year 1991 had the lowest mean score for both years.
Nevertheless, we have to keep in mind that there are limitations in
making comparisons between institutions and that when we apply a statistical
model we have to treat the results as suggestive rather than definitive
(Goldstein, Spiegelhalter (1996)). When comparative information about
institutions are to be analyzed, it must be handled sensitively and with regard to
all its problems and limitations.
REFERENCES
Goldstein, H., Rasbash, J., Plewis, I., Draper, D., Browne, W., Yang, M., Woodhouse, G., Healy, M. (1998). A User’s Guide to MLwiN. Multilevel Models Project: Institute of Education, University of London.
Goldstein, H. (1995). Multilevel Statistical Models. (2nd edition). London, Edward Arnold; New York, Halstead Press.
Goldstein, H. and Speigelhalter, D. J. (1996). League Tables and their Limitations: Statistical Issues in Comparisons of Institutional Performance, Journal of the Royal Statistical Society, Series A, 159, 385-443.
Goldstein, H. and Thomas, S. (1996). Using Examination Results as Indicators of School and College Performance, Journal of the Royal Statistical Society, Series A, 159, 149-163.