A Review of the Measures Designed to
Assess DSM-5 Personality Disorders
Adrian Furnham1, Rebecca Milner1, Reece Akhtar1, Filip De Fruyt21Research Department of Clinical, Educational and Health Psychology, University College London, London, UK 2Department of Developmental, Personality and Social Psychology, Ghent University,Ghent, Belgium
Email: a.furnham@ucl.ac.uk
Received 3 July 2014; revised 1 August 2014; accepted 24 August 2014
Copyright © 2014 by authors and Scientific Research Publishing Inc.
This work is licensed under the Creative Commons Attribution International License (CC BY).
http://creativecommons.org/licenses/by/4.0/
Abstract
The definition, classification and assessment of personality disorders (PDs) have attracted con-siderable debate for nearly 50 years. This paper attempts a comprehensive review of the instru-ments to assess all, or specific, individual disorders as described in DSM-5, including structured interviews and inventories. The review should be helpful for clinicians, researchers and also in-dustrial and organizational psychologists, to screen and assess the personality pathology spec-trum from subclinical manifestations to full blown personality pathology. A decision tree helpful to choose among the different measures is also provided.
Keywords
Personality Disorders, Personality Pathology, Measures, Questionnaires, Structured Interviews
1. Introduction
At the same time, the attention to PDs, both from an academic and societal perspective, expanded dramatical-ly due to the impairing character of the diagnoses and the increasingdramatical-ly high financial costs involved in the treatment of patients with personality pathology (Gustavsson et al., 2012). Apart from attention from clinical psychologists to full-blown personality pathology, selection and human resources psychologists have become interested in subclinical manifestations of aberrant personality and the impact on individuals’ workplace func-tioning. This is because a substantial proportion of the general population and workforce has personality prob-lems themselves or has to deal with (subclinically) disordered persons as colleagues or supervisors (Wille, De Fruyt, & De Clercq, 2013; De Fruyt, Wille, & Furnham, 2013b). Whereas clinical psychologists have been treating patients with one or more PDs and co-occurring pathology, industrial and organisational psychologists run career development programs to coach people on how to deal with the dark sides of their personality, a common need for all these professional groups is well-designed and psychometric sound assessment instruments. In addition, they also need criteria to choose among the different instruments currently available.
The present paper provides a broad review of current PD measures together with a decision tree to choose among them. Length constraints meant we could not consider proposed personality disorders like Depressive Personality Disorder. The aim is to be comprehensive and descriptive rather than (psychometrically or concep-tually) critical which would involve a different paper. We have attempted to catalogue all measures, which has not been done before. The measures are in no way psychometrically equivalent though each paper has been peer reviewed.
Over the years a large number of measures have been devised for research and practice. The aim of this re-view is to alert psychologists and researchers to the range of instruments available to assess the categorically conceived PDs listed in DSM-5 and provide a set of criteria by which professionals may choose one over anoth-er. In the introduction of this paper we refer to DSM-5 PDs, though it should be clear that almost all measures were developed before the release of DSM-5, so we refer to these previous DSM-editions when describing these measures. The available PD measures differ on at least four major characteristics.
First, some instruments attempt to be comprehensive and measure all of the PDs currently (or previously) thought to exist, because the nature and number of PDs have shifted across the different DSM editions. Some “admit” disorders that others discount, but the usual number is around 10 - 15 disorders. On the other hand, some instruments set out simply to measure one very specific disorder. Second, there seem to be four most common methods to assess the PDs: structured diagnostic interviews, rating instruments for clinicians, self-re- port questionnaires and other-report questionnaires (Friedman, Oltmanns, & Turkheimer, 2007). Thus, two use observer data (clinician, family) and two use self-report data approaches towards measurement. By far the most common however are questionnaires and structured interviews. Third, some measures are about subtypes of the PD in the sense that they are multidimensional measures that yield scores on different, but related facets of the disorder. For example, some measures and theorists may distinguish between grandiose and vulnerable, or communal and agentic Narcisistic PD (NPD; Gebauer, Sedikides, Verplanken, & Maio, 2012). Most measures, however, mimic DSM-5 categorical criteria and are not about the distinction among subtypes of a specific PD.
Fourth and finally, PD measures have been developed for essentially five target groups. The first group of us-ers are clinicians attempting a reliable and valid diagnosis of a PD. The second is a related group, namely aca-demic researchers who may be testing theories of the aetiology or prognosis of a PD eventually after treatment. Industrial and organisational psychologists form a third professional group interested in evaluating aberrant personality and subclinical forms of personality pathology in the context of personnel selection or career coach-ing and development. Finally, there are two other groups, namely “lay people” who may be interested in self-diagnosis, but also relatives of those with a specific PD requiring information about personality disorder symptoms and its prognosis.
There are, inevitably, a number of instruments on the web with unknown psychometric properties as well as various “popular books” that attempt to explain and describe the PDs for the lay public. The present review, however, primarily attempts a comprehensive overview for the first three groups interested in the professional assessment of personality pathology.
Table 1. Different labels for traits associated with similar disorders.
DSM-IV Personality Disorder Hogan & Hogan (1997) HDS Themes Oldham & Morris (1991) Miller (2008) Dotlich & Cairo (2003) Paranoid
Distrustful and suspicious of others; motives are interpreted
as malevolent.
Sceptical
Cynical, distrustful and doubting others’ true
intensions.
Vigilant Vigilantes Habitual
Schizoid
Emotional coldness and detachment from social relationships; indifferent
to praise and criticism.
Reserved
Aloof, detached and uncommunicative; lacking interest in or awareness of
the feelings of others.
Solitary Oddballs Aloof
Schizotypal
Odd beliefs or magical thinking; behaviour or speech that is odd,
eccentric or peculiar.
Imaginative
Acting and thinking in creative and sometimes
odd or unusual ways.
Idiosyncratic Creativity
and vision Eccentric
Antisocial
Disregard for the truth; impulsivity and failure to plan ahead; failure
to conform.
Mischievous
Enjoying risk taking and testing the limits; needing excitement; manipulative, deceitful, cunning and
exploitative.
Adventurous Predators Mischievous
Borderline
Inappropriate anger; unstable and intense relationships alternating between idealisation and devaluation.
Excitable
Moody and hard to please; intense but short-lived
enthusiasm for people, projects or things.
Mercurial Reactors Volatility
Histrionic
Excessive emotionality and attention seeking; self dramatising, theatrical and exaggerated emotional expression.
Colourful
Expressive, animated and dramatic; wanting to be noticed and needing to be
the centre of attention.
Dramatic Emoters Melodramtic
Narcissistic
Arrogant and haughty behaviours or attitudes, grandiose sense of self-importance and entitlement.
Bold
Unusually self-confident; feelings of grandiosity and entitlement; over valuation
of one’s capabilities.
Self-Confidence Preeners Arrogance
Avoidant
Social inhibition; feelings of inadequacy and hypersensitivity
to criticism or rejection.
Cautious
Reluctant to take risks for fear of being rejected or
negatively evaluation.
Sensitive Shrinkers Excessive Caution
Dependent
Difficulty making everyday decisions without excessive advice
and reassurance; difficulty expressing disagreement out of fear
of loss of support or approval.
Dutiful
Eager to please and reliant on others for support and guidance; reluctant to take independent action or to go
against popular opinion.
Devoted Clingers Eager to Please
Obsessive- Compulsive
Preoccupations with orderliness; rules, perfectionism and control; over- Conscientiousness and
inflexible.
Diligent
Meticulous, precise and perfectionistic, inflexible about rules and procedures;
critical of others; .
Conscientious Detailers Perfectionistic
Passive- Aggressive
Passive resistance to adequate social and occupational performance;
irritated when asked to do something he/she does not want to.
Leisurely
Independent; ignoring people’s requests and becoming irritated or argumentative if they
persist.
Leisurely Spoilers Passive Resistance
psychologists(Dotlich & Cairo, 2003) to explain the PDs to lay people.
2. Available Measures
when these provide direct assessments of the categorical PDs. To our knowledge a review such as this has not been done before, though there are review papers that have reviewed some instruments at the same time (Clark & Harrison, 2001; McDermut & Zimmerman, 2008; Segal & Coolidge, 2007; Widiger & Boyd, 2009; Zimmer-man, 2003).
Apart from usual bibliometric investigations, we emailed over 50 experts (mainly those on the editorial board of specialist PD journals) in the area showing them our list and asking if they knew of any measures that we were not aware of. This did yield half a dozen extra, and we are reasonably satisfied that we have been able to locate most important measures.
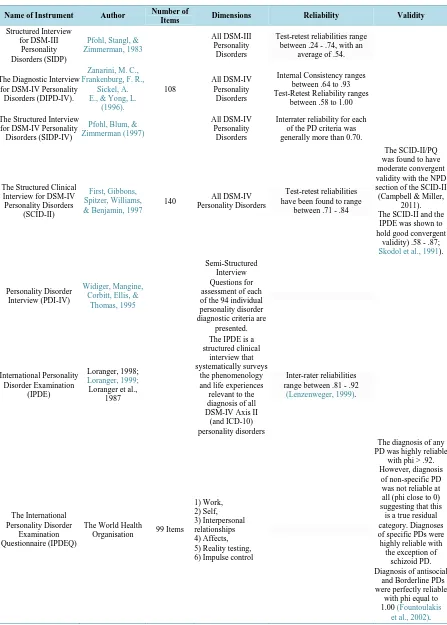
3. Measures of all the Personality Disorders (See Table 2)
3.1. Structured InterviewsThe Structured Interview for DSM-III Personality Disorders (SIDP; Pfohl, Stangl, & Zimmerman, 1983) has largely fallen out of favour because of its focus on DSM-III PDs. Despite this, it has been shown to hold highly variable test-retest reliabilities ranging from .24 for obsessive-compulsive PD to .74 for histrionic PD, with an average level of .54 (First et al., 1995). Pfohl, Blum and Zimmerman (1997) adapted the SIDP at the advent of the DSM-IV, releasing The Structured Interview for DSM-IV Personality Disorders (SIDP-IV)—a fairly brief interview (lasting roughly 60 minutes) that features both a patient and an informant. This is beneficial as it helps gain a different perspective on the patient in question. There are two versions of the SIDP-IV: a diagnostic ver-sion and a “topical” verver-sion, though the only difference is the order of the questions. The benefit of including a topical version is that it includes natural questions that are designed to make interviewing defensive patients easier. Much like the International Personality Disorder Examination (IPDE;Loranger, 1999; see below), the SIDP-IV can also assess for Personality Disorder Not Specified (PDNOS) however the SIDP-IV will diagnose a PDNOS only when two or more disorders are one criterion short of the diagnostic threshold. Jane, Pagan, Turk-heimer, Fiedler and Oltmanns (2006) found inter-rater reliability for each PD being greater than .70, a finding also supported by Damen, De Jong and Van Der Kroft (2004).
The Diagnostic Interview for DSM-IV Personality Disorders (DIPD-IV; Zanarini, Frankenburg, Sickel, & Yong, 1996). This semi-structured clinical interview assesses all DSM-IV PDs, and like most clinical interviews, specialised training is required before the interview can be administered. The interview has 108 items, with each disorder rated on a scale of 0 (disorder is absent) to 2 (disorder is present). If the totalled scores exceed a thre-shold the clinician can diagnose a disorder. The original paper cites internal consistency levels ranging from .64 to .93, with six of the disorders having levels greater than .70; acceptable levels of test-retest reliability with Kappa = .58 to 1 are reported over a 6-month period. These are also called dependability coefficients (Chmie-lewski & Watson, 2009). The DIPD-IV was used in the Collaborative Longitudinal Personality Disorders Study (CLPS).
The Structured Clinical Interview for DSM-IV Personality Disorders (SCID-II; First, Gibbons, Spitzer, Wil-liams, & Benjamin, 1997) is widely used and researched, unlike the DIPD-IV. The respondent typically first completes a questionnaire and interviewers then follow up responses. It is also the shortest interview (140 items), lasting minimally 30 minutes (the DIPD-IV lasts around 90 minutes). The SCID-II measures all DSM-IV PDs and the associated symptoms in the order they are presented in the DSM-IV. Some have criticised its brevity (Rogers, 2003). Investigations into the instrument’s reliability and validity have shown considerable support. Lobbestael, Leurgans and Arntz (2011) found mean kappa scores of .84. Moran et al. (2003) provided further support with mean kappa scores of .71, but others have reported lower Kappas (Hyler, Skoldol et al., 1990, 1992). Skodol et al. (1991) investigated the convergent validity of the SCID-II by comparing it to diagnoses made by the International Personality Disorder Examination (IPDE; Loranger, 1999). The authors found that the two instruments’ diagnoses for each PD correlated from .58 to .87, suggesting that both instruments measure the same PDs to a “reasonable” extent.
Table 2. A review of measures that attempt to measure all the disorders.
Name of Instrument Author Number of
Items Dimensions Reliability Validity
Structured Interview for DSM-III
Personality Disorders (SIDP)
Pfohl, Stangl, & Zimmerman, 1983
All DSM-III Personality
Disorders
Test-retest reliabilities range between .24 - .74, with an
average of .54.
The Diagnostic Interview for DSM-IV Personality
Disorders (DIPD-IV).
Zanarini, M. C., Frankenburg, F. R.,
Sickel, A. E., & Yong, L.
(1996).
108
All DSM-IV Personality
Disorders
Internal Consistency ranges between .64 to .93 Test-Retest Reliability ranges
between .58 to 1.00
The Structured Interview for DSM-IV Personality Disorders (SIDP-IV)
Pfohl, Blum, & Zimmerman (1997)
All DSM-IV Personality
Disorders
Interrater reliability for each of the PD criteria was generally more than 0.70.
The Structured Clinical Interview for DSM-IV Personality Disorders
(SCID-II)
First, Gibbons, Spitzer, Williams, & Benjamin, 1997
140 All DSM-IV Personality Disorders
Test-retest reliabilities have been found to range
between .71 - .84
The SCID-II/PQ was found to have moderate convergent validity with the NPD section of the SCID-II (Campbell & Miller,
2011). The SCID-II and the
IPDE was shown to hold good convergent
validity) .58 - .87; Skodol et al., 1991).
Personality Disorder Interview (PDI-IV)
Widiger, Mangine, Corbitt, Ellis, &
Thomas, 1995
Semi-Structured Interview Questions for assessment of each of the 94 individual personality disorder diagnostic criteria are
presented. International Personality Disorder Examination (IPDE) Loranger, 1998; Loranger, 1999;
Loranger et al., 1987
The IPDE is a structured clinical interview that systematically surveys
the phenomenology and life experiences relevant to the diagnosis of all DSM-IV Axis II
(and ICD-10) personality disorders
Inter-rater reliabilities range between .81 - .92
(Lenzenweger, 1999).
The International Personality Disorder
Examination Questionnaire (IPDEQ)
The World Health
Organisation 99 Items
1) Work, 2) Self, 3) Interpersonal relationships 4) Affects, 5) Reality testing, 6) Impulse control
The diagnosis of any PD was highly reliable
with phi > .92. However, diagnosis
of non-specific PD was not reliable at all (phi close to 0) suggesting that this
is a true residual category. Diagnoses of specific PDs were highly reliable with
the exception of schizoid PD. Diagnosis of antisocial
and Borderline PDs were perfectly reliable
with phi equal to 1.00 (Fountoulakis
Continued
Iowa Personality Disorder Screen (IPDS)
Langbehn, Pfohl, & Reynolds et al.,
1999.
11 All DSM-III-R Personality Disorders
The average internal consistency was .72 (Langbehn et al., 1999).
Blind administration of the IPDS yielded excellent sensitivity (92%) and good specificity (79%), using a subset of five
screening items
(Langbehn et al., 1999).
The personality assessment inventory (PAI)
Morey (1991) 344
Clinical: 1) Somatic Complaints 2) Anxiety
3) Anxiety-Related Disorders 4) Depression 5) Mania 6) Paranoia 7) Schizophrenia 8) Borderline Features 9) Antisocial Features 10) Alcohol Problems 11) Drug Problems
Interpersonal Scales 1) Dominance 2) Warmth
Treatment Scales 1) Aggression 2) Suicidal Ideation 3) Stress
4) Non-support 5) Treatment Rejection
Validity Scales 1) Infrequency 2) Negative Impression
3) Positive Impression 4) Inconsistency
Internal consistency reliability on average = .82.
Subscale reliabilities were lower averaging .66.
The scales were found to significantly
correlate with the prevalence of life-events in psychiatric patients, except for the mania
and anxiety scales.
Standardised Assessment of
Personality: Abbreviated Scale
(SAPAS)
Moran, Leese, Lee, Walters, Graham,
Thornicroft, & Mann (2003)
8
All DSM-IV Personality
Disorders
When compared to the SCID-II, the SAPAS was found to
have a good balance of sensitivity (.73) and specificity (.9; Pluck, Sirdifield, Brooker & Moran,
2012).
The Hogan Development Survey
Hogan & Hogan, 1997
1) Excitable 2) Sceptical 3) Cautious 4) Reserved 5) Leisurely 6) Bold 7) Mischievous 8) Colourful 9) Imaginative 10) Diligent 11) Dutiful
The HDS can predict work success, as well as each factor being reduced to clusters A, B and C of the DSM-IV (Furnham
et al., 2012).
The Omnibus Personality Inventory (OMNI)
Loranger, 1994,
2002 375 items
This questionnaire uses a seven-point Likert-type scale to
measure features of all DSM-IV
Continued
Schedule for Nonadaptive and Adaptive Personality
(SNAP)
Clark, 1993 375 items
All DSM-IV Personality
Disorders
Test-retest correlation coefficients over 7 to 14 months ranged from .59 to
.84. (Melley, et al., 2002)
Our results support the predictive validity of the diagnostic scales on the SNAP
(Clark, 1993). SNAP scores can predict cluster A and
C diagnoses.
The Personality Diagnostic Questionnaire (PDQ)
Hyler et al., 1988 163 items
All DSM-III Personality
Disorders
Internal consistency ranges between .43 - .70(Hyler & Lyons, 1988). Test-retest reliabilities are greater than
.56 (Hurt et al., 1984)
The Personality Diagnostic Questionnaire
Revised (PDQ-R)
Hunt & Andrews,
1992 152 items
All DSM-III Personality Disorders
Test-retest reliabilities are greater than .76 (Uehara et al.,
1997)
The PDQ-R showed high sensitivity and moderate specificity
for most axis II disorders (Hyler
et al.,1992)
The Personality Diagnostic Questionnaire
4th Edition (PDQ-4)
Hyler, 1994 99 items Test-retest reliabilities averaging .67.
Compared to the SCID-II, Kappa levels were no lower than .50. The PDQ-4
demonstrated high sensitivity and low
specificity. (Abdin et al., 2011)
Coolidge axis-II
inventory (CATI) Coolidge, 1984 225 items
13 Personality Disorder Scales
(DSM-II) 3 Axis I Disorders
Excellent test-retest reliability (.90) has been established, as
well as moderate internal consistency (.76). (Coolidge &
Merwin, 1992). Watson & Sinha (1996)—a gender difference was found
on the antisocial scale. Age differences were found for several PD scales in that younger respondents (17 - 24 years) scored higher than the
older ones (25 - 57 years). The test has demonstrated reliability and validity and has
been used in a variety of contexts, such as attributes of psychology majors in college
(McCray, King, & Bailly, 2005).
The test has demonstrated reliability and validity and has been used in a variety
of contexts, such as attributes of psychology majors in
college (McCray, King, & Bailly, 2005),
A 50% concordance rate with clinicians’ diagnoses for 24 personality-disordered
out-patients was found (Coolidge &
Merwin, 1992).
Coolidge axis-two inventory
(SCATI)
Coolidge, 2001 70 items All DSM-IV Personality Disorders
Despite the scales being reduced from an average of approximately 25 items to 5 items in length, the SCATI has good internal reliability (Watson & Sinha, 2007) Multivariate analysis revealed that the internal structure of the SCATI is similar to the original. The SCATI is found to have
good internal reliability.
PCA and CFA reveal that the internal structure of the test has dimensions similar
to the full CATI. Therefore, the SCATI
is an instrument of value for further research (Watson &
Continued
Millon Clinical Multiaxial Inventory-III
(MCMI-III)
Millon, Millon, Davis & Grossman
(2006)
175
14 Personality Disorder Scales; 11 Moderate Personality
Disorder Scales; 3 Severe personality
Pathology Scales; 10 Clinical Syndrome
Scales; 7 Moderate Syndrome Scales; 3 Severe Syndrome Scales Corrections Scales; 3 Modifying
Indices; 2 Random Response Indicators;
42 Grossman Personality Facet
Scales
Examining the temporal stability of the personality disorder subscales from the MCMI: Psychiatric inpatients
completed the MCMI at initial admission and at the next admission (within 2 years).
The scales demonstrated adequate stability. High retest correlations for the
MCMI clinical syndrome subscales—Overholser (1990).
Retzlaff (1996) found the MCMI-III’s predictive power to
range between .00 to .32, however Millon
et al. (1997)found the diagnostic validity
to range between .33 - .93,
with an average coefficient of .64.
Personality Beliefs
Questionnaire (PBQ) Beck & Beck, 1991. 126
10 Personality disorders: 1) Avoidant 2) Dependent 3) Obsessive- Compulsive 4) Histrionic 5) Passive-Aggressive 6) Narcissistic 7) Paranoid 8) Schizoid 9) Antisocial 10) Borderline
PBQ administered to students, showing good internal consistency across scales; Cronbach’s alphas ranged from .77 to .93. Test-retest correlation coefficients over a month interval were high,
ranging from .63 (passive-aggressive) to .82 (paranoid; Trull, et al.,1993).
Modest correlations were obtained between the PBQQ and measures of PDs
such as the PDQ-R (Hyler et al., 1992), and the Minnesota Muliphasic Personality
Inventory (Morey et al., 1985). These results question the criterion validity of
the PBQ for nonclinical PD traits
(Trull, et al., 1993).
The PBQ-Short Form (PBQ-SF)
Butler, Beck, &
Cohen, 2007 65
All DSM-IV Personality Disorders
Internal consistency coefficients range between .81 - .92. Test-retest correlations range from .57 - .82 (Butler
et al., 2007).
Minnesota multiphasic personality inventory (MMPI) for DSM-III
Morey, Waugh, & Blashfield (1985) 1) Histrionic 2) Narcissistic 3) Borderline 4) Antisocial 5) Depressed 6) Obsessive- Compulsive 7) Passive-Aggressive 8) Paranoid 9) Schizotypy 10) Avoidant 11) Schizoid
The complete version of these scales yielded internal consistency estimates superior to those obtained in examining the original clinical scales from
the MMPI (from previous versions of the DSM). Hence,
it appears that the derived scales are reliable as defined
by internal consistency— Morey, Waugh, & Blashfield,
1985.
This study found that 5 of the 11 MMPI-PD
scales correlated positively and significantly with the
corresponding MCMI-PD scales, which gives limited
support for the concurrent validity
of the MMPI-PD scales when the MCMI-PD scales
were used as the criterion measures. The Schizoid, Avoidant, Dependent, Histrionic, and Narcissistic scales achieved significant correlation. Overall, the study supports the limited validity and diagnostic
utility of the MMPI-PD scales— Schuler, Snibbe, &
obstacle when evaluating its validity. Widiger, Costa and Samuel (2006) argue that the PDI-IV’s strength lies within its manual and compared the PDI-IV’s manual to manuals of other semi-structured interviews. Most are lacking normative data, statistical evidence for reliability and validity, and practical guidance, issues covered in the PDI-IV’s manual.
The International Personality Disorder Examination (IPDE; Loranger, 1999) is a structured interview that is able to assess PDs across both the DSM-IV and ICD-10. The IPDE scores individuals dimensionally (“negative”, “probable” and “definite”) (Rogers, 2001). It demonstrates excellent inter-rater reliabilities (.81 to .92; Lenzen-weger, 1999). The IPDE’s strengths are that it can assess PDNOS, providing that the individual has scored on at least 10 different PD criteria, and has internationally validity as it was developed alongside the WHO. It is used in the Longitudinal Study of Personality Disorders (LSPD).
The International Personality Disorder Examination Questionnaire (IPDEQ, Loranger, 1999)is a screening tool to be used alongside the IPDE. Consisting of 99 items, it assesses PDs across six scales that represent eve-ryday functioning (work, self, interpersonal relationships, affect, reality testing and impulse control). Loranger suggests that if an individual scores highly on at least three of the scales, then the IPDE should be subsequently used. Slade, Peters, Schneiden and Andrews (2006) found the IPDEQ to accurately predict anti-social PD, and Lewin, Slade, Andrews, Carr and Hornabrook (2005) found that the IPDEQ’s scores were not only psychometr-ically sound, but also provided a good index for the likelihood of developing a PD in an epidemiological study, therefore suggesting its use outside of clinical environments. Fountoulakis et al. (2002) compared IPDEQ scores with the PD diagnoses, and found that the onset of specific PDs had strong phi coefficients > .91, suggesting good reliability.
The Iowa Personality Disorder Screen (IPDS; Langbehn et al., 1999) is an 11 item semi-structured interview which is essentially a screening instrument measuring DSM-III PDs. The interview only lasts around five mi-nutes. The original authors found sensitivity validities being as high as 92% and specificity validities as high as 72%—a finding further supported by Trull and Amdur (2001) in a non-clinical population. Olssøn, Sørebø, and Dahl (2011) also found that within psychiatric outpatients, the 11 items held an average internal consistency of .70, with positive prediction power averaging at .66 and correctly classifying PDs in comparison to the SCID-II on average at 64%. Similarly to the Personality Beliefs Questionnaire (PBQ-SF; Beck & Beck, 1991; see further in this paper), the IPDS stands up well against other instruments due to its extreme brevity and good statistical properties.
The Shedler-Westen Assessment Procedure 200(SWAP-200). There are various versions of this measure in-cluding the SWAP-II and SWAP-II-A (Westen & Shedler, 2007), an adolescent version. Clinically experienced interviewers are required to sort the 200 personality descriptive items into 8 categories from most descriptive to not descriptive or irrelevant. A computer program then reports DSM-IV PD diagnoses, personality diagnoses for alternative, empirically derived personality syndromes, and dimensional trait scores. Westen and Shedler (2007) provide both reliability and validity evidence of both versions of the test.
3.2. Questionnaires (See Table 3)
The Personality Diagnostic Questionnaire-4 (PDQ-4, Hyler, 1994) consists of 99 items, that measure all 10 of the DSM-IV PDs.Okada and Oltmanns (2009) found acceptable test-retest validities over different three time periods, with an average of .67. Abdin et al. (2011) investigated the PDQ-4’s efficacy of being used as a screen-ing instrument for mentally ill inmates, by comparscreen-ing its validity with the SCID-II. Generally there was mod-erate agreement between the two instruments with Kappa levels no lower than .50. They did find that the PDQ-4 held high sensitivity (the probability of the likelihood of being diagnosed with a PD across both instruments) and low specificity (the likelihood that both instruments detect an absence of PD). When looking at specific PDs, sensitivities ranged from poor (dependent PD; .30) to good (antisocial PD; .78). Abdin et al. (2011) who used a translation in Singapore concluded that the PDQ-4 is statistically robust enough to be used as a screening in-strument.
Table 3. A review of measures that attempt to measure specific disorders.
Disorder Name of Test Author Items Scales Reliability Validity
B o rderline Zanarini Rating Scale For Borderline Personality Disorder (ZAN-BPD) Zanarini (2003). 10 1) Affective 2) Cognitive 3) Impulsive 4) Interpersonal
Internal consistency of the ZAN-BPD was found to be high (Cronbach’s α = .85)—Zanarini,
2003.
The convergent validity of the ZAN-BPD with the scales of the
SCL-90, both of which assess symptoms in the past week, is high
(p < .001). This is particularly so for the overall borderline psychopathology scores and the
scores pertaining to affective symptomatology—Zanarini, 2003.
The Revised Diagnostic Interview for Borderlines (DIB-R). Zanarini, Gunderson, Frankenburg, & Chauncey, 1989 - 1) Affect 2) Cognition 3) Impulse action patterns 4) Interpersonal relationships
Excellent kappas were found in each of the three inter-rater reliability substudies for
the vast majority of borderline symptoms assessed
by the DIB-R. More specifically, one-third of the BPD symptoms assessed had a kappa in the excellent range and
the remaining two-thirds had a kappa in the fair-good range (.57-.73). More specifically, all five dimensional measures of borderline psychopathology had intraclass correlation coefficients in the excellent range
for all four reliability substudies. Taken together, the results of this study suggest that both the
borderline diagnosis and the symptoms of BPD can be diagnosed reliably when using the DIB-R—Zanarini,
Frankenburg, & Vujanovic, 2002.
The McLean Screening Instrument for Borderline Personality Disorder (MSI-BPD) Zanarini, Vujanovic, Parachini, Boulanger, Frances, Frankenburg, & Hennen (2003) 10
Test-retest reliability of the MSI-BPD was found to be good.
More specifically, a highly significant correlation was
found between the number of items endorsed at Time 1 and Time 2 (Spearman’s rho = .72, p < .0001)
(based on the total ranks from the two administrations of the scale—
Zanarini et al., 2003.
DSM-IV-TR BPD criteria set as measured by the MSI-BPD demonstrated good concurrent validity—Leung & Leung, 2009. The MSI-BPD demonstrated adequate criterion validity with
the diagnosis of BPD derived from a clinician-administered diagnostic interview—Patel,
Sharp & Fonagy, 2011.
Borderline Personality Disorder Beliefs Scale Butler, Brown, Beck, & Grisham, (2002) 14 1) Dependent 2) Paranoid 3) Avoidant 4) Histrionic Themes of dependency, helplessness, distrust, fears of rejection/ abandonment/ losing emotional control, and extreme attention-seeking behaviour.
The internal reliability of the 14 items for the 84 BPD patients was
moderately high (alpha = .89)— Butler, Brown, Beck, & Grisham,
2002.
The BPD beliefs scale diagnostic validity among 288 study patients.
Continued Borderline Personality Questionnaire (BPQ). Poreh, Rawlings, Claridge, Freeman, Faulkner, & Shelton, (2006). 80 1) Impulsivity 2) Affective Instability. 3) Abandonment 4) Relationships 5) Self-Image 6) Suicide/ Self-Mutilation 7) Emptiness 8) Intense Anger 9) Quasi-Psychotic States.
The full BPQ is a highly reliable test. Subscale reliabilities are generally satisfactory for scales of
this length, though with a few exceptions, particularly Quasi-Psychotic States. Several of the subscales show high positive skew, noting that the standard error of skew for the three samples was respectively .18, .16, and .20. No transformations were performed, and the skewness of the data should
be taken into account when considering the parametric statistics
reported in subsequent analyses— Poreh, Rawlings, Claridge, Freeman, Faulkner, & Shelton.
(2006).
Discriminant validity was examined in Sample 2.
Pearson correlations were calculated between the
BPQ sum score and the total scores on both the MMPI-2 STY subscale
(r = .48) and the SPQ (r = .45). While both coefficients were highly significant, their moderate
size suggests satisfactory discriminant validity for the BPQ. Convergent
validity was examined by correlating the BPQ with the MMPI-2 BPD in Sample 2, yielding a
high correlation of .85. The BPQ was correlated with the STB in Samples 3 and 4, yielding coefficients of
.72 and .78 respectively. These results suggest high convergent validity for the BPQ—Poreh, Rawlings, Claridge, Freeman, Faulkner, & Shelton (2006).
Borderline Evaluation of Severity Over Time (BEST) Pfohl, Blum, John, McCormick, Allen, & Black (2009).
15
1) Subscale A (8 items) addresses problematic thoughts and feelings that are characteristic of BPD (i.e., suicidal thoughts). 2) Subscale B (4 items) addresses problematic or negative behaviours (i.e., problems with impulsive behaviour). Items on these subscales are rated from 1 to 5, with 5 = extreme distress, and 1 = no distress caused by this symptom. 3) Subscale C, consists of three items that assess the use of positive behaviours learned in therapy (i.e., following through
with therapy plans). These items are rated based on frequency over the course of a week.
Test-retest reliability: Correlation between baseline and screening BEST total scores was moderate
(r= .62, n = 130, p < .001). The results indicate that the instrument has good test-retest reliability. Internal consistency is excellent, as shown by the moderate to high Cronbach’s α coefficients across study visits, which argues strongly for construct validity— Pfohl, Blum, John, McCormick,
Allen, & Black (2009).
The BEST exhibits face validity by assessing thoughts and behaviours typical of BPD. Evidence for content validity has been indirectly established
because the items are derived from the DSM-IV. At the screening visit, the BEST
correlated strongly with the ZAN-BPD score, SCL-90-R total score, the SAS total score, the CGI
severity score, and both the GAS and BDI scores—Pfohl, Blum, John, McCormick, Allen, & Black
Continued Five Factor Borderline Inventory (FFBI) Mullins- Sweatt, Edmundson, Sauer- Zavala, Lynam, Miller, & Widiger (2012) 1) Anxious Uncertainty 2) Dysregulated Anger 3) Despondence 4) Self-Disturbance 5) Behaviour Dysregulation 6) Affective Dysregulation 7) Fragility 8) Dissociative Tendencies 9) Distrustfulness 10) Manipulativeness 11) Oppositional 12) Rashness
The FFBI subscales were shown to have good internal consistency—
Mullins-Sweat, Edmundson, Sauer-Zavala, Lynam, Miller, &
Widiger (2012)
The FFBI subscales were shown to have good convergent, discriminant, and incremental
validity—Mullins-Sweat, Edmundson, Sauer-Zavala, Lynam, Miller, & Widiger (2012)
P a ra no id Paranoid Personality Disorder Features Questionnaire.
Useda, 2002 23
1) Mistrust/ suspiciousness 2) Antagonism 3) Introversion 4) Hypersensitivity 5) Hypervigilance 6) Rigidity
The test-retest reliability of the six PPDFQ scores over a 6-week
interval was good, and the hypothesised relationships between
the PPDFQ subscales and the five-factor model of personality as
well as Livesley’s dimensional model of personality pathology were supported—Bernstein &
Useda, 2007. Av o ida nt UNABLE TO FIND Schizo id Interpersonal Measure of Schizoid Personality Disorder (IM-SZ) Kosson, Blackburn, Byrnes, Park, Logan, & Donnelly (2008) 12
Internal consistency estimates were high, with coefficient alpha equal to .88. Corrected item-to-total correlations ranged from .40 to .74,
and a mean interitem correlation of .41 suggests homogeneity for the IM-SZ. Interrater agreement was
estimated with an average, one-way random effects ICC, based on 123
cases in which interviewer and observer ratings were available,
and was acceptable, r = .69, indicating that the traits measured are relatively robust across raters.
Individual item ICCs were somewhat lower; the mean item ICC was .53—Kosson, Blackburn, Byrnes, Park, Logan, & Donnelly,
2008.
Results provide preliminary indications that the measure of
SZPD correlates with other measures in specific ways that
suggest preliminary construct validity. Scores on the IM-SZ appear independent of age, education, and SES yet correlated
negatively with IQ. Similarly, IM-SZ scores were generally independent of criminal activity yet correlated in predicted ways with ratings on several components
of psychopathy—Kosson, Blackburn, Byrnes, Park, Logan, & Donnelly, 2008.
Continued Na rcis sis tic Narcissistic Personality Inventory-16 (NPI-16) Ames, Rose, & Anderson (2006). 16 1) Narcissism- consistent 2) Narcissism- inconsistent.
α = .72; mean inter-item correlation =.13—Ames, Rose, & Anderson
(2006).
Divergent validity: Narcissism was not significantly correlated with
dispositionism. Convergent validity: Men scored higher in narcissism than women.
Predictive validity: Narcissi was significantly and positively correlated with participants’ estimates of their own relative performance in a judgment task—
Ames, Rose, & Anderson (2006).
Narcissistic Personality Inventory-40
(NPI-40).
Raskin & Terry (1988) 40
1) Authority 2) Exhibitionism 3) Superiority 4) Entitlement 5) Exploitativeness 6) Self-sufficiency 7) Vanity.
In Raskin & Terry (1988), alpha composite reliability scores
of .83, .74, .80, and .90 were calculated.
Construct validity: In order to investigate the validity of the seven NPI component scales, we
correlated them with the IPAR criterion variables. In the observer
domain, five of the seven component scales showed significant positive correlations
with the Trait Ranking for Narcissism. These correlations were Authority (r = .44, p < .001),
Exhibitionism (r = .42, p < .001), Self- Sufficiency (r = .34, p < .01), Exploitativeness (r = .28, p < .05), and Superiority (r = .24, p < .05)
—Raskin & Terry (1988).
Narcissistic Personality Inventory Raskin & Hall, 1979 54 (each item being a pair of statem ents) 1) Leadership/ Authority (LA) 2) Superiority/ Arrogance (SA) 3) Self-Absorption /Self-Admiration (SS) 4) Exploitiveness /Entitlement (EE)
The reliability and validity of the NPI has been established in clinical
(e.g., Priftera & Ryan, 1984) and non-clinical samples (Emmons,
1984; Raskin & Hall, 1981).
The Margolis- Thomas Measure of Narcissism (M-T) Margolis & Thomas, 1980 60 paired statem ents
Validity evidence includes the successful differentiation between narcissistic and normal adolescents
(t = 3.93; p < .001)—Mullins & Kopelman (1988). The Margolis- Thomas Measure of Narcissism Short Verson Mullins & Kopelman, 1988) 24
An acceptable level of reliability (.69) was obtained using the abbreviated scale—Mullins &
Kopelman (1988). The Narcissistic Personality Disorder Scale (NPDS) Ashby, Lee, & Duke, 1979 19- item true- false scale
Ashby (1978) reported an alpha coefficient of reliability of .81.
Solomon (1982)—confirms the validity of the MMPI and are consistent with O. Kernberg’s
(1976) emphasis on the impoverishment of object relations
in the dynamics of narcissistic personalities and with H. Kohut’s (1971, 1976) view of nightmares as
a reflection of self-feeling, self-state, or level of narcissistic
Continued
Murray’s Narcisism
Scale
Murray, 1938 20
Cheek and Melchior (1985) found the alpha reliability
of this scale to be .76.
The Hypersensitive
Narcissism Scale (HSNS).
Hendin, & Cheek (1997) 10
Cronbach’s alpha for the HSNS was .82—Arble, 2008. The reported reliability of the HSNS
was Covert Narcissism good, with alpha coefficients ranging from .72 to .76. Furthermore, the HSNS, the Narcissism-Hypersensitivity Scale,
and the NPDS demonstrated significant positive correlations with
each other (r= .50) and negative correlations (r= −.18) with the NPI
(Raskin & Hall, 1979).
The HSNS was found to have a strong negative correlation with
the RSES, a measure of self-esteem. Conversely, the HSNS was found to have a strong
positive correlation with the measure of social inhibition FNE,
a measure of shame (PFQ2), and a measure of masochism (SDPS).The HSNS also produced
a moderate positive correlation with the Social Incompetence
scale and a slight positive correlation with the Egocentricity
scale. Thus, elevations on HSNS seemed indicative of a wide range of object related distur
bances—Arble, 2008.
Pathological Narcissism Inventory (PNI) Pincus, Ansell, Pimentel, Cain, Wright, & Levy (2009) 52
1) Entitlement Rage 2) Exploitativeness 3) Grandiose Fantasy 4) Self-sacrificing self-enhancement 5) Contingent self-esteem 6) Hiding the self 7) Devaluing
-
Comparing correlational patterns for the PNI and NPI, we conclude
preliminary evidence exists to support the construct validity of the PNI as a measure of
pathological narcissism. Results for the PNI provide
additional evidence for its construct validity. Several PNI
scales assess grandiose characteristics reflecting, in part, a range of vindictive, domineering, intrusive, and overly-nurturant interpersonal problems. Several PNI scales assess vulnerable characteristics reflecting, in part, cold, avoidant, and exploitable
interpersonal problems. We conclude that the associations
between the PNI and IIP-C contribute evidence in support of
the PNI’s construct validity— Pincus et al., 2009.
Ant is o cia l Antisocial Personality Questionnaire Blackburn & Fawcett (1999). 125 1) Self-Control, 2) Self-Esteem, 3) Avoidance, 4) Paranoid Suspicion, 5) Resentment, 6) Aggression, 7) Deviance, 8)Extraversion
Coefficient alpha ranges from .77 to .87 for the total sample, from .79
to .88 for patients, and from .75 to .84 for normals, suggesting satisfactory internal consistencies for
all scales—Blackburn & Fawcett, 1999.
The APQ scales clearly differentiate the mentally disordered offender and normal
groups, but also discriminate within the offender sample. AMANOVA reveals a highly significant overall difference between the MI, PD and normal groups (Rao’s R (16, 712) = 15.45,
p < .0001), and univariate ANOVAs indicate significant effects for all scales (Blackburn
& Fawcett, 1999).
Psychopathy Checklist
(PCL)
Continued Hare Psychopathy Checklist- Revised (PCL-R)
Hare (1991) 20
Factors; 1) Callous/ manipulative interpersonal style 2) Antisocial action
- Harpur, Hare & Hakstian, 1989.
To assess inter-rater reliability, intra-class correlation coefficients (ICCs; Shrout & Fleiss, 1979) were
calculated for subsamples of subjects rated by more than one rat er (seesample descriptions for №). They ranged from .78 to .94 (M
=.86) for a single rating and from .87 to .97 (M =.93) for the average of two ratings (computations based on the Spearman-Brown Prophecy Formula).2 Internal consistency
was assessed by Cronbach’s coefficient alpha, which ranged from .85 to .89 (M = .88), and by the
mean inter-item correlation, which ranged from .23 to .30 (M = .27).
These results indicate that the PCL-R, like the PCL, Can be considered a homogeneous, uni- dimensional scale (Harpur et al., 1989)—Hare, Harpur, Hakstian,
Forth, Hart, & Newman, 1990.
The associations found between the convergent validity measures and the PCL–R when it was used dimensionally support the validity
of the instrument. As predicted, on-Psychoticism, SRPS, SMAST, MPQ-Constraint, and SO scale scores were significantly related
to PCL–R scores. Overall, the pattern of results for both the Caucasian and African American
women provided support for the convergent validity of the PCL–R
in this sample—Vitale, Smith, Brinkley, & Newman, 2002.
Levenson’s self-report psychopathy scale (SRPS) Levenson, Kiehl, & Fitzpatrick (1995). 26 1. Primary psychopathy 2. Secondary psychopathy
Cronbach’s alphas for the total sample were .85 for the total SRPS, .83 for SRPS factor 1 and .69 for SRPS factor 2—Brinkley, Schmitt, Smith, & Newman, 2000.
The SRPS and the PCL-R were significantly correlated and both showed similar patterns of correlations to measures of substance abuse and criminal versatility. SRPS was predictive
of performance of a passive avoidance task—Brinkley, Schmitt, Smith, & Newman, 2000.
Psychopathic Personality Inventory Revised (PPI-R) Lilienfeld & Widows, (2005).
Internal consistency is adequate for the PPI-R Total score and the PPI-R Content scale scores, with
coefficient alpha ranging from .78 - .92 for the community/college
sample. For the offender sample, internal consistency estimates for the Total and Content scale scores ranged from .72 - .84—Lilienfeld
& Widows, 2005
Evidence of construct validity was obtained via significant correlations between the PPI-R
and self-report measures of pathological and nonpathological personality functioning, DSM-IV Antisocial Personality Disorder,
interpersonal problems, sensation-seeking, substance use,
and offense variables— Lilienfeld & Widows, 2005
The Elemental Psychopathy Assessment Lynam, Gaughan, Miller, Miller, Mullins- Sweatt, & Widiger (2011) 299 Antagonism: 1) Distrust 2) Manipulation 3) Self-centeredness 4) Opposition 5) Arrogance 6) Callousness Conscientiousness : 1) Disobliged 2) Impersistence 3) Rashness Extraversion: 1) Coldness 2) Dominance 3) Thrill-Seeking Neuroticism: 1) Unconcern 2) Anger 3) Self-Contentment 4) Self-Assurance 5) Urgency 6) Invulnerablility
Final scales were fairly reliable. Seventeen of the 18 scales had alpha coefficients above .7; 14 of these were above .8. The average alpha for the 18 scales was .81. The scales were also fairly homogeneous.
Average interitem correlations ranged from .16 for Arrogance to .48 for Dominance, with an average of .34. Average item-total
correlations ranged from .31 for Arrogance to .62 for Thrill-Seeking,
with an average of .51.
Concurrent validity was shown by correlations with other self-report psychopathy measures;
SRP, LSRP, PPI-R. The measure contains two validity scales: Infrequency scale, and a Too Good to Be True scale. It has
Continued
Invenotry of Callous- Unemotonal
Traits
Frick (2004) 24
Careless Callous Unemotional
Uncaring
The coefficient alpha = .81 (Kimonis, Frick, Skeem, Marsee, Cruise, Munoz, Aucoin, & Morris,
2008b)
Evidence of concurrent validity is given by significant positive correlations with external criteria: positive correlations with
proactive and reactive aggression, violent and non-violent delinquency and sex offenders. It is negatively correlated
with empathy and positive affect.
H is trio nic Schizo ty pa l Referential Thinking Scale (REF) Lenzenweger, Bennett, & Lilenfield (1997). 34
The REF displayed good internal consistency (α = .86) for the total sample—Lenzenweger,
Bennett, & Lilenfield (1997).
High scores on the REF are associated with elevated scores on measures of perceptual aberration, magical ideation,
and schizophrenia-related psychometric deviance, all measures known to be related
to schizotypy, which is suggestive of convergent validity—Lenzenweger,
Bennett, & Lilenfield (1997).
Schizotypal Personality Questionnaire
(SPQ)
Raine (1991) 74
1) Ideas of reference 2) Excessive social anxiety.
3) Odd beliefs or magical thinking. 4) Unusual perceptual experiences. 5) Odd or eccentric behaviour. 6) No close friends. 7) Odd speech. 8) Constricted affect. 9) Suspiciousness.
High internal reliability (.91), test-retest reliability (.82) —Raine (1991).
High convergent validity (.59 to .81), discriminative validity (.63) and criterion
validity (.68)—Raine (1991).
Schizotypal Personality Questionnaire- Brief (SPQ-B) Raine & Benishay (1995). 22 1) Interpersonal Deficits 2) Cognitive-Perceptual Deficits 3) Disorganisation.
In the present sample, the KR-20 internal consistency
reliability coefficient for the full SPQ-B was .83 (.82 in biological relatives and .83 in non-psychiatric comparison participants) —Compton, Chien,
Bollini, 2007.
Correlations between SPQ-B total and subscale scores and the derived SCID-II SPD criteria scores were examined next in a subsample of participants for whom SCID-II data were available (from the first study; n = 58). The SPQ-B total score was significantly correlated with the SCID-II SPD criteria total score (p = .49, pb.001). —Compton, Chien, & Bollini, 2007.
Continued Short forms of Wisconsin Schizotypy Scale Winterstein, Silvia, Kwapil, Kaufman, Reiter- Palmon, & Wigert, (2011). 60
1) The magical ideation scale. 2) Perceptual aberration scale. 3. Revised social anhedonia scale. 4) Physical anhedonia scale.
The short forms had higher alpha values than would be
predicted by the Spearman-Brown formula,
which suggests that they retained the relatively more
effective items from full scales—Winterstein, Silvia, Kwapil, Kaufman, Reiter-Palmon & Wigert,
2011.
The positive and negative symptom dimensions correlated modestly (r = .13)—Winterstein,
Silvia, Kwapil, Kaufman, Reiter-Palmon & Wigert, 2011.
Oxford- Liverpool Inventory of Feelings and Experiences (O-LIFE) Mason, Claridge, & Jackson (1995) 1) Unusual experiences 2) Cognitive disorganisation 3) Introvertive anhedonia 4) Impulsive non-conformity
All scales have highly adequate internal consistency
as assessed by coefficient alpha. Scale 1, α = .89
2, α = .87 3, α = .82 4, α = .77 Mason, Claridge, &
Jackson (1995) O bs es siv e-Co m puls iv e Obsessive- Compulsive Inventory Short Version (OCI-R) Foa, Huppert, Leiberg, Kichic, Hajcak, & Salkovskis, (2002). 18 1) Washing 2)Checking 3) Ordering 4) Obsessing 5) Hoarding 6) Neutralising Test-retest reliability: Spearmans correlations- Patients
diagnosed with OCD ranged from .74 to .91. Nonanxious controls ranged from .57 to .87—
Reid, Rosen, Arnold, Larson, Mason, Murphy, Storch, 2011.
Results indicate that the OCI-R is a psychometrically sound and
valid measure of OCD and its various symptom presentations.
The instrument also evidenced good convergent validity, and performed well in discriminating OCD from other anxiety disorders The OCI-R is recommended as an empirically validated instrument
that can be used in a range of clinical and research settings for research on OCD—Abramowitz
& Deacon, 2006.
Obsessive- Compulsive Inventory (OCI) Foa, Kozak, Salkovskis, Coles, & Amir (1998). 42 1) Washing 2) Checking 3) Doubting 4) Ordering 5) Obsessing 6) Hoarding 7) Mental Neutralising
Test-retest reliability for the controls, distress (OCD, r = .87; controls, r = .89) and frequency (OCD, r = .84; controls, r = .90
total scores.
The test-retest reliability for the subscales exceeded .80, with the exception of Ordering distress (r = .77) and Ordering frequency
scores (r = .79) in the OCD sample and the Doubting distress
(r = .77) and Hoarding distress (r = .68) scores in the control
sample—Foa, Kozak, Salkovskis, Coles, Amir, 1998.
Discriminative validity: Comparisons of means for the total distress score revealed that
the OCD group reported greater distress on the OCI than did the other 3 groups. Comparisons of means revealed that the OCD group reported more frequent OCD
symptoms than did the remaining 3 groups on all but the
Hoarding subscale. Convergent validity: The
validity of the OCI total distress and frequency scales
was assessed by correlating (Pearsons correlations) the OCI
scores of the OCD patients with scores obtained on other measures of OCD symptoms: Y-BOCS, CAC, MOCI. For the OCD sample,
the coefficients were quite high, ranging from .41 to
Continued Obsessive Beliefs Questionnaire (OBQ) Steketee & Frost, (2001) 87
1) Overestimation of threat. 2) Tolerance of uncertainty. 3) Importance of thoughts.
4) Control of thoughts. 5) Responsibility. 6) Perfectionism.
Cronbachs alpha for those with OCD and control samples were
between .80 and .96— Obsessive Compulsive Cognitions
Working Group, 2001.
The multivariate effect was significant, Wilks’ Lambda =
.039, F(30, 1806) = 75.28,
p < .05. Univariate analyses were then conducted for each subscale. All of these one-way ANOVAs were also significant.
Follow up Student-Newman-Keuls tests showed that the OCD group scored significantly higher than the other four groups in all cases with
one exception: OCDs did not score higher than anxious controls on Perfectionism. Student controls scored higher than all community controls on Overestimation of Threat, and higher than Greek
community controls on Responsibility. These results support the known groups validity
of the scales by distinguishing people who have OCD from those
who do not—Sica, Coradeschi, Sanavio, Dorz, Manchisi &
Novara (2004). The Vancouver Obsessional- Compulsive Inventory (VOCI) Thordarson, Radomsky, Rachman, Shafran, Sawchuk & Hakstian, 2004. 55 1. Contamination 2. Checking 3. Obsessions 4. Hoarding 5. Just Right 6. Indecisiveness
Scores of the VOCI and its subscales demonstrated
acceptable to excellent internal consistency
(.81 ≤ α ≤ .95) —Gönner, Ecker, Leonhart, &
Limbacher 2010b. The VOCI and its subscales appear to have excellent test-retest reliability in the OCD sample, with all coefficients .9 or above, and with the one-sided
.95 confidence interval >.81 in all cases, despite,
on average, a long test-retest interval. For the students, on the other hand,
test-retest reliability is poor, ranging from .5 to .6. In the
student sample, these low correlations may be due to range restriction. Most of the students had mean VOCI item scores between 0 and 1, with
the exception of four participants, who appeared
to be bivariate outliers. Excluding the four outliers improved the test-retest correlations for some scales (e.g., VOCI total,
r = .62, p < .001), but not others (e.g., VOCI Checking, r = .44). —Thordarson, Radomsky,
Rachman, Shafran, Sawchuk & Hakstian, 2004.
The OCD group scored significantly higher than the other
groups on the VOCI total score, Contamination, Checking, Just
Right, and Indecisiveness subscales. The OCD group scored significantly higher than the non-clinical controls but not the
A/D control group on the Obsessions and Hoarding subscales—Thordarson, Radomsky, Rachman, Shafran,
Sawchuk & Hakstian, 2004. Convergent and discriminant validity: OCD sample—Total score
highly correlated with other multidimensional self-report measures of OCD and moderately
correlated with measures of anxiety, depression and worry.
Convergent and discriminant validity were excellent for the Contamination and Checking subscales, but weaker for Obsessions. Discriminant validity
of Hoarding was excellent, while its convergent validity was not
Continued Vancouver Obsessional- Compulsive Inventory Revised (VOCI-R) Gonner, Ecker, Leonhart, & Limbacher, (2010). 30 1). Contamination 2) Checking 3) Obsessions a) Immoral b) Harming 4) Hoarding 5) Symmetry and Ordering
Scores of the 30-item total scale and of all symptom subscales showed good to excellent internal
consistency (.82 ≤ α ≤ .95)— Gönner, Ecker, Leonhart &
Limbacher, 2010.
Convergent validity: Scores of the total scale and the five symptom subscales demonstrated excellent convergent validity. All VOCI-R subscales showed moderate to high correlations with the OCI-R total scale (rs-range = .47 - .57) and with the PI-PR total scale (rs-range
= .43 - .55). Discriminant validity: of the VOCI-R total scale (rs-range = .34-.39) and the five symptom scales with measures of depression,
anxiety and worries (rs-range = .07-.31) indicate only a low to
moderate construct overlap— Gönner, Ecker, Leonhart, &
Limbacher 2010 Maudsley Obsessional- Compulsive Inventory (MOCI) Hodgson & Rachman, (1977). 30 1) Washing 2) Checking 3) Slowness 4) Doubting
Test-retest reliability, 50 participants, completing the questionnaire one month apart (r = .80)—Hodgson & Rachman,
(1977).
For 30 obsessionals, we had Leyton Inventory Scores (Cooper, 1970) and found that our “total obsessionality” score correlated significantly with the
Leyton Symptom Score (.6)—Hodgson & Rachman,
(1977). Padua- Inventory- Palatine Revision (PI-PR) Gönner, Ecker & Leonhart, (2010). 24 1) Contamination/ Washing 2) Checking 3) Numbers
4) Dressing/ Grooming 5)Rumination 6) Harming Obsessions/ Impulses
The total scale and all subscales had acceptable to excellent internal consistency (.78 ≤ α ≤ .93)
Acceptable corrected item-total correlations (r > .40) were found for the PI-R (with one exception: Rumination subscale, Item 121)—
Gönner, Ecker & Leonhart, 2010
In the OCD sample the PI-PR and its subscales demonstrated good to excellent convergent validity with corresponding OCI-R scales. On the whole, the PI-PR and its
subscales demonstrated very satisfying divergent validity with measures of depression, anxiety, and worries in the OCD sample, except for PI-PR Rumination and
PI-PR Harming Impulses and Obsessions.
In the anxiety disorder sample, the PI-PR and its subscales demonstrated good to excellent
convergent validity with corresponding OCD scales— Gönner, Ecker & Leonhart, 2010
Padua Inventory (PI)
Sanavio (1988) 60
1) Impaired Mental Control 2) Contamination 3) Checking Behaviour 4) Loss of Control of Actions (factors)
The α coefficient was .90 in male and .94 in female participants—Coles (2003). Test-retest correlations were 0.78
for males, and .83 for females who filled out the inventory twice
at a 30-day interval—Sanavio (1988).
When assessing the convergent and divergent validity of the PI substantial correlations were found between related scales of
the PI and the MOCI. The substantial correlation between
the total PI scores and the two subscales of the SCL-90-R,
Sensitivity and Hostility, are in line with the findings reported in Millar (1983)
—van Oppen (1992).
Leyton Obsessional
Inventory
Cooper (1970) 69
1) Resistance Scale. 2) Inference Scale.
The Leyton Obsessional Inventory (LOI) is a card-sort task that has shown good reliability and validity
estimates (Cooper, 1970; Taylor, 1995)
“Within the limits imposed by these selected criterion groups, this
inventory is valid, since it differentiates between the obsessional patients and the normals with very little overlap”
Continued Yale-Brown Obsessive Compulsive Scale Goodman, Price, Rasmussen, Mazure, Fleischmann, Hill, Heninger & Charney (1989). 10
1) Severity of obsessions. 2) Severity of compulsions.
Inter-rater reliability estimated to be excellent (obsessions subtotal, r
= .97; compulsions subtotal, r = .96; total score, r = .98)—Foa, Kozak, Salkovskis, Coles, Amir
(1998).
The total Yale-Brown Scale score was significantly correlated with two of three independent measures
of obsessive-compulsive disorder and weakly correlated with measures of depression and of
anxiety in patients with obsessive-compulsive disorder with minimal secondary depressive
symptoms. Results from a previously reported placebo-controlled trial of fluvoxamine in 42 patients with
obsessive-compulsive disorder showed that the Yale-Brown Scale
was sensitive to drug-induced changes, and that reductions in Yale-Brown Scale scores specifically reflected improvement
in obsessive-compulsive disorder symptoms. Together, these studies
indicate that the 10-item Yale-Brown Scale is a reliable and valid instrument for assessing obsessive-compulsive disorder symptom severity, and that it is suitable as an outcome measure in drug trials of obsessive-compulsive
disorder—Goodman, Price, Rasmussen, Mazure, Fleischmann,
Hill, Heninger & Charney (1989).
Obsessive Compulsive Thoughts Checklist (OCTC) Bouvard, Mollard, Cottraux, Guerin, (1989) 28 1) Checking 2) Responsibility 3) Washing
The Cronbach coefficient of internal consistency was computed
for the 28 items for each group separately. Reliability was satisfactory (OCD patients = .88;
agoraphobic patients = .84 and control subjects = .89). Then the Cronbach coefficient of internal consistency was computed for
each factor
subscale across the three groups: - checking subscale (10 items): OCD patients = .87; agoraphobic patients = .88 and control subjects
= .79.
- responsibility subscale (11 items):
OCD patients = .84; agoraphobic patients = .83 and control subjects
= .68.
- washing subscale (7 items): OCD patients = .87; agoraphobic
patients = .81 and control subjects
= .59—
Bouvard, Cottraux, Mollard, Arthus, Lachance, Guerin,
Sauteraud & Yao (1997).
Spearman rank correlations were used to compute convergent validity in a sub-group of obsessive
compulsive patients (r - 96). The Obsessive Compulsive Thoughts Checklist correlated positively
with the Compulsive Activity Checklist (rho - .62; p < .0001). The total score was also positively correlated with the Yale-Brown Obsessive Compulsive Scale (YBOCS total scale: rho - .42; p < .0001; YBOCS obsession scale: rho - .40; p < .0001; YBOCS
compulsion scale: rho .37; p = .0002). The factor structure was studied both on the sample which included agoraphobic patients and controls (n - 141) and on the obsessive compulsive patients only
(n = 122). In both analyses, three identical factors were found:
- factor 1: checking/ perfectionism-orderliness - factor 2: responsibility/dread of
harming others - factor 3: washing/contamination.
Results support the validity and the internal consistency of the Obsessive Compulsive Thoughts
Checklist—Bouvard, Cottraux, Mollard, Arthus, Lachance, Guerin,
Continued Five Factor Obsessive- Compulsive Inventory (FFOCI) Samuel, Riddell, Lynam, Miller, & Widiger (2012) 1) Perfectionism 2) Fastidiousness 3) Punctiliousness 4) Workaholism 5) Doggedness 6) Ruminative Deliberation 7) Detached Coldness 8) Risk Aversion 9) Constricted 10) Inflexibility 11) Dogmatism 12) Excessive Worry
The 12 scales demonstrated convergent correlations with established measures
of OCPD and the FFM—Samuel, Riddell,
Lynam, Miller, & Widger, 2012.
The 12 scales obtained strong discriminant validity with respect
to facets from other five factor model domains and OCPD for predicting a composite measure
of obsessive-compulsive symptomatology—Samuel,
Riddell, Lynam, Miller, & Widger, 2012. Dependen t Dependent Personality Questionnaire (DPQ) Tyrer, Morgan, & Cicchetti (2004). 8
The DPQ was also a good predictor of the diagnosis of dependent personality disorder,
with sensitivity, specificity, predicted positive, and predicted
negative accuracies of 87%. —Tyrer, Morgan, & Cicchetti
(2004).
Dependent Personality Inventory (DPI)
Huber (2005) 55
1) Difficulty making everyday decisions. 2) Needs others to assume responsibility for most major areas of life. 3) Has difficulty expressing disagreement with others because of fear of loss or support from others. 4) Has difficulty initiating projects or doing things on own because of lack of self-confidence in judgment or abilities rather than a lack of motivation or energy. 5) Goes to excessive lengths to obtain nurturance and support from others to the point of volunteering to do things that are unpleasant. 6) Feels uncomfortable or helpless alone because of exaggerated fears of being unable to care for self. 7) Urgently seeks another relationship as a source of care and support when a close relationship ends. 8) Is unrealistically preoccupied with fears of being left to take care of self.
The internal consistency of the revised Dependent Personality Inventory (DPI-R) to .90, making the test highly reliable.
—Huber (2005).
Construct validity is satisfactory for the DPI as our results support the
findings of previous studies that suggest two distinct constructs form
dependent personality disorder —Gude, Hoffart, Hedley & Ro,
2004. Minnesota Multiphasic Personality Inventory-2 Social Introver-sion Subscales (MMPI-2 Si1, 2, 3) Ben-Porath, Hostetler, Butcher, & Graham, 1989 38 Shyness/Self Consciousness (Si 1), Social Avoidance (Si 2),
and Self/Other Alienation (Si 3).
Respective reliabilities for Si1, Si2, and Si3
of .82, .77, and .77 for college men and .82,
.75, and .77 for college women—Ben-Porath