Munich Personal RePEc Archive
Structural Change and Catching Up:
Experience of the Ten Candidate
Countries
Gács, János
International Institute for Applied Systems Analysis
April 2002
Online at
https://mpra.ub.uni-muenchen.de/60339/
International Institute for Applied Systems Analysis Schlossplatz 1
A-2361 Laxenburg, Austria
Tel: +43 2236 807 342 Fax: +43 2236 71313 E-mail: [email protected] Web: www.iiasa.ac.at
Interim Reports on work of the International Institute for Applied Systems Analysis receive only limited review. Views or opinions expressed herein do not necessarily represent those of the
Interim Report
IR-02-031/April
Structural Change and Catching Up:
Experience of the Ten Candidate Countries
János Gács ([email protected])
Approved by
Arne Jernelöv ([email protected]) Director
Contents
1. Introduction ... 1
2. Production side of the GDP: the progress of services ... 3
3. Manufacturing production: structural shifts in time and space ... 11
4. The utilization of the GDP: saving and investment habits ... 21
5. Summary and conclusions... 27
Abstract
The paper analyzes the experience of the Central and East European candidate countries with respect to major macro-level changes in the structure of their economy relevant for their catching up. More precisely, the production and utilization sides of the GDP, as well as the structure of manufacturing industry are focused on.
The most important development on the production side of the GDP has been the substantial reduction of previously over-developed industrial activities on the one hand, and the emancipation of service activities, on the other. In the past 11 years the candidate countries caught up with countries at the same per capita level of GDP in terms of service intensity. Expanding market services have played a crucial role filling the void after central planning was abandoned, since efficient market coordination, the working of the “invisible hand” could not have developed without them. Relevant input-output coefficients show some evidence that the impact of services is deepening, this sector is contributing to and determining the production of value added at more stages of the production process than before.
Restructuring within manufacturing shows a wide variation across the candidate countries. Good performance in the phase of recovery of output was not necessarily associated with large structural shifts. The dominance of labor intensive products in manufacturing, however, indicate that productivity catching up will necessitate further massive shifts across the sub-sectors in most of the candidate countries. Even if the large share of “screwdriver operations” in the framework of multinational networks may blur the picture of manufacturing structures, we can identify that the countries that attracted the largest part of FDI managed either to achieve great structural shifts in their industry, or to develop sub-sectors with potentially high unit values, or both.
Foreword
This paper was originally prepared for and presented at the East-West Conference of the Oesterreichische Nationalbank on “Convergence and Divergence in Europe”, Vienna, November 5-6, 2001. Subsequently, a revised version was presented at the ACES session of the annual meeting of the Allied Social Science Associations, Atlanta, GA, USA, on 4-6 January 2002.
Acknowledgments
About the Author
Structural Change and Catching Up: The Experience of the Ten
Candidate Countries
János Gács
1. Introduction
The transformation of former centrally planned economies since the late 1980s was tantamount to perpetual and simultaneous structural shifts in these economies. If one were to classify these structural changes based on the factors that triggered them the following three main classes could be distinguished:
• First we should refer to the systemic changes that opened new opportunities for the actors in the economy, particularly through liberalization (of economic activities in general, including entry to markets, engaging in foreign trading, price formation) and the establishment of basic institutions of the market, or marketization (including privatization of state owned enterprises). The structural changes then were the outcome of the ensuing adjustments to the new opportunities and constraints, an endogenous process steered by the emerging incentives in the new environment. These incentive structures were assumed to be similar to those prevailing in developed market economies; however, by now we know that in addition to the traditional market incentives, the transition period also offered unique, peculiar incentives.
• The evolution of the growth process has also left its trace on the structure of the economy through the pattern of uneven growth and decline of sectors. The first phase of this process was the painful shock of the transformational recession; this was followed by the recovery, which gradually transforms to the process of real convergence toward the level of developed market economies.
• Choices and policy decisions by the governments, whether in the form of the measures related to the initial macroeconomic stabilization, setting up new social safety nets, developing the attitude towards foreign investors, or making the crucial choice about the appropriate exchange rate regimes and the dominant way of privatization, all had their impact on structural changes. Given that many transition economies are new countries (six of the ten candidate countries are new states), the establishment of these new states was also an important field of state intervention with its far-reaching implication for the structure of these economies.
Accordingly, the main question this analysis tries to answer to is whether the structural changes the candidate countries experienced recently correspond to what we expect from economies that would catch up rapidly. Another issue worth investigating is whether we see certain typical forms of development among the ten candidate countries that would predict a faster or slower growth in the future.
One difficulty of this exercise is that theory and empirical experience in general do not suggest ideal or confirmed prospective structures at the macro level that were indispensable for a fast catching up to the per capita GDP level of the advanced industrial economies. A similarity of the economic structures in the candidate countries with those in the member countries of the EU, for instance, is clearly advantageous only from the point of view of joining the euro area (due to minimizing the probability of asymmetric shocks), but that task has not been at the top of the agenda of the CEECs so far, not to mention that catching up and fast fulfillment of the euro area criteria may contradict each other. (see Dobrinsky 2001, Rosati 2001 and Pelkmans et al. 2000) Moreover, in many respects the EU member countries themselves show highly heterogeneous structures.
A larger structural move from the starting position may in principle testify a bolder move away from structures inherited from central planning, so it could be more advantageous for catching up. However, it is not necessary that the inherited distortions were proportionally reflected in the distorted macrolevel structures: the distortions, basically various forms of inefficiencies, could have been embedded in lower level structures, such as the structure of industries and the internal setup of enterprises.
According to these considerations we have not established a definite common framework for this paper in which we would analyze all structural changes and emerging structures from the point of view of catching up, but rather decided to examine the various structures according to different, although not ad hoc, criteria. In the first section of the paper the production side of GDP1 is to be analyzed primarily from the point of view of catching up with characteristic macrostructures of advanced market economies, more precisely the progress in the emancipation of services. In the second section we focus on the structure of manufacturing industry, particularly on the ‘distance’ of current structures from structures in the past and structures prevailing in the current EU member countries. Finally in the third section, in the course of investigating the utilization side of the GDP, we will investigate whether the developments have followed or should follow the proposition that high savings and investment rates are necessary for a fast catching up for the CEECs.
Before we start analyzing structural changes in the period of transition, we have to emphasize that at the end of the 1980s all the structural features that are to be discussed below showed a striking similarity across the countries of Central and East Europe.
• On the production side of GDP, for many decades, the dominating sector was the industry, particularly heavy industry.
1 The production side of GDP here is equivalent with the term the activity side or supply side of
• In most of the candidate countries the industrial structure, apart from its bias towards heavy industry, reflected the simple division of labor in which the Soviet Union provided these countries with energy sources and raw materials in exchange for deliveries of manufactured products.
• In the utilization side of GDP investments were traditionally given high priority. Net exports, at least in a large (CMEA-related) part of trade, were minimized through a clearing mechanism.
• Trade showed distinct patterns for the CMEA area and the rest of the world. The CMEA area absorbed exports of highly manufactured products, while exports to the rest of the world were made up of raw materials, food and agricultural products as well as lower-end manufactured products.
The similarity of these structures across the countries was mainly influenced by the ideology of the communist system, its major priorities, as well as its national and supranational institutions (see Kornai 1992).
2. Production side of the GDP: the progress of services
The most important development in this sphere has been the emancipation of services in general and of market services in particular. The communist ideology did not consider services an activity that produced new value, an activity that contributed to economic growth. The most obvious expression of this preposterous approach was that in the Marxist system of national accounts (the so-called Material Product System) rendering of market services did not contribute to net output, the so called Net Material Product.2 While some market services clearly did not fit the communist ideology and central planning (e.g. financial intermediation, real estate, renting and business services), even the rest were treated with suspicion, were centrally organized and strictly controlled (e.g. wholesale and retail trade, transport and telecommunications). The result was the provision of services in a centrally organized form, in insufficient volume, with low efficiency, with little attention to demand and with persistent long real and virtual queues of customers.3
Figure 1 shows a sample of 124 countries in terms of the share of total services in the production of GDP and their level of GDP per capita at PPP rates (in natural logarithm) in 1988, the year before the wave of political and economic transition
2 Interestingly, a small part of the output of nonmarket services, however, was accounted for in
the Net Material Product (see Árvay 1995).
3 To name just one example: in 1976-1985, in Hungary and Poland the average number of
started in Central and in Eastern Europe. The tendency that with economic development the tertiary sector crowds out the other two main sectors from the
Figure 1: Share of Services in GDP and ln (GDP per capita), 1988
0.00 10.00 20.00 30.00 40.00 50.00 60.00 70.00 80.00 90.00
5.00 6.00 7.00 8.00 9.00 10.00 11.00
Hun
Slovak Bulg
Est
Rom Latv
Czech Pol
Slov 91
Lith 90
[image:11.595.117.486.481.698.2](400) (1100) (3000 (8100) (22000)
Figure 2: Share of Services in GDP and ln (GDP per capita), 1999
0.00 10.00 20.00 30.00 40.00 50.00 60.00 70.00 80.00 90.00
5.00 6.00 7.00 8.00 9.00 10.00 11.00
Czech 99 Slovak 99 Pol 99
Slov 99 Latv 99
Lith 99 Hun 98
Bulg 98 Est 98
Rom 98
(400) (1100) (3000) (8100) (22000)
Figure 1: Share of Services in GDP and in (GDPper capita), 1988
Figure 2: Share of Services in GDP and in (GDP per capita), 1999
Figure 1: Share of Services in GDP and in (GDP per capita), 1988
production of GDP (first predicted by Clark 1940) is confirmed by a cross-sectional regression estimation represented by the regressional line on the figure (details of the calculation and parameters can be found in Appendix Table 1).4 The line expresses the relation that around 15 per cent growth in GDP per capita leads to 1 percentage point growth in the services share of GDP. From the point of view of our subject it is important to find that in 1988 all the candidate countries were located in a ‘cloud’ distinctly below the main trend of development.
Figure 2 shows the relevant regression for 1999 calculated for virtually the same sample; here the coefficients already show a steeper growth of service shares with the development of per capita GDP (10 per cent growth of per capita GDP leads to 1 percentage point growth in the share of services in GDP). The figure also shows the radical move that the CEECs accomplished in 11 years of transition. In 1999 already six of the ten candidate countries were above the ‘normal’ level of service intensity represented by the regression line of 1999, and all the candidate countries seem to have joined the mainstream5.
Some skeptics may say that this increase in the contribution of services to GDP is simply a reflection of the collapse of industrial output that contributed to the decline in total output (i.e. an unchanged or falling volume of services represents a higher share in the diminished volume of total output). This statement can be substantiated by the coincidence of the increase in the share of services in GDP and the severe decline of output in the CEECs, since both took place at the beginning of the 1990s. If, however, we look at data for the period 1988-1999, we find that seven of the ten candidate countries experienced real service output growth, and in these countries the cumulative difference between the real growth of services and total GDP was over 27 per cent.6 Moreover, in most countries (here the exceptions are Bulgaria and Romania) employment in services also showed a – usually modest – increase.
There is another qualification to the fast expansion of services, and this is related to the registration practices of activities on the one hand and of institutions on the other. During the period of central planning, the traditional large socialist industrial enterprises had comprised many service activities (transport, maintenance or even health and social services). After transition started, these activities, under the emerging market pressures and in association with reorganizations related to the process of privatization, were split from the mother company and continued in independent firms. It was a development similar to, but probably more intense than the emerging pattern of outsourcing in the developed market economies in the 1990s. Nevertheless, one would
4 Although the proposition of Clark and many followers was formulated for the share of
employment in the three main sectors, due to less reliable data for employment we decided to focus on the distribution of GDP.
5 As the results presented in Appendix Table 1 show, if we calculate the regressions for a
sample excluding the transition economies, the 1988 regression line becomes much steeper than the regression line based on the full sample. The 1999 lines, however, are already almost identical in the two samples.
6 The available data from WDI (2001) are, however, incomplete and possibly far from being
expect that in the CEECs the new service enterprises, if they survived, became much more efficient than they had been as service units in the original industrial mother company.
In sum, we may drop the idea that we saw only an illusory development of services in the CEECs.
One part of the expansion of services was in close relation to unleashed consumer sovereignty. Households and consumers in centrally planned economies had suffered from the suppressed choice of consumer products and services, so that following the first steps of market liberalization, they strongly responded to the new opportunities for satisfying their previously unmet demand. At the same time, much of the newly founded businesses aimed at contributing to the provision of these services to consumers and also at supplying the business sector with services. In 2001, on average 76 per cent of all entrepreneurships in the seven Central and South European candidate countries were active in the service sector. The number of service enterprises was in the millions, rather than the hundred thousands.7
A number of analysts remarked that employment in the expanding services sector was unable to absorb the enormous loss of employment in industry and agriculture during the transition.8 While this is a sad fact, one should not be misled by assuming that the role of the expanding service sector was simply to replace industry as the leading sector of the economy. In fact, one of the primary functions of the emerging service sector in the transition economies has been to enable the revival of industrial output in the market environment and enhance the strength of industry in an environment of fierce international competition.
In an economy with gradually evolving competition, growing monetization and the successive dominance of horizontal transactions over vertical ones, where producers have to seek new markets and face a multiplication of new market participants, services become critical for the survival of business. Services have played a crucial role filling the void after central planning, the bureaucratic coordination by the government, was abandoned, since efficient market coordination, the working of the “invisible hand” could not have developed without them. Trade (both wholesale and retail), marketing, juridical services, real estate and business services, transport and communications, financial intermediation and insurance have all become crucial in providing network-like connections between producers as well as between producers and consumers, with the possibilities of externalities in their use.9 In fact two countries, Poland and Hungary, already showed a pattern that one would ideally expect from this rearrangement of the role of industry and services: in both countries, following the initial decline in its output, industrial production recovered fast to the pretransition level, and in 2000 gross industrial production was 70 per cent and 50 per cent higher in the two countries, respectively, than in 1989.
In order to illustrate that services not only accounted for a larger part of economic activities in the CEECs, but also had a deeper impact by enhancing the
7 No doubt a large and variable share of these small firms are fictitious ones that are either not
active or were set up only to make some sort of tax avoidance possible.
8 See e.g. Landesmann (2000a) and Vidovic (2000).
production and exchange of all other activities, we made some calculations. We used the input-output framework to obtain a few coefficients that show the impact of domestic market services on the Hungarian economy. The results are presented in Table 1. Two kinds of coefficients were calculated, one for the direct use of services, and one for the cumulative use, i.e. taking into account the system of intersectoral flows. The table shows that in the 1986-1998 period domestic services increasingly contributed to the production process not only directly, but also through intersectoral connections. Both the coefficients of direct and cumulative use of market services show a substantial increase already in the second part of the 1980s, which continues throughout the 1990s.
What is interesting is that both coefficients indicate an increasing and deeper impact of domestic service activities in the period when the importance of total intermediary inputs (both directly and indirectly) shrinks due to the increasing openness of the economy (see the second, third and the fifth lines of the table).
To put these developments in Hungary into an international perspective, we calculated the same indicators for two EU member countries for which comparable input-output data were available, namely Denmark and Germany.
Table 1
Coefficients of direct and cumulative use of market services in the Hungarian economy calculated from input-output tables
1986 1990 1998
Direct use of domestic market services 1 0.069 0.128 0.160
Direct total use of domestic intermediary inputs 2 0.413 0.478 0.355
Direct total use of imported intermediary inputs 3 0.104 0.092 0.196
Cumulated use of domestic market services 4 0.358 0.447 0.518
Cumulated total use of domestic intermediary inputs 5 1.975 1.915 1.551
1 Direct use of domestic market services as intermediary input for the production of one unit of gross output
2 Direct total use of domestic intermediary inputs for the production of one unit of gross output
3 Direct total use of imported intermediary inputs for the production of one unit of gross output
4 Cumulated use of domestic market services as inputs for the production of one unit of final demand
5 Cumulated total use of domestic intermediary inputs for the production of one unit of final demand
Note: The input-output inverse (the source of the cumulative indices) assumes that in the system of inter-connected sectors one unit of final demand is produced. This is why the cumulated total use of domestic intermediary inputs is large than 1.
[image:14.595.93.463.318.466.2]Source: Own calculations from various publications and data base of the Hungarian Central Statistical Office
Figure 3 shows the results, which indicate that in 1998 in Hungary the direct contribution of services to total output was comparable to that recorded in Denmark and Germany. In terms of the cumulated contribution of services, however, Hungary’s lag (particularly against Germany), was still pronounced.
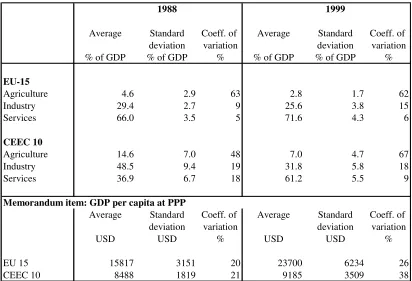
While in the primary sectoral distribution of GDP, catching up with the market economies in general rather than with the EU seems crucial, it is worth looking at how the CEEC-10 as a group has been related to the EU-15 in the past 11 years. Table 2 shows that in terms of this sectoral distribution, the development of the CEEC-10 was in harmony with the development in the EU-15.10 As for the homogeneity of the two groups, starting from a position in 1988 where, despite the straitjacket of central planning, sectoral distribution was more dispersed in the CEECs than in the EU-15, the CEEC-10 moved to a point in 1999 where their level of homogeneity is similar to that of the EU-15. This is all the more interesting because the dispersion in terms of per capita income remained larger in the CEEC-10 than in the EU.
[image:15.595.99.505.164.393.2]
10 In Table 2 and in all further calculations group averages are arithmetic unweighted averages.
Figure 3: Contribution of domestic market services to total output, direct and and cumulated (see explanations in Table 1)
0 0.1 0.2 0.3 0.4 0.5 0.6 0.7
1972 197 3
19741975 197 6
1977 1978 1979 1980198 1
1982 1983 198 4
198519861987 1988 1989 1990 19911992199 3
19941995 199 6
19971998
Source: as in Table 1 and own calculations on the OECD Input-Output data base
Denmark cumulated Germany cumuled Hungary cumulated Denmark direct Germany direct Hungary direct
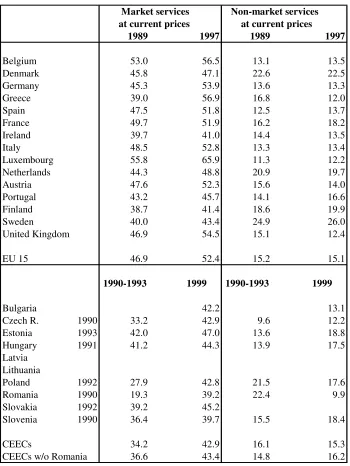
If one looks at the development of the two major groups of services (see Table 3), one finds the characteristic, though not counterintuitive feature that measured as percent of GDP, nonmarket services (public administration, defense, health, education, etc.) were and continue to be at relatively high level in the former communist countries, comparable with the level achieved in the EU.11 Consequently, today, as before, most of the CEECs’ lag behind the EU-15 can be registered in the field of market services rather than in nonmarket services.
11 The relatively high level of nonmarket services in the CEECs can be associated with the
[image:16.595.93.505.152.433.2]traditional high priorities of the communist system with respect to health and education. As a consequence of these priorities the communist countries generally achieved a relatively higher rank in the indicators of human development than in the indicators of economic growth (see Gács 2001).
Table 2
Major sectors' share in GDP in EU 15 and CEEC 10
(unweighted averages)
1988 1999
Average Standard Coeff. of Average Standard Coeff. of deviation variation deviation variation % of GDP % of GDP % % of GDP % of GDP %
EU-15
Agriculture 4.6 2.9 63 2.8 1.7 62
Industry 29.4 2.7 9 25.6 3.8 15
Services 66.0 3.5 5 71.6 4.3 6
CEEC 10
Agriculture 14.6 7.0 48 7.0 4.7 67
Industry 48.5 9.4 19 31.8 5.8 18
Services 36.9 6.7 18 61.2 5.5 9
Memorandum item: GDP per capita at PPP
Average Standard Coeff. of Average Standard Coeff. of deviation variation deviation variation
USD USD % USD USD %
EU 15 15817 3151 20 23700 6234 26
CEEC 10 8488 1819 21 9185 3509 38
Source: Own calculations based on WDI (2001)
[image:16.595.93.504.152.436.2]Table 3
Gross Value Added of Services in total Gross Value Added in the EU 15 and CEEC 10, percent
(at current prices)
Market services Non-market services at current prices at current prices
1989 1997 1989 1997
Belgium 53.0 56.5 13.1 13.5
Denmark 45.8 47.1 22.6 22.5
Germany 45.3 53.9 13.6 13.3
Greece 39.0 56.9 16.8 12.0
Spain 47.5 51.8 12.5 13.7
France 49.7 51.9 16.2 18.2
Ireland 39.7 41.0 14.4 13.5
Italy 48.5 52.8 13.3 13.4
Luxembourg 55.8 65.9 11.3 12.2 Netherlands 44.3 48.8 20.9 19.7
Austria 47.6 52.3 15.6 14.0
Portugal 43.2 45.7 14.1 16.6
Finland 38.7 41.4 18.6 19.9
Sweden 40.0 43.4 24.9 26.0
United Kingdom 46.9 54.5 15.1 12.4
EU 15 46.9 52.4 15.2 15.1
1990-1993 1999 1990-1993 1999
Bulgaria 42.2 13.1
Czech R. 1990 33.2 42.9 9.6 12.2 Estonia 1993 42.0 47.0 13.6 18.8 Hungary 1991 41.2 44.3 13.9 17.5 Latvia
Lithuania
Poland 1992 27.9 42.8 21.5 17.6 Romania 1990 19.3 39.2 22.4 9.9 Slovakia 1992 39.2 45.2
Slovenia 1990 36.4 39.7 15.5 18.4
CEECs 34.2 42.9 16.1 15.3
CEECs w/o Romania 36.6 43.4 14.8 16.2
Source: Own calculations based on Eurostat Yearbook 2001, WIIW data base, and Bank of Estonia web site
Table 3: Gross Value Added of Services in total Gross Value Added in the EU 15 and CEEC 10, percent
3. Manufacturing production: structural shifts in time and
space
In 2000, partly due to the emancipation of services, the share of manufacturing production in GDP stood at a substantially lower level in the CEECs than before transition. Today manufacturing represents about 22 per cent of GDP in the candidate countries (a slightly higher share than the average share in the EU-15). Nevertheless it has been and will be a crucial sector from the point of view of catching up: it is the sector that realizes most exchanges with the rest of the world through foreign trade, and it is also the basis for future productivity catching up.12
In the 1990s, the manufacturing sector was the most severely hit part of the candidate countries as a consequence of the transformational recession: its employment now is down by 5 million, or 40 per cent, compared to the employment recorded in 1989.13 The drastic fall in output leveled out in 1992-1994, and since than we have seen a more or less steady recovery. This expansion of output has been based mostly on productivity increases, since in all countries, except Hungary, employment in manufacturing remains on the decline. This expansion through productivity as well as many other indicators evidences a massive restructuring which can have far-reaching consequences for the candidate countries’ performance before and after their EU accession. How deep was this restructuring in the various CEECs and what kind of time pattern did it follow? How does the emerging structure of manufacturing activities in the accession countries relate to the structures prevailing in the EU? These are the question we attempt to answer below. Due to a lack of data, in this section we had to disregard the Baltic countries in most of the analysis and have focused on the remaining seven CEECs.
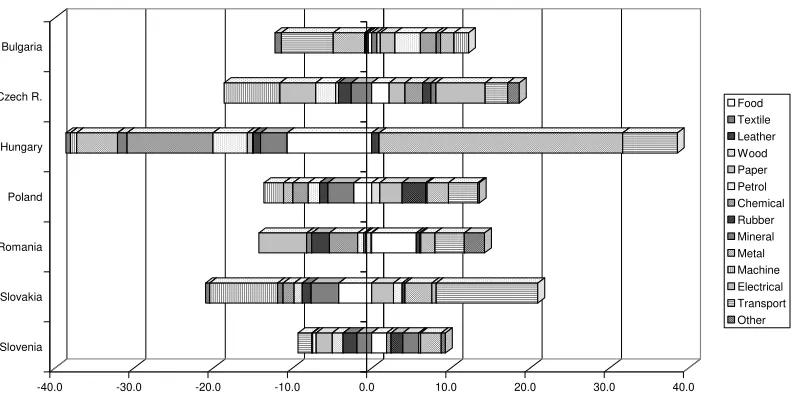
We will analyze the shifts in the sectoral composition of output among the 14 NACE 2-digit subsectors of manufacturing in 1989-2000. Table 4 and Figure 4 show the pattern of rearrangements of subsectoral shares across the manufacturing industries (within the distribution of manufacturing gross output)14. We can see that the usual size of the shift across industries in the 11 years was 12 to 20 percentage points.
12 Some of the candidate countries, however, realize as high as 30 to 37 per cent of their exports
through exports of commercial service activities (i.e. Estonia, Latvia and Bulgaria).
13 This comparison is calculated for the seven Central and South European candidate countries
(the CEEC-7), i.e. without the Baltic states.
14 With the rearrangement of manufacturing output some subsectors gain, while others lose
-40.0 -30.0 -20.0 -10.0 0.0 10.0 20.0 30.0 40.0
Source: own calculations based on data from the WIIW data base
[image:19.595.109.507.152.351.2]Slovenia Slovakia Romania Poland Hungary Czech R. Bulgaria
Figure 4: Structural shifts between 1989 and 2000 across manufacturing sub-sectors in the distribution of manufacturing output, at constant prices, percentage points
Food Textile Leather Wood Paper Petrol Chemical Rubber Mineral Metal Machine Electrical Transport Other
Figure 4: Structural shifts between 1989 and 2000 across manufacturing sub-sectors in the distribution of
manufacturing output, at constant prices, percentage points
Table 4: Sectoral shifts in manufacturing industries 1989-2000, percentage point (based on constant 1996 price data)Sectoral shifts in manufacturing industries 1989 -2000, percentage point Table 4
(based on constant [1996] price data)
Bulgaria Czech R. HungaryPoland Romania Slovakia Slovenia Average
DA Food products; beverages and tobacco -0.4 2.2 -10.7 -2.2 5.6 -4.2 1.9 -1.1 DB Textiles and textile products 0.7 -2.6 -3.4 -3.3 -0.1 -3.5 -1.9 -2.0 DCLeather and leather products -0.3 -1.6 -0.9 -1.1 0.4 -1.1 -1.7 -0.9 DDWood and wood products 0.4 -0.3 -0.1 1.0 -0.7 -1.0 -1.4 -0.3 DE Pulp, paper & paper products; publishing & printing 1.9 2.0 -0.7 2.8 -0.3 2.7 -2.0 0.9 DF Coke, refined petroleum products & nuclear fuel 3.2 -2.5 -4.3 -1.4 -0.8 1.1 -0.4 -0.7 DGChemicals, chemical products and man made fibres 2.0 2.2 -10.8 -2.0 -3.6 -1.4 0.5 -1.9 DHRubber and plastic products -0.1 1.1 1.0 3.0 -2.2 0.4 1.5 0.6 DI Other non-metallic mineral products 0.5 0.6 -1.2 0.2 -0.6 -0.7 2.0 0.1 DJ Basic metals and fabricated metal products 1.7 -4.5 -5.2 -1.2 -6.0 3.4 0.3 -1.6 DK Machinery and equipment n.e.c. 1.8 -7.1 -0.8 -2.5 0.2 -8.6 -0.1 -2.4 DL Electrical and optical equipment -4.0 6.2 30.7 2.7 1.8 0.5 2.6 5.8 DMTransport equipment -6.6 2.8 6.9 3.7 3.7 12.8 -1.8 3.1 DNManufacturing n.e.c. -0.8 1.5 -0.6 0.2 2.5 -0.5 0.5 0.4
Total percentage rearranged 1 12.2 18.6 38.6 13.6 14.2 21.0 9.3 11.0
1 Sum of the absolute values of the entries in the given column, divided by 2.
Source: own calculations based on data from the WIIW data base
Table 4: Sectoral shifts in manufacturing industries 1989 -2000, percentage point
(based on constant 1996 price data)
Slovenia (9.3 percentage points) and Hungary (38.6) emerge as outliers. The small extent of structural change in Slovenia’s manufacturing industry is a surprise, since this country has shown the most balanced and solid output performance in the region since 1993. It is true, however, that Slovenia was also the most developed of the CEECs at the beginning of the period and may not have needed as much restructuring as the rest of the group (more details follow). Hungary’s spectacular shift is seemingly attributable to a single sector’s huge contribution (electrical and optical equipment)15. This raises the suspicion (also for the Hungarians and specialists of FDI) whether this shift is not inflated somehow. One might ask, for instance, whether it was not possible that the expansive activities in this sector originated in a few multinationals’ affiliates with a high proportion of ‘screwdriver’ operations (i.e. a large volume of [imported] intermediate products, a low share of domestic value added, and then again a high volume of exports).
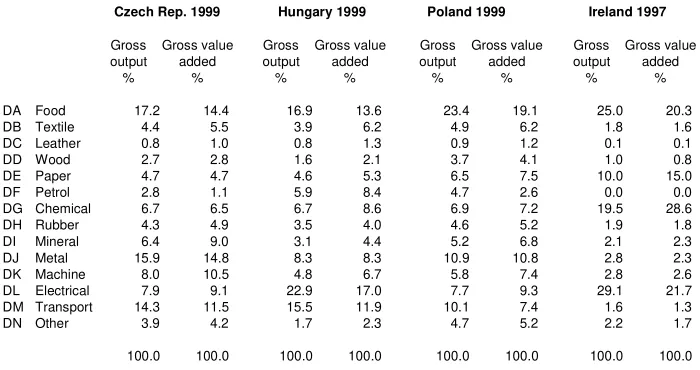
To find out whether this suspicion holds up, in Table 5 we calculated the share of manufacturing subsectors both in gross output and in gross value added for Hungary and for two additional developed candidate countries, the Czech Republic and Poland. We also included Ireland, an EU country which is known for the dominance of multinational operations in its leading manufacturing industries. As it turns out, Hungary, unlike the Czech Republic or Poland, indeed realizes relatively more gross output than value added in its leading industry (DL). This difference, however, is similar to the one that one finds in Ireland in the same leading industry (DL), and is not unlike the relation between gross output and value added in the table in the transport industries (DM) in each of the three CEECs.
Nevertheless, Hungary does have a special position among the CEEC-7 because the gross output of not only one or two subsectors of its manufacturing have become ‘inflated’ by a high proportion of ‘screwdriver operations’ (in other words, a high proportion of intermediate products), but that of the whole manufacturing industry. When we calculate the cumulative difference between the growth of gross output and gross value added in total manufacturing in the CEEC-7 for 1997-2000, our result shows that no country had as high a difference as Hungary: 33 per cent. The next countries in this series are the Czech Republic with 17 per cent, Slovakia (7 per cent) and Poland (6 per cent).
15 One may note here that in this group of countries, before 1990, only Slovenia had developed
Turning back to Figure 4 and Table 4 one can identify that the industry where most countries reduced their activity was the textile industry (DB), while the two industries that expanded most were electric and optical equipment (DL) and transport equipment (DM). The substantial reduction of activities in the production of machinery and equipment (DK) in the group of CEEC 7 was mostly attributable to the dramatic contraction of this industry in the Czech Republic and Slovakia.
Havlik (2001) finds that one additional characteristic feature of this restructuring was that production specialization increased substantially in all the CEEC-7 in the 1990s.
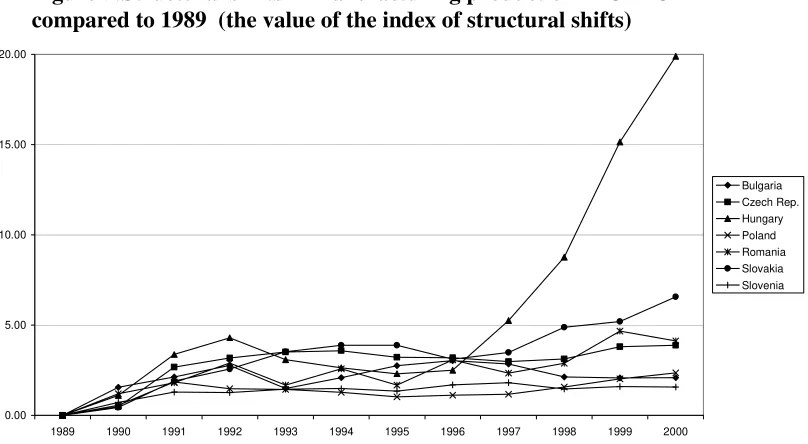
By using an indicator of structural shift16 one can investigate the evolution of sectoral rearrangements in time and compare structures in different countries with each other. Figure 5 shows the speed at which the structures of manufacturing industry (essentially points in a 14-dimensional vector space) moved away from their starting position in 1989 in CEEC-7. (This means that the respective value in the given year shows the distance of the structure in that year from the structure in 1989). The curves of the individual countries show an initial wave of structural shift that can be associated with the collapse of output in the early 1990s (passive restructuring), and a second wave starting around 1996-1997 which could be associated with active restructuring (see also
16 The formula of this indicator is the following: =
∑
−k y k y k x
k sh sh
sh
S ( )2*( /100), where
x k
sh and y
k
sh are shares in percent in the structural vector characterizing countries x and y, or the
same country in years x and y, while k is the individual industry. The indicator can change
[image:21.595.94.444.143.328.2]between 0 and 100. From among the possible indicators of structural shift we adopted this formula from Landesmann (2000a) in order to be able to compare our results with the ones in his study. For alternative indicators see Gács (1989).
Table 5:
Comparison of distribution in gross manufacturing output and gross manufacturing value added in the respective subsectors
Czech Rep. 1999 Hungary 1999 Poland 1999 Ireland 1997
Gross Gross value Gross Gross value Gross Gross value Gross Gross value output added output added output added output added
% % % % % % % %
DA Food 17.2 14.4 16.9 13.6 23.4 19.1 25.0 20.3 DB Textile 4.4 5.5 3.9 6.2 4.9 6.2 1.8 1.6 DC Leather 0.8 1.0 0.8 1.3 0.9 1.2 0.1 0.1 DD Wood 2.7 2.8 1.6 2.1 3.7 4.1 1.0 0.8 DE Paper 4.7 4.7 4.6 5.3 6.5 7.5 10.0 15.0 DF Petrol 2.8 1.1 5.9 8.4 4.7 2.6 0.0 0.0 DG Chemical 6.7 6.5 6.7 8.6 6.9 7.2 19.5 28.6 DH Rubber 4.3 4.9 3.5 4.0 4.6 5.2 1.9 1.8 DI Mineral 6.4 9.0 3.1 4.4 5.2 6.8 2.1 2.3 DJ Metal 15.9 14.8 8.3 8.3 10.9 10.8 2.8 2.3 DK Machine 8.0 10.5 4.8 6.7 5.8 7.4 2.8 2.6 DL Electrical 7.9 9.1 22.9 17.0 7.7 9.3 29.1 21.7 DM Transport 14.3 11.5 15.5 11.9 10.1 7.4 1.6 1.3 DN Other 3.9 4.2 1.7 2.3 4.7 5.2 2.2 1.7
100.0 100.0 100.0 100.0 100.0 100.0 100.0 100.0
Source: Own calculations based on OECD (2000), CSO (2000) and WIIW data base
Landesmann 2000a). Hungary, Slovakia and Romania stand out as active in the new wave, while Slovenia’s and Poland’s steady closeness to the structure of 1989 is a surprise. After all, these are the countries that achieved the highest GDP by 2000 compared to their pretransition level (114 per cent and 127 per cent, respectively); moreover Poland showed an exemplary expansion in its manufacturing output as well (achieved 146 per cent of the pretransition level). Given that the most relevant conditions were similar for all CEECs (collapse of former export markets, rapid liberalization of foreign trade), this contradiction can only be explained if we assume that in these two countries restructuring was carried out within the individual manufacturing subsectors of the manufacturing industry rather than across them.
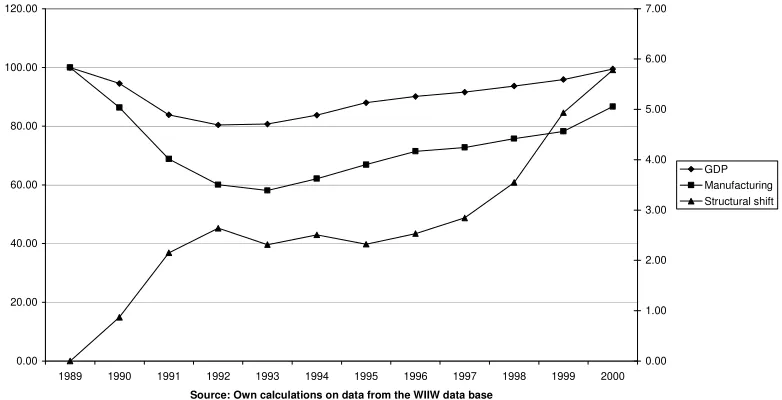
The two waves of restructuring across manufacturing industries can be also detected in Figure 6 where we depicted the development of real GDP and manufacturing production on the left axis, and the development of structural change in manufacturing on the right axis. The presence of the second wave remains visible also in the case when, due to its extraordinarily strong restructuring in 1996-2000, we take Hungary out of the sample.
Figure 5: Structural shifts in manufacturing production in CEEC 7 compared to 1989 (the vaue of the index of structural shifts)
0.00 5.00 10.00 15.00 20.00
1989 1990 1991 1992 1993 1994 1995 1996 1997 1998 1999 2000
Source: Own calculations on data of gross output at constant prices from the WIIW data base
[image:22.595.102.506.263.485.2]Bulgaria Czech Rep. Hungary Poland Romania Slovakia Slovenia
Another approach to analyze the emerging new structure of manufacturing is to compare the structure of manufacturing within the group of CEECs, as well as to make comparison with the established structures in the more advanced market economies, in this case members of the EU.
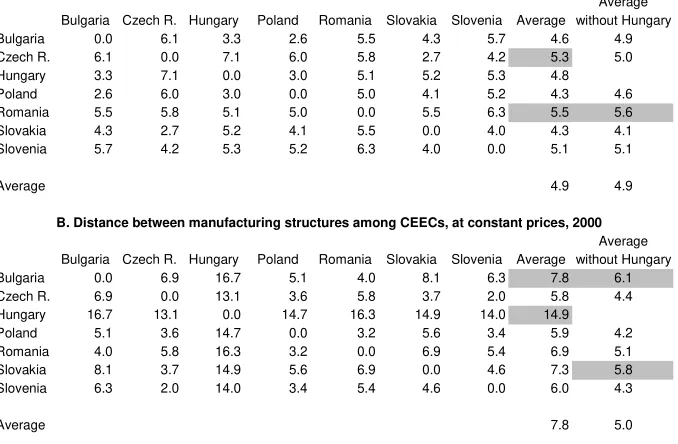
In Table 6 the results of calculations of ‘distance’ between manufacturing structures are presented for the CEEC-7 and for 11 EU member countries (for the countries in the two blocks for which comparable data were available). Again the structural shift statistics were used, this time with some modification.17 Data for 1989 and in constant prices were available only for the CEECs, while data for recent years and at current prices were available for both groups.
Table 6A shows that on the eve of transition the structure of manufacturing in the CEECs was quite balanced. The Czech Republic and Slovakia (as much as we can trust in the statistics that were reconstructed later) were close to each other, as was the group Bulgaria, Hungary and Poland. By 2000 the structures became more diverse, but mostly due to Hungary’s outlier position (see Table 6B). In fact, Hungary’s structure is so distant to all of the other CEECs that it was justified to calculate how homogenous the group is without Hungary. In the last column of Table 6B we find that the remaining six CEECs show as homogenous a structure in 2000 as they did in 1989.
17 Since the mentioned indicator has the drawback of not being commutative (i.e. the distance
from x to y is different from distance from y to x), in the calculations for structural differences
[image:23.595.107.498.137.337.2]between countries we calculated the distances both ways and used their average. Figure 6: Development of the GDP and manufacturing production (left axis) and the structural shift in
manufacturing (right axis) in CEEC 7 (1989=100 and 0)
0.00 20.00 40.00 60.00 80.00 100.00 120.00
1989 1990 1991 1992 1993 1994 1995 1996 1997 1998 1999 2000
Source: Own calculations on data from the WIIW data base
0.00 1.00 2.00 3.00 4.00 5.00 6.00 7.00
GDP Manufacturing Structural shift Figure 6: Development of the GDP and manufacturing production (left axis) and the structural shift in manufacturing (right axis) in CEEC7
Based on Table 6C, among the CEECs one group can be found within which structures are close to each other: ‘the trio’ of the Czech Republic, Slovakia and Slovenia.
Table 6
A. Distance between manufacturing structures among CEECs, at constant prices, 1989
Average Bulgaria Czech R. Hungary Poland Romania Slovakia Slovenia Average without Hungary Bulgaria 0.0 6.1 3.3 2.6 5.5 4.3 5.7 4.6 4.9 Czech R. 6.1 0.0 7.1 6.0 5.8 2.7 4.2 5.3 5.0 Hungary 3.3 7.1 0.0 3.0 5.1 5.2 5.3 4.8 Poland 2.6 6.0 3.0 0.0 5.0 4.1 5.2 4.3 4.6 Romania 5.5 5.8 5.1 5.0 0.0 5.5 6.3 5.5 5.6 Slovakia 4.3 2.7 5.2 4.1 5.5 0.0 4.0 4.3 4.1 Slovenia 5.7 4.2 5.3 5.2 6.3 4.0 0.0 5.1 5.1
Average 4.9 4.9
B. Distance between manufacturing structures among CEECs, at constant prices, 2000 Average Bulgaria Czech R. Hungary Poland Romania Slovakia Slovenia Average without Hungary Bulgaria 0.0 6.9 16.7 5.1 4.0 8.1 6.3 7.8 6.1 Czech R. 6.9 0.0 13.1 3.6 5.8 3.7 2.0 5.8 4.4 Hungary 16.7 13.1 0.0 14.7 16.3 14.9 14.0 14.9 Poland 5.1 3.6 14.7 0.0 3.2 5.6 3.4 5.9 4.2 Romania 4.0 5.8 16.3 3.2 0.0 6.9 5.4 6.9 5.1 Slovakia 8.1 3.7 14.9 5.6 6.9 0.0 4.6 7.3 5.8 Slovenia 6.3 2.0 14.0 3.4 5.4 4.6 0.0 6.0 4.3
Average 7.8 5.0
C. Distance between manufacturing structures among CEECs, at current prices, 1999-2000
Bulgaria Czech R. Hungary Poland Romania Slovakia Slovenia Average Bulgaria 0.0 7.0 11.3 5.5 5.7 7.0 6.7 7.2 Czech R. 7.0 0.0 8.5 4.3 5.4 2.7 2.7 5.1 Hungary 11.3 8.5 0.0 9.5 11.6 8.7 8.4 9.7 Poland 5.5 4.3 9.5 0.0 6.8 6.2 4.8 6.2 Romania 5.7 5.4 11.6 6.8 0.0 5.1 6.1 6.8 Slovakia 7.0 2.7 8.7 6.2 5.1 0.0 3.8 5.6 Slovenia 6.7 2.7 8.4 4.8 6.1 3.8 0.0 5.4
Average 6.6
D. Distance between manufacturing structures among EU member countries, at current prices, 1996-1998
Austria Finland France Germany Greece Ireland Italy Portugal Spain Sweden UK Average Austria 0.0 5.8 6.4 4.4 7.8 17.6 2.7 5.2 4.3 4.0 2.7 6.1 Finland 5.8 0.0 8.8 8.1 11.3 17.3 7.3 8.8 8.7 5.0 6.4 8.7 France 6.4 8.8 0.0 3.7 11.8 19.3 6.4 8.5 7.0 4.8 5.5 8.2 Germany 4.4 8.1 3.7 0.0 9.7 18.9 4.4 6.8 4.8 3.6 3.5 6.8 Greece 7.8 11.3 11.8 9.7 0.0 17.2 7.4 5.5 5.8 10.9 7.1 9.4 Ireland 17.6 17.3 19.3 18.9 17.2 0.0 19.0 18.6 17.9 17.7 17.1 18.1 Italy 2.7 7.3 6.4 4.4 7.4 19.0 0.0 4.2 4.4 5.4 3.6 6.5 Port 5.2 8.8 8.5 6.8 5.5 18.6 4.2 0.0 4.3 7.7 4.6 7.4 Spain 4.3 8.7 7.0 4.8 5.8 17.9 4.4 4.3 0.0 6.4 3.0 6.6 Sweden 4.0 5.0 4.8 3.6 10.9 17.7 5.4 7.7 6.4 0.0 4.0 6.9 UK 2.7 6.4 5.5 3.5 7.1 17.1 3.6 4.6 3.0 4.0 0.0 5.7
Average 8.2
Table 6D shows the distance between pairs of countries in the EU. This block shows a higher heterogeneity than the block of the CEECs. Clear outliers are Ireland, Greece and to some extent Finland. The closest small group within the 11 countries is ‘the quintet’ of Austria, Germany, Italy, the UK and Spain.
The sizable (and not easy to comprehend) table that helps make understandable the closeness of structures between countries in the EU on the one hand and Eastern Europe on the other was put into the Appendix (Appendix Table 2). The main lessons from the table are summarized in Figure 7: In the structure of manufacturing, neither Hungary nor Bulgaria or Romania show a similarity to the structure of any country in the EU-11 (one exception is the closeness of Bulgaria’s structure to that of its neighbor Greece). Of the remaining CEECs the trio of the Czech Republic, Slovakia and Slovenia shows a closeness to the quintet of Austria, Germany, Italy, the UK and Spain, while Poland falls closer to the Southern European countries of Spain and Portugal (as well as to the UK). The similarity of the EU quintet and the CEEC trio is due to the relatively high share of metallurgy (DJ) and transport equipment (DM), and the relatively low share of food production (DA), paper (DE) and the chemical industries (DG) in both groups. Poland and the two Southern countries show the characteristic feature of a relatively large share in food production (DA), manufacturing of wood (DD) and mineral products (DI), and a relatively modest share in chemical (DG), machine (DK) and electrical (DL) manufacturing.
Our results, to some extent, contradict to those of Landesmann (2000a), who found that the manufacturing structure of the Czech Republic, Slovenia and Slovakia is close to that of the group of Northern European countries (Belgium, France, Germany and the UK), while the structures of Bulgaria, Poland and Romania lie close to those of the south European EU members (Greece, Spain and Portugal). One of the reasons for this discrepancy may have been that Landesmann used constant price data while we used data at current prices.
There are many ways of characterizing certain industrial structures: one can show their typical factor intensity, the share of subsectors with typically dynamic and sluggish demand, the potential for productivity or unit labor cost gains, or other factors. In order to further characterize the manufacturing sectors that emerged in CEECs we decided to investigate the ‘cream’ of the manufacturing output, i.e. that part earmarked for exports to the European Union. Given that in 1999 the average share of manufacturing output that the CEECs exported to the EU was 33 per cent, this ‘cream’, in fact, contains quite a large part of the ‘cake’.18
For our analysis we selected a new framework, the so-called new WIFO taxonomy, which was theoretically elaborated and technically accomplished by Michael Peneder (Peneder 2001). This scheme groups individual industries at the NACE 3 level
18 The export shares in gross output are the following for the individual countries: Bulgaria 31
according to their typical combinations of factor inputs to reveal (1) exogenously given competitive advantages based on factor endowments, and (2) endogenously created advantages based on strategic investments in intangible assets such as marketing and innovation. This taxonomy comprises five mutually exclusive groupings: these are mainstream manufacturing, labor-intensive, capital-intensive, marketing-driven and research-driven industries. We are interested that what factor input combinations are typically used in the manufacturing exports of the CEECs and how they compare to combinations used in the export of the EU member countries.
Figures 8 and 9 show the results of our calculations in the form of distribution of exports to EU according to the mentioned classes of manufacturing industries. As expected, the exports of CEECs, as a group, are distinct from the exports of the EU member countries in many respects. CEEC exports are still characterized by very high ratios of labor intensive industries (in the case of Lithuania and Latvia these make up more than 70 per cent of exports), while research-driven industries represent a much smaller part than in the EU member countries. The high share of labor-intensive industries is certainly good for keeping the otherwise substantially reduced employment in manufacturing. However, it also indicates that productivity catching up will require massive intersectoral restructuring, since labor-intensive industries, as a rule, have small potential for productivity increases.19
The low share of research- and technology-intensive exports is all the more important because these exports in the EU show several times higher unit values than the other classes of export products (probably due to the greater opportunity they offer
[image:26.595.87.452.87.350.2]
19 See European Commission (1999).
Figure 7: Distance in terms of manufacturing structures, 1996-2000
Ger many Austria Czech R . Sl ovaki a UK Italy Sloveni a
P oland Spai n
P ortug al Greece
Bul garia
Figure 8: Distribution of CEEC exports to the EU by industries characterized by specific input combinations, 1999 0% 20% 40% 60% 80% 100% Bulgaria Czech Rep.
Estonia Hungary Latvia Lithuania Poland Romania Slovakia Slovenia CEEC 10
Source: own calculations on the Comext data base
Research Capital Marketing Labor Mainstream
Figure 9: Distribution of exports of EU countries to the EU by industries characterized by specific input combinations, 1999
0% 20% 40% 60% 80% 100% Aust ria Belg ium Denm ark Fin land Fran ce Germ any Gree ce Irelan d Italy Neth erl. Portu gal Spai n Sw eden UK
Intra -EU
Source: own calculations on the Comext data base
[image:27.595.110.507.459.665.2]Research Capital Marketing Labor Mainstream
Figure 8: Distribution of CEEC exports to the EU by industries characterized by specific input combinations, 1999
for vertical integration). Some candidate countries have managed to build up a sizeable research-driven export sector, particularly Hungary, Estonia and the Czech Republic (in this order); in fact these countries are also the ones that attracted the highest cumulated FDI per capita so far. Further research should establish how much the CEECs can, in fact, realize from the potentially high unit values.20
Marketing- (or advertising-) driven industries (made up mostly of food, detergents, cleaning articles, perfumes and other consumer products) again play much smaller role in the exports of the CEECs than in the EU (only the Scandinavian EU members show shares as low as the CEECs here).
Despite the high structural variation across the EU member countries, a strict comparison would find now only Hungary’s export structure close to the export structure of any EU member country. With a little more tolerance, however, we could say that in some additional candidate countries (such as the Czech Republic, Slovakia and Slovenia) structures resemble the structure of certain EU member countries, notably those of Greece and Portugal.
4. The utilization of the GDP: saving and investment habits
The conventional wisdom about the desirable shifts on the utilization side of GDP in the candidate countries is more or less clear.
The communist period was characterized by a high level of domestic savings, which in some countries – particularly Bulgaria, Hungary and Poland – were complemented with external savings (through external borrowing).21 Investment ratios were high in an international comparison: data (albeit incomplete) show that in the period of 1980-1989 the candidate countries had an average gross investment ratio of 32 per cent, while the average in the EU-15 was 22 per cent. In the late 1980s in Central and Eastern Europe, the stagnation of output coupled with a high investment ratio showed declining returns to investments.
After the start of transition, apart from the apparent shocks (of output decline, price inflation, emerging unemployment, etc.) the whole institutional background and incentive structure for decisions on consumption and savings changed due to the move from central planning to the market. Earlier, the majority of the decisions on savings and investment were made by the state or in the centralized hierarchy of the state based on certain dogmas and priorities of the system and formulated in the framework of
20 In a more detailed analysis Havlik et al. (2001) found that Hungary, Slovakia and Slovenia
achieved unit values equal to EU levels in the research-driven sector.
21 Most attempts in the literature to prove that the high level of savings in the communist
mandatory planning (see Kornai 1992, chapter 9). In the evolving market system most of the decisions on consumption, savings and investment are to be made by the consumers and private firms based on, as it is assumed, the criteria prevailing in market economies, such as the intertemporal maximization of consumer utility, consumption smoothing, profit maximization, and the like.
It is natural that the evolution of the new system has taken time, and in the interim period various transitory criteria of savings and investment were applied in decisions. For instance, on the one hand, liberalization of markets and imports led to a euphoria of consumer purchases to meet pent-up demand. In addition, with opening new perspectives for reaching West European living standards, in principle future income and, accordingly, wealth and optimal consumption increases (see Burda and Wyplosz 1997, p. 85). On the other hand, due to the emergence of high inflation, the decline in real incomes and the threat of unemployment, consumers were more likely to focus on their current situation. It was unlikely that in the hope of future incomes they would borrow; rather, they developed a habit of precautionary savings for pending bad days. The uncertainties of the first years of transition did not provide clear prospects of the enterprises either for savings or investments. To illustrate the rearrangements of savings in this transitory period, in Figure 10 we show the development of savings by sectors in Hungary. It is clear that in the first years of transition the corporate sector had hardly any savings.
[image:29.595.104.506.438.635.2]One could expect that, following the early shocks of transition, as economic recovery evolved, savings would return to relatively high levels: recent theories of savings emphasize the growth of income and the income level as the determinants of
Figure 10: Hungary: Saving rates by sectors, and grosss national savings (percent of GDP)
-5 0 5 10 15 20 25 30
1991 1992 1993 1994 1995 1996 1997 1998 1999 2000
Source: National Bank of Hungary Annual Report (various issues) and Quarterly Report on Inflation, March 2001, Note: savings from 1995 on are inflation adjusted
Gross national savings Household sector Corporate sector General government
gross national savings at least as much, if not more, than the other way round (see Loayza et al. 1998a, 1998b, and Rodrik 1998). These higher savings rates would
probably be lower than the pretransition rates. Some analysts, however, such as Sachs and Warner (1996), believe that without achieving national saving rates characteristic of the 'very fast growing economies' (basically the East Asian ‘tigers’ plus Chile and Mauritius), a fast catching up by the CEECs would be impossible.22
Beside high domestic savings one could expect that, due to anticipated higher returns to capital in the East European region, domestic resources would be complemented with increasing external savings, and the combination of these savings would be the base for higher investment rates necessary for higher growth. As the first six columns in Table 7 show, while some of these logical expectations were realized, some were not. Domestic savings in general did not show an upward adjustment in the second half of the 1990s in the group (the exceptions are Hungary and Bulgaria). Investments, however, picked up, basically based on the additional inflow of foreign savings reflected also in the export-import balance. The Czech Republic and Slovakia stand out as prominent in both saving and investment ratios, both in the middle and the late 1990s. This seems to indicate the continuation of a long-term tradition of thrift in these two countries. As for the source of these savings, UN ECE (2001) indicates that in the second half of 1990s in the Czech Republic about 89 per cent, in Slovakia 94 per cent of the domestic savings came from households and the corporate sector.
Only few studies analyze the determining factors of the variation of savings and investment ratios in the transition economies and, what is more, try to construct time series for the development of the stock of physical capital that could eventually be associated with the growth of output.23 The estimation of the development of the physical capital stock should involve, in addition to taking into account the new fixed capital formation, the estimation of the initial capital stock, the drastic depreciation of this stock at the beginning of the transition period, and the application of depreciation profiles to different parts of the physical capital during the 1990s. Since we do not have reliable cross-country data either for the initial capital stock or the mentioned depreciation coefficients, for an illustration for the investment efforts and the potential increment to gross physical capital we made a simple calculation: we calculated the average gross fixed investment shares for the 1990s and the cumulated additional gross fixed capital (i.e. with no depreciation applied). The cumulated gross fixed capital is expressed in terms of the starting (1989) GDP of each country, and its size reflects the combined effect of the development of fixed investment ratios and of the GDP. The results are presented in Figure 11. The figure shows again the outstanding investment efforts in the Czech Republic and Slovakia; in contrast, Latvia and Bulgaria could accumulate only moderate additional capacities, due both to their relatively low investment ratios and to the low level of output.
22 The rates achieved by the 'very fast growing economies', however, are comparable to the rates
of the communist economies earlier.
23 For the few studies see for instance Denizer and Wolf (1998), UN ECE (2001), Simon and
In any economy, but especially in transition economies, one has to ask whether the domestic savings ended up in productive investments, and whether the investments were made in projects that eventually contributed to economic growth. The answers are not obvious. As emphasized by Benácek (2001) the persisting high investment shares in the Czech Republic and Slovakia have to be qualified in the light of the high percent of bad loans in those countries: “a large part of the savings were used for the underpinning of privatization transfers by means of bank loans for unspecified acquisitions, instead of using them strictly for productive purposes, such as restructuring, R&D, new investments, training new skills, etc.” Data on bad loans in the last column of Table 7 confirm this view and indicate that one has to be cautious in evaluating high or low saving and investment ratios in the CEECs.
[image:31.595.100.506.153.361.2]From the point of view of catching up the crucial question is once certain investment ratios have been achieved, what contribution would the resulting additional physical capital make to the growth of output. The obvious tools to answer a question like this are growth models; however, due to lack of reliable and sufficiently long series of data there have been only very few attempts to perform such model estimations. In Figures12 and 13 we present the results of a recent growth accounting exercise carried out by Rumen Dobrinsky (2001) in the framework of IIASA’s research project ‘Catching Up and Accession’. The estimation included the following steps: (a) establishing the data series for the primary distribution of income in the CEEC economies for the compensation of labor and capital, based on the SNA framework; (b) reconstruction of the missing time series for fixed capital stocks in the CEECs with the use of the so-called Perpetual Inventory Method; (c) calculation of the Solow residual,
Figure 11: Average Gross Fixed Investment Ratios for 1990-1999 (%, right scale) and Cumulated Gross Fixed Capital in 1999 (in % of GDP in 1989, left scale)
0.0 50.0 100.0 150.0 200.0 250.0 300.0
Bulgaria Czech Republic
Estonia Hungary Latvia Lithuania Poland Romania Slovak Republic
Slovenia
Source: Own calculations based on data from WDI (2001) and WIIW data base
0.0 5.0 10.0 15.0 20.0 25.0 30.0 35.0
Cumulated Fixed Capital Average Fixed Inv. Ratio
i.e. total factor productivity (TFP) with the application of the simple Solow growth function.
Table 7
Gross Domestic Savings, Gross Domestic Investments, Export-Import Balance and Bad Loans
(% of GDP)
1994-1995 1998-1999 1995-1999
Savings Investment Exp-imp* Savings Investment Exp-imp* Bad loans
(% of GDP) (% of GDP) % of total loans
Bulgaria 12.4 12.6 -1.1 15.0 18.0 -4.5 13.4
Czech R. 29.6 31.9 -3.8 26.9 29.1 -1.6 29.1**
Estonia 21.3 27.2 -9.5 19.5 27.0 -8.1 2.7***
Hungary 15.6 23.1 -3.9 24.7 29.3 -2.3 5.9
Latvia 20.9 18.4 -0.3 16.5 27.0 -12.2 13.8
Lithuania 15.4 21.6 -8.9 12.0 23.7 -11.1 20.4
Poland 21.1 18.7 2.3 20.8 26.7 -5.8 15.3
Romania 21.4 24.6 -3.9 15.2 20.7 -6.2 49.3****
Slovakia 28.7 25.2 3.3 26.5 34.0 -8.2 38.2
Slovenia 24.2 22.1 0.5 25.5 26.9 -2.8 12.3
Average 21.0 22.5 -2.5 20.2 26.2 -6.3 20.0
Memorandum item
EU 15 average 22.6 19.7 2.9 24.0 21.0 3.9
* Balance of exports and imports of goods and services ** Excludes loans on the books of Konsolidacni Banka, banks in receivership and the loan of CSOB to Slovenska Inkasni. *** Refers to provisions for non-collectible loans
**** Includes overdue loans and interest classified as doubtful and loss-making. Data for bad loans for Credit Bank between 1994 and 1996 and Dacia Felix Bank in 1997 are not included
[image:32.595.119.500.216.419.2]Source: UN ECE (2001), WDI (2001) and EBRD (2000)
Figure 12: Contribution of labor, capital and total factor productivity (TFP) to growth of GDP in the CEECs in the period 1995-1999, annual average rates, percent
-3 -2 -1 0 1 2 3 4 5 6
Bulgaria Croatia Czech
Republic
Estonia Hungary Latvia Lithuania Poland Romania Slovakia Slovenia
Source: Dobrinsky (2001)
[image:33.595.110.497.409.603.2]Labor Capital TFP
Figure 13: Contribution of labor, capital and total factor productivity (TFP) to the growth of GDP in selected EU member states in the period 1995-1999, annual average rates, percent
-3 -2 -1 0 1 2 3 4 5 6
Austria Belgium Denmark France Germany Italy Netherlands Spain Sweden UK
Source: Dobrinsky (2001)
Labor Capital TFP
Figure 12: Contribution of labor, capital and total factor productivity (TFP) to growth of GDP in the CEECs in the period 1995-1999, annual average rates, percent
Figure 12 presents the results for 1995-1999, the first period in which we can speak about growth at all in the group of the CEECs, and in which there was a higher chance that the assumptions of the Solow model (profit maximizing behavior, perfect markets) were fulfilled in the candidate countries than earlier. The figure for the CEECs shows the interesting result that the recovery period of (most of) the CEECs was dominated by gains in TFP.24 The increases in TFP in 1995-1999 followed big drops in the preceding five years in most of the countries (not included in the figure); the exceptions were Hungary and Poland, which realized a TFP increase even in 1990-1994. All in all, the strong role of TFP in the late 1990s shows that there have been large reserves for improvements in allocative efficiency and X-efficiency. This potential was realized to a large extent through industrial restructuring, privatization, improving corporate governance, establishing a sounder financial system, i.e. through means with relatively small contribution of additional fixed capital that one assumes to be associated more with improvements in technical efficiency.
The prominence of TFP in supporting growth in the CEECs in 1995-1999 was in sharp contrast to the pattern of sources of growth in the EU member countries the same period. In the EU the primary importance of TFP was rather an exception, while the dominance of the contribution by capital was the rule. The large discrepancy between the CEECs and the EU in terms of sources of growth (at least in this growth accounting framework) can indicate that even in the near future there will be opportunities for substantial gains in TFP without the requirement to increase the investment ratios to levels achieved in the pretransition period, or maintained in the ‘very fast growing economies’.
5. Summary and conclusions
The investigation of structural changes at the macro level did not, and could not, provide a coherent and clear picture about the current stage and future potential of real convergence of the candidate countries. Each sphere of the analysis, however, offered interesting lessons about various aspects of the catching up process.
The most important development on the production side of the GDP has been the substantial reduction of previously overdeveloped industrial activities on the one hand and the emancipation of service activities on the other. Expanding market services have played a crucial role in filling the void after central planning was abandoned, since
24 One could suspect that the low contribution of the capital to growth was due either to too high
efficient market coordination, the working of the ‘invisible hand’, could not have developed without them. Although certain lines of services cannot avoid backlashes (for instance, no transition economy could escape one or two waves of banking crises and painful bank restructuring), there is evidence that the impact of services is deepening, this sector is contributing to and determining the production of value added at more stages than before.
While the shift in services was almost uniform across the CEECs, restructuring within manufacturing showed a wide variation across the candidate countries. Interestingly, the good performance in the phase of recovery of output was not necessarily associated with large structural shifts (at least not at the NACE 2-digit level). The current dominance of labor-intensive products in manufacturing, however, indicate that productivity catching up will necessitate further massive shifts across the subsectors in most of the candidate countries. Even if a large share of ‘screwdriver operations’ in the framework of multinational networks may distort the picture of manufacturing structures, we may acknowledge that the countries that attracted the largest part of FDI managed either to achieve high structural shifts in their manufacturing, or to develop subsectors with potentially high unit values, or both.
References
Árvay, J. (1995) The impact of national accounting systems on growth rates, in: Holzmann, R., Gács, J. and Winckler, G. (Eds.) Output Decline in Eastern
Europe: Unavoidable, External Influence or Homemade? Dordrecht: Kluwer
Academic Publishers
Benácek, V. (2001) Generic Private Sector in an Economy of Transition: Developments and Impacts on the Czech Economy, IIASA Interim Report IR-01-046, International Institute for Applied Systems Analysis, Laxenburg
Burda, M. and Wyplosz, Ch. (1997) Macroeconomics: a European text, Oxford: Oxford
University Press
CESTAT Statistical Bulletin, 2001, No. 1, Budapest
Charemza, W. and Davis, Ch. (1989) Models of Disequilibrium and Shortage in
Centrally Planned Economies, London: Chapman Hall
Clark, C. (1940) The conditions of Economic Progress, London: Macmillan
CSO (2000) Statistical Yearbook of the Czech Republic 2000, Prague: Czech Statistical
Office
Darvas, Zs. and Simon, A. (2000) Capital Stock and Economic Development in Hungary, Economics of Transition, March 2000
Denizer C. and Wolf H. C. (1998) Aggregate Savings in the Transition, Paper prepared for the World Bank project “Saving Across the World”
Dobrinsky, R. (2001) Convergence in Per Capita Income Levels, Productivity Dynamics and Real Exchange Rates in the Candidate Countries on the Way to EU Accession, IIASA Interim Report IR-01-038, International Institute for Applied Systems Analysis, Laxenburg
European Commission (1999) The Competitiveness of European Industry, DG
Enterprise, Luxembourg: Eur.-Op.
Gács, J. (1989) Changes in the Structure of Production and Foreign Trade of the Hungarian Industry in the Period of Restrictions (1987-1986), Acta Oeconomica
Vol. 40. No. 1-2
Gács, J. (1994) Output Decline and the Demise of the CMEA and the USSR: the Case of Hungary, Empirica Vol. 21, No. 1, (1994)
Gács, J. (2001) Catching Up, Accession and Human Development, Paper presented at the IIASA workshop “Catching Up and EU Accession” in Stockholm, May 2001, International Institute for Applied Systems Analysis (IIASA), Laxenburg GUS (2000) Polski rocznik statystyczny 2000, Warsaw: Glowny Urzad Statystyczny